Recommended

Recommended
More Related Content
What's hot
What's hot (20)
Viewers also liked
Similar to Getting the Most from Widefield Microscopy
Similar to Getting the Most from Widefield Microscopy (20)
Getting the Most from Widefield Microscopy
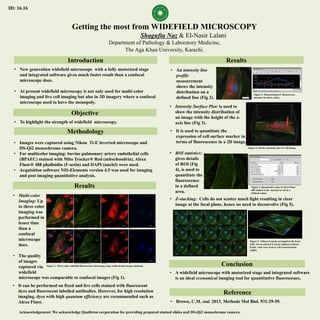
- 1. Getting the most from WIDEFIELD MICROSCOPY Shagufta Naz & El-Nasir Lalani Department of Pathology & Laboratory Medicine, The Aga Khan University, Karachi. Introduction Objective Results • To highlight the strength of widefield microscopy. • New generation widefield microscope with a fully motorized stage and integrated software gives much faster result than a confocal microscope does. • At present widefield microscopy is not only used for multi-color imaging and live cell imaging but also in 3D imagery where a confocal microscope used to have the monopoly. • Images were captured using Nikon Ti-E inverted microscope and DS-Qi2 monochrome camera. • For multicolor imaging: bovine pulmonary artery endothelial cells (BPAEC) stained with Mito Tracker® Red (mitochondria), Alexa Fluor® 488 phalloidin (F-actin) and DAPI (nuclei) were used. • Acquisition software NIS-Elements version 4.5 was used for imaging and post imaging quantitative analysis. Acknowledgement: We acknowledge Qualitron corporation for providing prepared stained slides and DS-Qi2 monochrome camera. • A widefield microscope with motorized stage and integrated software is an ideal economical imaging tool for quantitative fluorescence. • Multi-color Imaging: Up to three color imaging was performed in lesser time than a confocal microscope does. • The quality of images captured via widefield Methodology Results Figure 1. Three color widefield fluorescence microscopy (top) confocal microscopy (bottom). • Z-stacking: Cells do not scatter much light resulting in clear image at the focal plane, hence no need to deconvolve (Fig 5). • Intensity Surface Plot: is used to show the intensity distribution of an image with the height of the z- axis line (Fig 3). Figure 3. Surface intensity plot of a 2D image. • It is used to quantitate the expression of cell surface marker in terms of fluorescence in a 2D image. • ROI statistics: gives details of ROI (Fig 4), is used to quantitate the fluorescence in a defined area. Figure 4. Quantitative data of Alexa Fluor 488 stained Actin marked as red in a defined region. • Brown, C.M. etal. 2013. Methods Mol Biol. 931:29-59. • An intensity line profile measurement shows the intensity distribution on a defined line (Fig 2). Figure 2. Measurement of fluorescence intensity for three colors. Figure 5. Fifteen Z-stacks arranged in tile form (left) Seven selected Z-stacks (optical sections) 0.3μm each were used in 3-D reconstruction (right). microscope was comparable to confocal images (Fig 1). • It can be performed on fixed and live cells stained with fluorescent dyes and fluorescent labelled antibodies. However, for high resolution imaging, dyes with high quantum efficiency are recommended such as Alexa Fluor. Conclusion Reference ID: 16.16