1. DECONVOLUTION gives clarity to widefield microscopy
Shagufta Naz, Sadia Habib, El-Nasir Lalani
Department of Pathology & Laboratory Medicine,
The Aga Khan University, Karachi.
Background
Objective
Methodology
Results
Conclusion
• To introduce a computational solution to remove blur from images
captured via widefield epi-fluorescence microscope.
• Skin tissue 10μm thick was stained with biotinylated Lycopersicon
esculentum and streptavidin conjugated cy3. Nuclei stained with DAPI.
• Bovine pulmonary artery endothelial cells (BPAEC) stained with
MitoTracker® Red for mitochondria, Alexa Fluor® 488 phalloidin for
F-actin and DAPI for nuclei were used.
• Images were captured using Nikon Ti-E inverted microscope and DS-
Qi2 monochrome camera.
• Acquisition software NIS-Elements version 4.5 and Deconvolution
modules were used for imaging and post imaging analysis respectively.
• Owing to strong computational alogrithms and sensitive camera
widefield microscopy has found to be a much more sensitive imaging
tool.
• Nonetheless, a confocal laser scanning microscope (CLSM) is still needed
when the sample thickness is > 20 – 30μm.
Acknowledgement: We acknowledge Qualitron corporation for providing prepared stained slides, deconvolution module and camera.
• Limitation associated with widefield
microscope is that it collects the entire
fluorescent signal coming from focal
plane as well as above and below the
focal plane (Fig 1).
• This results in the degradation of
contrast of the raw image which
appeared as “blur” (Fig 2).
• The blur produced is of two types:
one caused by microscope point
spread function (PSF) and other by
random noise. Hence two kinds of
techniques are available to remove
the blur: optical and computational.
• Deconvolution is a computational
technique use to improve contrast
and resolution of digital images.
Often it is considered as an alternate
to confocal. However, it is not strictly
true because confocal images can
themselves be deconvolved.
Figure 1. Comparison between optical path of
widefield and confocal microscope.
Figure 2. Cy3 stained 10μm thick tissue
via widefield fluorescence microscopy.
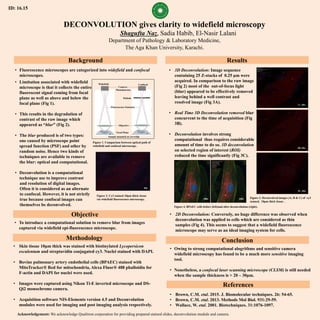
• 3D Deconvolution: Image sequence
containing 25 Z-stacks of 0.25 µm were
acquired. In comparison to the raw image
(Fig 2) most of the out-of-focus light
(blur) appeared to be effectively removed
leaving behind a well contrast and
resolved image (Fig 3A).
• Real Time 3D Deconvolution removed blur
concurrent to the time of acquisition (Fig
3B).
• Deconvolution involves strong
computational thus requires considerable
amount of time to do so. 3D deconvolution
on selected region of interest (ROI)
reduced the time significantly (Fig 3C).
Figure 3. Deconvolved images (A, B & C) of cy3
stained, 10μm thick tissue .
Figure 4. BPAEC cells before (left)and after deconvolution (right).
• 2D Deconvolution: Conversely, no huge difference was observed when
deconvolution was applied to cells which are considered as thin
samples (Fig 4). This seems to suggest that a widefield fluorescence
microscope may serve as an ideal imaging system for cells.
• Fluorescence microscopes are categorized into widefield and confocal
microscopes.
60x
3C, 60x
3A, 60x
3B, 60x
100x
References
• Brown, C.M. etal. 2015. J. Biomolecular techniques. 26: 54-65.
• Brown, C.M. etal. 2013. Methods Mol Biol. 931:29-59.
• Wallace, W. etal. 2001. Biotechniques. 31:1076-1097.
100x
ID: 16.15
Pinhole
Camera /
Photodetector
Widefield Confocal
Objective
Sample mounted on coverslip
Focal Plane
Fluorescence Emission