This study compares image quality between a Nikon light microscope and a Zeiss scanning microscope using histology slides stained with H&E. 14 images from renal carcinoma tissue slides were acquired with each microscope and analyzed based on pixel value distributions, resolution, and quantitative image quality metrics. While both microscopes produced diagnostically adequate images, the Zeiss microscope had higher resolution and better control over metadata, which is important as computational analysis of histology images increases. Further analysis is needed to more precisely quantify differences in image quality between microscopes.
1. Andrew I. Meyer1
, Todd H. Stokes 2
, Sonal Kothari 2
, May D. Wang 2
1
Purdue University, Weldon School of Biomedical Engineering
2
Georgia Tech, Coulter Dept. of Biomedical Engineering
Pathological Imaging Quality Control: Biopsy Segment
Imaging versus Whole Tissue Slide Imaging
IntroductionIntroduction
The goal of this study is to develop methods to compare image quality between
different light microscope configurations. The many microscope design factors that
influence image quality include numeric aperture (NA) of the objective, resolution
(measured as pixel physical size), depth of field, manual- vs auto-focus, illumination
uniformity, color filter spectral response (quantum efficiency, band-pass vs. high-
pass, IR filters, etc.), exposure time, and optical aberration. The qualitative goal of all
of these choices is to produce images that accurately represent tissue morphology to
produce reliable knowledge. However, these factors vary widely in microscopes,
largely due to a secondary goal to keep imaging systems flexible. These variations
confound computational analysis, and published results commonly provide only
magnification as a guide to interpret data.
We acquired and analyzed 14 images from three H&E-stained, diagnostic renal cell
carcinoma slides prepared in the Emory University Pathology Department. We
compared two microscopes: a Nikon Eclipse E600 (maintained in core facility) and a
Zeiss AxioImager Z2 scanning microscope (designed in our lab for quantum dot (QD)
fluorescence). Images were chosen randomly from regions of interest indicated by
pathologists as important for cancer grading. The Nikon microscope has a 100W
Halogen light source (set to ~9V), color balancing and IR filters, a Qimaging Retiga
1300 color camera with auto-exposure, and a Nikon 40x Plan-Fluar Ph2 (NA:0.75)
objective. The Zeiss microscope has a 75W Halogen light source (set to ~4.5V),
band-pass QD-tuned fluorescent filter cubes, an AxioCam MRm monochrome
camera with fixed exposure for each color (R=5ms,G=9ms,B=55ms), and a 40x
Zeiss EC-Plan Neofluar (NA:0.75) objective. The Zeiss resolution was 0.16 um/pixel.
We calculated the Nikon resolution to be 0.264 um/pixel. Both cameras have 12-bit
color depth per channel. We register the images to ensure identical regions are used
for comparison. We use quantile normalization to equalize histograms between the
images and evaluate registration accuracy. We use standard deviation of intensity to
evaluate “contrast” and Tenenbaum gradient to evaluate “sharpness” (Sun 2004).
Materials and MethodsMaterials and Methods
As shown in Figure 1, the Zeiss microscope has a much larger concentration of pixel values
between 50,000 and 60,000, while the Nikon has more evenly distributed pixel values. Both
microscope objectives had the same magnification and numeric aperture, though the Zeiss
microscope had a noticeably smaller pixel size and thus higher resolution. The Zeiss
microscope has a filter turret that rotates between acquisition of red, green and blue with the
monochrome camera, which can cause problems at 40x magnification due to small mechanical
vibrations between each photo. The Zeiss microscope provides better control over all meta-
data during acquisition, which should contribute to greater repeatability and comparability
between studies. Illumination uniformity and optical aberration were not addressed in this
study.
Results and DiscussionResults and Discussion
Two pathologists viewed sample images from both microscopes and
determined that both were good enough for diagnosis. However, as
morphological image analysis and diagnostics move toward greater
computational assistance, control over quality parameters across
microscopes gains importance. Accurate sharing and inclusion of
experimental meta-data is needed for analysis algorithms to perform
consistently between labs. The work could be improved by more
analysis of quantitative metrics of image quality. We have acquired
the same slides using an Aperio ScanScope and in the future hope to
add that microscope to the quantitative comparison.
Conclusions and Future WorkConclusions and Future Work
AcknowledgementsAcknowledgements
Nikon Eclipse
E600
Model Year ~1997
Light
Source
12V 100W Halogen
Bulb (set to ~9V)
Light Path NCB11 color
balancing filter?
Camera Qimaging Retiga
1300 (with IR filter)
Auto-exposure (2003)
Objective 40x Plan-Fluar 0.75
NA Ph2 DLL
Pixel Size 0.264 um?
Bit Depth 12 bits/pixel
Zeiss AxioImager Z2 Model Year ~2010
Light
Source
12V 75W Halogen
Bulb (set to ~4.5V)
Filters SemRock band-pass
QD fluorescent cubes
Camera AxioCam MRm
(monochrome) (no IR
filter) fixed exposure,
different for each color
Objective 40x Zeiss EC-Plan
Neofluar (NA: 0.75)
Pixel Size 0.16 um/pixel
Bit Depth 12 bits/pixel
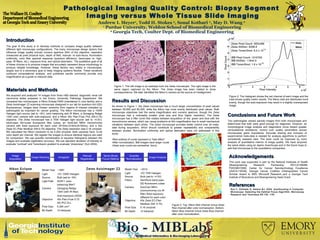
Figure 1: The left image is an example from the Zeiss microscope. The right image is the
same region captured by the Nikon. The Zeiss image has been rotated to show
correspondence. We later identified the Nikon’s camera as the source of misalignment.
ReferencesReferences
Sun Y, Duthaler S, Nelson BJ. 2004. Autofocusing in Computer
Microscopy: Selecting the Optimal Focus Algorithm. Microscopy
Research and Technique 65:139 –149
Image
Acquisition
Image Resizing
Manual
Registration
Spiral (Brute
Force) Method
Quantile
Normalization
Image Analysisimregister
This work was supported in part by the National Institutes of Health
(Bioengineering Research Partnership R01CA108468,
P20GM072069, Center for Cancer Nanotechnology Excellence
U54CA119338), Georgia Cancer Coalition (Distinguished Cancer
Scholar Award to MW) Microsoft Research,,and a Georgia Tech
Institute of Bioscience and Bioengineering Seed Grant.
Figure 2: The histogram shows the red channel of each image and the
inset shows quality metric results. The Nikon reds are distributed more
evenly, though the auto-exposure may result in a slightly overexposed
image.
•Red outlines of nuclei represent a “halo effect”
•After normalization, IBB images have larger nuclei
•Zeiss scan nuclei are somewhat blurry
Figure 3: Top, Nikon Red channel minus Zeiss
Red channel after color normalization. Bottom,
Nikon Blue channel minus Zeiss Blue channel
after color normalization.