China political economy
•
2 likes•295 views

geopolitics of china, political weight index, governmental weight index, budget, budget per capita, china political economy http://iilss.net/ http://maynter.com

Recommended
More Related Content
What's hot
What's hot (20)
Similar to China political economy
Similar to China political economy (20)
More from maysam araee daronkola
More from maysam araee daronkola (11)
Recently uploaded
Recently uploaded (20)
China political economy
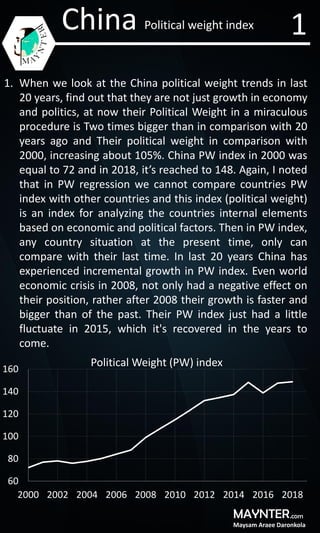
- 1. MAYNTER Maysam Araee Daronkola .com China Political weight index 1. When we look at the China political weight trends in last 20 years, find out that they are not just growth in economy and politics, at now their Political Weight in a miraculous procedure is Two times bigger than in comparison with 20 years ago and Their political weight in comparison with 2000, increasing about 105%. China PW index in 2000 was equal to 72 and in 2018, it’s reached to 148. Again, I noted that in PW regression we cannot compare countries PW index with other countries and this index (political weight) is an index for analyzing the countries internal elements based on economic and political factors. Then in PW index, any country situation at the present time, only can compare with their last time. In last 20 years China has experienced incremental growth in PW index. Even world economic crisis in 2008, not only had a negative effect on their position, rather after 2008 their growth is faster and bigger than of the past. Their PW index just had a little fluctuate in 2015, which it's recovered in the years to come. 1 60 80 100 120 140 160 2000 2002 2004 2006 2008 2010 2012 2014 2016 2018 Political Weight (PW) index
- 2. MAYNTER Maysam Araee Daronkola .com China Political weight index 2. China PW index body has a fantastic detail. Their GW rules and its share in PW body in last 20 years, especially after 2008, had an increased flow. China GW share in PW body in 2000 was 50% of the political weight body, and despite to the increase of population, it reached to 61% in 2018. The growth of governance ability, along with population growth, is not easy but China unlike to most of the Western countries, upgraded own ability. We anticipate that due to the China-USA economic war, current flow will be stop in next year's and most of china effective response to USA will be focus on the political and security issues. 2 40 45 50 55 60 65 2001 2003 2005 2007 2009 2011 2013 2015 2017 2019 shares of GW in PW
- 3. MAYNTER Maysam Araee Daronkola .com China Political weight index 3. From 2000 till 2018 China population has faced to at least 120 million increase. Along with this situation their LPC (Land Per Capita) decline continuously. Then, they needs in raw material increased and will be increase in comparison with last years. It should be noted that the Chinese people life standards in last 20 years, had been raise and with a steep slope will be rising in next years. They need to raw material for achieve to the sustainable development. By attention to their trends on the GW index (governmental weight) and PW index (political weight), their needs in raw material and money at the next 20 years is will be twice of the present time. Also they need to more export in goods and products and everyone know that they need to USA money, which shaped one sixth of China trade, is vital. It seems that the present conflict between USA and china lead to painful consequence for China, especially that China dependency to USA money is bigger than of USA dependency to Chinese goods and service. We anticipate, if china lose own Political weight in next year's, it is lead to Dealing with USA demands. 3 1,260,000,000 1,280,000,000 1,300,000,000 1,320,000,000 1,340,000,000 1,360,000,000 1,380,000,000 1,400,000,000 2000 2002 2004 2006 2008 2010 2012 2014 2016 2018 population
- 4. MAYNTER Maysam Araee Daronkola .com China Political weight index 4. The outcome of US-China challenge for China is: A. Downfall in GDP and national income and so contraction budget B. Counter action in economic sector C. Highlighting of authority from Chinese governance in confronting with Chinese people D. Population contraction and increase of immigration E. Leaving of investors F. Losing of job opportunities G. Define of military and security program by China for USA and USA allies in Asia H. Orientalism policies by China 4
- 5. MAYNTER Maysam Araee Daronkola .com ChinaGovernmental Weight index 5. The key factor of China political weight index growth relevant to their governmental weight (GW) growth, because the LPC (Land Per Capita) as another component of PW index, not only lead to this growth, rather its lead to control of PW index growth flow(because for population increase). China GW index in 2000 was equal to 10 of 100 but it's by a fantastic and incremental flow, rich to 22 of 100 in 2018. The trend of China GW index shown us they have 120% growth in GW index. By attention to this realities that still the structure of Chinese governance in comparison to West countries (Europe and USA) has a low level ability in soft power and welfare, but in comparison to the past position of china, they has a Fantastic growth. Some china GW component in last 20 years has been increased more than of 20 times. 5 0 5 10 15 20 25 2000 2002 2004 2006 2008 2010 2012 2014 2016 2018 Trend of Governmental Weight (GW) index 0 20 40 60 80 GW index in some countries in 2018
- 6. MAYNTER Maysam Araee Daronkola .com ChinaGovernmental Weight index 6. At now we can claim that the condition of welfare, corruption, authority and use of force, poverty, Social Justice and human development in china is better than of every last time. It’s obvious that economic development in a Chain procedure lead to human and political development. when the common forms of the authority for Society management is economy, it's lead to development in political society and in counter, when the hands of governments in economy is empty, then it's lead to use of more physical tools for policy. In following we can see power components situatuin in china. 6 -20 -10 0 10 20 30 40 50 60 70 80 2001 2006 2011 2016 The share of each component of Governmental Weight index B share CP share Δt share “B” for political-economy “CP” for Authority “∆t” For government legitimacy
- 7. MAYNTER Maysam Araee Daronkola .com ChinaGovernmental Weight index 7. The trend of B index in GW body of China, as one of the effective element in GW growth at China, is 5.4 of 100 in 2018. This index that shown us China situation in BPC (budget per capita) and GDP per capita with best amount of BPC in welfare state, had a very interactive growth in last 20 years. In 2000 the B index in China was less than of 1 (.64) of 100 and across in 18 years it was increase more than of 11 times. Also its rule in GW body increased about 2000%. The sharing of B index in GW body in 2018 is 20% and this is for china is unbelievable. Maybe it's the main reason of China rivals concerns. In 2000 the China BPC (Budget Per Capita) was $200 but at now it’s $2700 and this growth is 1250%. The BPL (Budget Per land) of China so had a very incremental flow. In 2000 it was equal to $10 per m^2 and in 2018 it’s reached to $400 per m^2, which it had more than of 9000% growth. This rate explain us how china build new china industry and fantastic infrastructure. A thing that important in China situation is that, the China growth processes balance in main part of society and most of the population is a part of development process. 8. Trend of CP or concentration of power, that represent of government authority in society management, had a decline flow in all the last 20 years in China. The most reason of the current situation was relevant to B index growth or economic growth in China. It’s obvious that at the present time china is very different in politics with china before 2000. It seems that by rising of economic war with USA, China will experiments a significant fallen in trade and economic, and so fallen in the B index, which it is lead to CP (concentration of power) in GW body. Then maybe it’s lead to China use of more force and physical tools in Society management in next years. 7
- 8. MAYNTER Maysam Araee Daronkola .com ChinaGovernmental Weight index 9. China ∆t or governance stability index by a 69 years old governance in china has challenge in some times at the last years, but the economic behavior of Chinese governance in last year's, is the axes of people confidence to the present government. Then any Economical Challenge, not only harming for china position in the world economy, even this has a political and internal consequences for China governors. it's true that they have a fantastic growth, but still they are fragile situation and they have significant distance with west powers standards and human development. Also, current age of Chinese people finding new condition in welfare and human welfare standards. They cannot come back to the history and hasn’t no way unless going to the Future. Our anticipation is that, maybe china playing flexible rule in China-USA economic War. The both of USA and china, which has an increasing population flow, will has a complicate playing in the future. Maybe this situation help the new Economic powers, (like as India, EU countries and Brazil, as an allies and rivals), for growth and development. 8
- 9. MAYNTER Maysam Araee Daronkola .com ChinaPolitical Economy 10.Incredible growth of China in Governmental Weight (GW) index rooted from the economy growth of china, and it's strictly effected on their budget size. China budget, in yuan, in last 20 years had increase 12 times in comparison with 2000 and from 1,240 billion yuan in 2000 reached to 19,943 billion yuan in 2018. China is a productive and industrial country that build must of infrastructure with internal potentials. Then the yuan budget growth lead to effective development in China. China budget trend shown us they have just one budget contraction in 2016, and in all the rest years, their budged had increased flow. China national budget at 2018, in comparison to 2000, had 1,100 percent growth. We must say they challenge the numbers conception and this is raised from where? 9 - 2,000,000,000,000 4,000,000,000,000 6,000,000,000,000 8,000,000,000,000 10,000,000,000,000 12,000,000,000,000 14,000,000,000,000 16,000,000,000,000 18,000,000,000,000 20,000,000,000,000 22,000,000,000,000 24,000,000,000,000 2000 2002 2004 2006 2008 2010 2012 2014 2016 2018 National budget in yuan
- 10. MAYNTER Maysam Araee Daronkola .com ChinaPolitical Economy 11.In dollar, China national budget in 2018 equal to 3670 billion dollar, that in comparison to 2000, which it was 500 billion dollar, had 660 present growth. By attention to the US dollar exchange rate in china and tension between in two currency in last year's, the China budget growth in dollar wasn't coordinated flow with yuan budget growth rate. It seems that China governance by controlled of decline flow in yuan price, hiding some disability on the economic sector (such as low-income and unbalance trade relations) but yet, the China case is fantastic and incredible. also I must pointed that in comparison with last 20 years china by strengthen of own national currency, along with increase of industrial sectors, playing as a effective economic player in world, which everyone know this not easy. 10 - 500,000,000,000 1,000,000,000,000 1,500,000,000,000 2,000,000,000,000 2,500,000,000,000 3,000,000,000,000 3,500,000,000,000 4,000,000,000,000 2000 2002 2004 2006 2008 2010 2012 2014 2016 2018 National budget in US dollar
- 11. MAYNTER Maysam Araee Daronkola .com ChinaPolitical Economy 12.China budget per capita (BPC) in last 20 years had an unbelievable growth which in 2018 via 1973% growth in comparison with 2000 (which it was $127), at the 2018 reached to $2633. In fact this is not a normal growth look like other countries, because this is a kind of economic revolution in political economy. The present growth sounds is that, at now the Chinese people getting more facilities in comparison with last 20 years ago and last generation. Then they have more welfare and they are reduce their distance with sustainable development. The present level of national budget lead to Chinese government grows own efficiency, and also the Chinese people economic efficiency reach to reasonable amount. At know the Chinese government efficiency is 3 times bigger than of 20 years ago. 11 0 1000 2000 3000 4000 5000 6000 7000 8000 9000 2000 2002 2004 2006 2008 2010 2012 2014 2016 2018 BPC or Budget Per Capita GDP per capita
- 12. MAYNTER Maysam Araee Daronkola .com ChinaPolitical Economy 13. The other important subject about the Chinese people economic efficiency is that their growth rate in GDP Is bigger than of most others country indicator in gross domestic product. Their GDP per capita in 2018 was equal to $8827, and it was $959 in 2000. Then we can see they have 820% growth in GDP per capita in last 20 years. Although, their growth rate in GDP is lower than of their growth rate in budget and budget per capita, but with a reasonable view, must be considered this type of growth is miracle. 14. The B index in China, that it shown us the budget per capita (BPC) amount distance in under review country, with best amount of BPC in the under review year, was in 2000 equal to 5.4 of 100. Of course this number in China isn't good index in comparison with welfare States, but when we see China growth in the B index at least in last 20 years, their 815% growth in B index proof that China move to forward fastly but by new USA orders in international community, maybe this flow will be stop. We anticipate in 2019 the B index flow, in the optimistic analysis will not grow, and in a pessimistic view, will be faced with 5-8% Fallen. 12 -1 2 5 8 11 14 17 20 2000 2002 2004 2006 2008 2010 2012 2014 2016 2018 B index or budget size index
- 13. MAYNTER Maysam Araee Daronkola .com ChinaPolitical Economy 15.The other amazing economic indicator in China that was increased in last 20 years, is their BPL or budget per land amount. China in 2000 pay $16.5 for each square meter and in 2018 they paid more than of $382 for each square meter, which it has 23 time bigger than in comparison with BPL amount in 2000. I think that the present situation of infrastructure in China is an amazing situation, but much of them a thing that lead to my confusing is that, how they could growth their populations along with all the economic factors? 13 0 20 40 60 80 100 120 140 160 180 200 220 240 260 280 300 320 340 360 380 400 420 2000 2002 2004 2006 2008 2010 2012 2014 2016 2018 BPL or budget per land in US dollar