India political economy
•
0 likes•458 views

India political economy, political weight index, governmental weight index, budget, budget per capita http://iilss.net/ http://maynter.com

Recommended
Recommended
More Related Content
What's hot
What's hot (19)
Similar to India political economy
Similar to India political economy (20)
More from maysam araee daronkola
More from maysam araee daronkola (11)
Recently uploaded
Recently uploaded (20)
India political economy
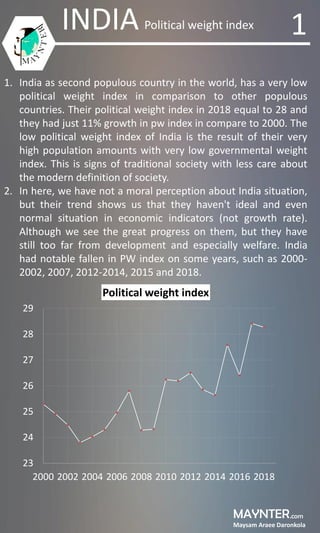
- 1. MAYNTER Maysam Araee Daronkola .com INDIA Political weight index 1. India as second populous country in the world, has a very low political weight index in comparison to other populous countries. Their political weight index in 2018 equal to 28 and they had just 11% growth in pw index in compare to 2000. The low political weight index of India is the result of their very high population amounts with very low governmental weight index. This is signs of traditional society with less care about the modern definition of society. 2. In here, we have not a moral perception about India situation, but their trend shows us that they haven't ideal and even normal situation in economic indicators (not growth rate). Although we see the great progress on them, but they have still too far from development and especially welfare. India had notable fallen in PW index on some years, such as 2000- 2002, 2007, 2012-2014, 2015 and 2018. 23 24 25 26 27 28 29 2000 2002 2004 2006 2008 2010 2012 2014 2016 2018 Political weight index 1
- 2. MAYNTER Maysam Araee Daronkola .com INDIA Political weight index 3. The India high population lead to high level importance of human geography against their territorial geography. So, this is lead to highlighting of Indians humanity issues in last decades. India population in 2018 was 1,358,000,000, which it had 305,000,000 increase in 18 years. This amounts is very higher than of many countries population. They have 28% growth in population size, but they never been had like this rate in other indexes, such as pw index. It seems that none of population policy had effective results. 2 1,000,000,000 1,050,000,000 1,100,000,000 1,150,000,000 1,200,000,000 1,250,000,000 1,300,000,000 1,350,000,000 1,400,000,000 2000 2002 2004 2006 2008 2010 2012 2014 2016 2018 population 0 1 2 3 4 2000 2002 2004 2006 2008 2010 2012 2014 2016 2018 LPC or Land Per Capita (in m2)
- 3. MAYNTER Maysam Araee Daronkola .com INDIA Political weight index 4. The share of governmental weight index in PW body was almost more than of 65% in last two decade in India and it reached to 73% in 2018. This share of GW in PW body proof, despite to their low PW index, the most reason of their existence is their government abilities. This is shown they have very weak geopolitics, but this means isn't that they haven't human resources. Whatever their human resources has a critical problems in skills and educations. Also their human resources need to draw materials and resources in one hand and the market for selling those products. 3 0 10 20 30 40 50 60 70 80 2001 2003 2005 2007 2009 2011 2013 2015 2017 2019 Share of GW (Governmental Weight) index in PW body (in percent)
- 4. MAYNTER Maysam Araee Daronkola .com INDIA Political weight index 5. The most reasons of low amount of political weight index and low growth of PW index rate in India was: A. Non contraction policy in population B. Economic challenges such as low skilled workers, rural economy, income inequalities, occupational shift, leaking of infrastructure, inflation, banking crisis C. High population with weak geopolitics and leak of resources D. Transparency in politics and economy, corruption, socio political despondency E. Poverty, unemployment, the growth of imports without enough growth in exports F. Confrontation with China and Pakistan in political and border issues. Also with Nepal and Bangladesh G. China control policy for restrain of India (like China- Pakistan economic corridor and political pressure) 6. At now Indian are too far from development and despite that they have high growth rates in economic issues, but it's not comparable with China and many of other states. As a fundamental policy, they need to population contraction and shifting to industrialization. Their human resources amounts is good, but if they have not enough skill, this lead to social and political tragedies. They need to more times of growth and absolutely this rate do not lead to development. By arranging their problems, we anticipate that they achieve to ideal growth. Some countries like India for development need to higher rates in growth, because they had many historical lags. 4
- 5. MAYNTER Maysam Araee Daronkola .com INDIA governmental weight index 1. As we said in political weight index analysis about India, the low size of governmental weight index in India is one of the main reason on their low political weight index amount. India governmental weight index in 2018 was equal to 12, which it had 50% grown in comparison to their index in 2000. Unlike to India political weight index fluctuate, their GW index swing summarized to 3 years, such as 2007, 2012 and 2015. Because the population growth effect in PW index are directly and its effect on GW aren't directly. It seems that in next years they will have low growth or maybe stability on GW index. 5 0 2 4 6 8 10 12 14 2000 2002 2004 2006 2008 2010 2012 2014 2016 2018 GW index or Governmental Weight index
- 6. MAYNTER Maysam Araee Daronkola .com INDIA governmental weight index 2. The main reason for GW slow progress in next years will raise of rupee worth Fallen against dollar and so increasing flow of population in India. By look at to Indian trend on government efficiency, this is obvious that they had grown nearly to 2 times on government efficiency in last 20 years. This means is that the rule of geopolitical realities had decrease flow in compare to their government abilities. We can't imagine that the management of India territory with more than of 1,300,000,000 people how much is hard and despite to this fact, Indian had growth in economic sectors. Here our key statement is that, Indian doesn't had enough growth, not they hadn't any growth in last years. Their trend in GW variables shows specific matters, which we describe about them in following. 6 0 1 2 3 4 5 6 2000 2002 2004 2006 2008 2010 2012 2014 2016 2018 Government efficiency against geopolitical realities
- 7. MAYNTER Maysam Araee Daronkola .com INDIA governmental weight index 3. Indian trend in GW variables shows specific matters, which we describe about them in following. 7 -30 -20 -10 0 10 20 30 40 50 60 70 80 2001 2003 2005 2007 2009 2011 2013 2015 2017 2019 Share of each components in GW index body B share CP share Δt share 4. The most parts of governmental weight index structure in India divided in 2 uneconomical variables, which those consist of Δt (or governance stability index) and CP (concentration of power). CP as represent of Indian government authority, shaped more than of 64%of Indian GW index body in 2018. This is sign a kind of policy with less amounts of economic factors. In fact India society managed via force a d authority. Also they have a traditional society with lot of ethnic groups and lot of problems in modern schools view, but this situation has some kind of reasons that modernism cannot understand it carefully. Whatever, for industrialization process and coming to modern or even postmodern world and competition with world economic powers, they cannot continue present standards. For this reason in last years the huge economic programs lead to decline flow of CP in India to favor of B index (as represent of economic tools in policy), which in 18 years their CP declined from 74% of GW body to 63% of it.
- 8. MAYNTER Maysam Araee Daronkola .com INDIA governmental weight index 5. The second variable that filled Indian GW index structure is their Δt or governance stability index. Their Δt index with 68 years old of governance in last years was almost around 40% of GW body. The present amount of Δt in India can make easy society management for government and shown us their population could define stable relation with present political system. The modernization and industrialization will can change their people thoughts about social and political issues and on that day, Indian government must make economic response for people needs. This is notable that Δt share in last years had declined flow. 6. In 2018, the share of B index as an economic tools for society management was -2%. Yes you don't see wrong number. It's -2% and this is for that reason Indian economic tools for society management wasn't even equal to 1% of base number, then this is lead to negative share of B index in GW index body. But when we saw their trend, this is obvious that they had growth flow. Because the B index (budget size index) share in 2000 was equal to -17% of GW body and after 18 years it was grown more than of 8 times and reached to -2% of GW body. At now they have long distance in economic sectors with other countries and for this reason they have many economic and welfare problems, which we said about them on PW index analysis. Whatever, the mean of development is not an absolute mean and we must care about it. This situation lead to that Indian government focusing national economic resources to some place and so on the some parts of population, which it is lead to huge gap among the peoples. 8
- 9. MAYNTER Maysam Araee Daronkola .com INDIA Budgetanalysis 1. Indian national budget in rupee in last 2 decades had incredible grown and it reached from 4000 billion rupee to 39000 billion rupee. They have 875% growth in their national budget amounts and their growth had very fast slope. But as we said, for recovery of their historical lag, they must working on this field so harder. Also it's notable that China in same time had 1100% growth in national budget, by attention to this realities that China is a productive country but India absolutely not like them. It seems that without strengthening of national capacity for industrial production, Indian national budget growth in rupee will not help them. 9 - 5,000,000,000,000 10,000,000,000,000 15,000,000,000,000 20,000,000,000,000 25,000,000,000,000 30,000,000,000,000 35,000,000,000,000 40,000,000,000,000 45,000,000,000,000 2000 2002 2004 2006 2008 2010 2012 2014 2016 2018 National Budget in rupee
- 10. MAYNTER Maysam Araee Daronkola .com INDIA Budgetanalysis 2. Trend of India national budget in dollar shows 544% growth in 2 last decades. Their budget from 90 billion dollar in 2000 reached to 580 billion dollar in 2018. This is fantastic growth, but need to more growth in next years. India for achieve to minimal standards of Asian BPC, at least need to 3000 billion dollar in national budget, which that is 6 times bigger than of current budget in dollar. It seems that by current growth rates and India situation in population, they will can achieve to this number in the next 20 year. Although we cannot don't attention to this realities that in the next 20 years, they will have many complicate problems in development in compare to present time. Also it's notable that they have notable fluctuate in the period of 2007-2009, which that is consequences of world economic crisis. 10 - 100,000,000,000 200,000,000,000 300,000,000,000 400,000,000,000 500,000,000,000 600,000,000,000 700,000,000,000 2000 2002 2004 2006 2008 2010 2012 2014 2016 2018 National budget in dollar
- 11. MAYNTER Maysam Araee Daronkola .com INDIA Budgetanalysis 3. Analysis of Indian BPC shows they had 434% growth on that and it was smaller than of budget size growth. Then, this is obvious that their budget growth absolutely wasn't matched with their population growth. In 2018, Indian BPC was equal to 422 dollar and it was 79 dollar in 2000. Also, the distance between BPC and GDP per capita, which we suppose that it was the sign of people efficiency in economy and shows the growth of population skills to us, had growth in India. It increased to 4.8 from 2.5 in 2 decades. 11 0 200 400 600 800 1000 1200 1400 1600 1800 2000 2200 2000 2002 2004 2006 2008 2010 2012 2014 2016 2018 BPC or budget per capita GDP per capita Trend of BPC and GDP per capita
- 12. MAYNTER Maysam Araee Daronkola .com INDIA Budgetanalysis 4. The main reason in less effective of B index in GW body of India, returns to small size of B index. As defined in political weight index and governmental weight index structures, B index shown us the distance between under review countries BPC with best amount of BPC. At now Indian B index is less than of 0.9. In fact their BPC never reached to 1% of base amount of BPC (that belong to Luxembourg BPC). Although their BPC in 2000 was 0.4, which via many fluctuate had 131% growth in last 2 decades. This amount for China in same time was 815%. The interesting fact in here is that in 20 years ago both of them almostly stayed in same point of B index. 12 0 0.1 0.2 0.3 0.4 0.5 0.6 0.7 0.8 0.9 1 2000 2002 2004 2006 2008 2010 2012 2014 2016 2018 B or budget size index (of 100)