1Introduction My name is Yinan Hong. I am your port.docx
AB_Fixed_Income_Insights_201510
1. 1
1Q 2015
2015
AB FIXED INCOME INSIGHTS
WILL THE GLOBAL INVESTMENT
LANDSCAPE REALIGN IN 2016?
+ Hayden Briscoe, Director—Asia Pacific Fixed Income
As we approach the end of the year, our research is leading us to the view that we’re also nearing
the end of an investment era, and the beginning of a new one. We expect this to be a global trend
which will be positive for China, but with potentially negative implications for risk assets.
There are signs, though only tentative, that the global
investment and policy landscape in fourth-quarter 2015 could
lead to a reversal of what, three years ago, were three key
market-shaping events.
Then, markets were in an expanding “balance sheet world”, in
which central banks were pumping more liquidity into the global
financial system to keep economies afloat.
In September 2012, the US Federal Reserve launched its third
round of quantitative easing (QE); in December that year,
Shinzo Abe became a second-time Prime Minister of Japan
and, two months later, launched his Abenomics reforms in an
attempt to boost the country’s growth and inflation.
The central banks hoped that, by helping to lift asset prices,
they would reignite the “animal spirits” in their economies. An
important consequence of these actions was that financial
markets—particularly risk assets—became dislocated from the
macro environment, as liquidity drove valuations higher than
economic fundamentals warranted.
Display 1 shows asset price cycles (expressed as the ratio of
household net worth to income) have become more dominant
in the business cycle during the last two decades or so, at
times of increased balance sheet leverage in various sectors.
The most recent spike, beginning in 2012, coincides with the
leveraging up of central-bank balance sheets.
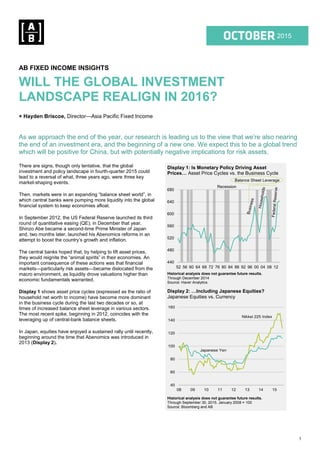
In Japan, equities have enjoyed a sustained rally until recently,
beginning around the time that Abenomics was introduced in
2013 (Display 2).
Display 1: Is Monetary Policy Driving Asset
Prices… Asset Price Cycles vs. the Business Cycle
Historical analysis does not guarantee future results.
Through December 2014
Source: Haver Analytics
Display 2: …Including Japanese Equities?
Japanese Equities vs. Currency
Historical analysis does not guarantee future results.
Through September 30, 2015. January 2008 = 100
Source: Bloomberg and AB
440
480
520
560
600
640
680
52 56 60 64 68 72 76 80 84 88 92 96 00 04 08 12
Balance Sheet Leverage
Recession
40
60
80
100
120
140
160
08 09 10 11 12 13 14 15
Japanese Yen
Nikkei 225 Index
2. AB FIXED INCOME INSIGHTS OCTOBER 2015
2
At the same time, there was a counter-current to these events.
In November 2012, Xi Jinping became President of China
and—as part of a suite of reforms aimed at rebalancing the
country’s economy—launched a crackdown on corruption.
As the US and Japan attempted to stimulate growth, Xi’s
actions had a dampening effect, leading to a slowdown in
infrastructure and other projects in China. This in turn
effectively put an end to the global commodities boom and
created economic headwinds for commodity-exporting
countries.
ALL CHANGE
In October 2015, each of these three policy initiatives appears
to be doing a U-turn. Having put an end to quantitative easing
a year ago, the Fed—though weighing an improved US
economy against global market volatility—is expected soon to
raise short-term interest rates for the first time in nine years.
The policy debate in Japan now revolves around whether or
not the Bank of Japan (BoJ) should ease further, with the BoJ
governor arguing against it on the grounds that the country is
through the worst of its deflationary spiral. If he’s right, we
believe Japan could signal a tapering in its QE program next
year. This is an out-of-consensus view as the market is still
looking for an extension or top-up of the programme.
We expect China’s 13th Five-Year Plan, to be announced after
the October Communist Party plenum, to focus on reforms that
will continue to push the economy up the value chain, making it
more efficient and innovative, with the aim of reducing the risk
of the country falling into the middle-income trap.
We’re encouraged in this view by Xi’s recent engagement with
the international community, including a state visit to the US in
September and, more recently, the UK, with bilateral trade
agreements high on his agenda. Premier Li Keqiang has been
similarly active across Europe.
China, in other words, still seems to be moving in the opposite
direction to that of the other countries in terms of policy—this
time, however, it’s more pro-growth, while the US and Japan
contemplate moving to tighter policy settings.
MACRO FACTORS BACK IN PLAY
Together, these trends point to a rebalancing in global markets
during 2016. With the US poised to raise interest rates, Japan
potentially tapering its QE and China experiencing a mild
cyclical upswing, macroeconomic factors are likely to reassert
themselves as key investment drivers, in our view.
For the riskiest assets which have been decoupled from
fundamentals, this can only mean a reversion of valuations to
more normal levels.
SILVER LINING IN CHINA’S CLOUDS
While it may be too soon to rely on these straws in the policy
wind as presaging a change in the global investment
landscape next year, we see some fundamental trends—
especially in China—which appear to support the case that
such a change may occur.
This may seem unlikely, given that headlines about China’s
economic growth continue to be overwhelmingly negative. The
fact that the decline in China’s heavy industry sector is hurting
western companies with significant exposure in that area is not
to be taken lightly.
In our view, however, the headlines tend to overlook or
underrate the key fact that the composition of China’s GDP
growth has changed, as shown by Display 3.
Display 3: China’s Economy Rebalances
GDP By Sector (Share)
Historical analysis does not guarantee future results.
As of October 15, 2015
Source: CEIC Data and AB
The contribution of the secondary sector or industry—
traditionally the main driver of growth—has declined as a share
of GDP, while the tertiary (services) sector has boomed, to the
point that it now accounts for 50% of GDP.
This is fully consistent with China’s goal of rebalancing its
economy in order to avoid the middle-income trap, and counts
as a major policy achievement. It’s good news for investors,
because it points to more sustainable, if lower, GDP growth
over the long term.
As Display 4, next page, suggests, year-on-year growth in
services is buoyant, while the industry sector remains in a
steep decline. That said, we detect some silver linings in the
clouds hanging over China’s non-services sector.
3. AB FIXED INCOME INSIGHTS OCTOBER 2015
3
Display 4: Services Sector Remains Buoyant
GDP By Sector (Growth)
Historical analysis does not guarantee future results.
As of October 15, 2015
Source: CEIC Data and AB
Display 5 shows how growth in the infrastructure and housing
sectors peaked during the commodity boom and how they
have fared since President Xi came to power in 2012.
Infrastructure has stabilised, while housing and manufacturing
have continued to decline.
Display 5: Infrastructure Investment Stays Stable
Investment By Sector (Growth)
Historical analysis does not guarantee future results.
As of October 15, 2015
Source: CEIC Data and AB
While we don’t see any turnaround in manufacturing in the
short- to medium-term, we are more positive on infrastructure
and housing. In the case of infrastructure, we expect the new
Five-Year Plan at the very least to maintain investment at
current levels and, possibly, to increase it.
There is any case a great deal of liquidity waiting to be
invested in infrastructure—a result of the exponential growth in
the municipal bond market, created earlier this year after the
central government forced local and provincial governments to
reduce their reliance on bank finance.
Current outstandings are RMB3.7 trillion (US$580 billion).
In housing, we see the possibility of a cyclical upswing,
possibly by the middle of next year. Display 6 indicates that
supply (as represented by Floor Space Started) and demand
(Floor Space Sold) are now in balance, and that excess supply
is diminishing steadily.
Display 6: Housing Fundamentals Firm Up
Investment Of Residential housing (Level)
Historical analysis does not guarantee future results.
As of October 15, 2015
Source: CEIC Data and AB
Our research shows that house prices in Tier 1 and Tier 2
cities have begun to rise, and that the trend is spilling over into
Tier 3 cities.
If these trends continue into next year, we expect them to
trigger a revival in property development. This will surprise the
market, which has interpreted the downturn in the sector as the
bursting of a bubble, rather than a cyclical change.
A revival in property development would also be supportive for
the broader economy, in our view, and positive for the global
commodities market—although we’re not suggesting that
demand for commodities will return to anything like pre-2012
levels in the foreseeable future.