Italyaa
•Download as PPTX, PDF•
0 likes•156 views

1. Italy's political weight index was 202 in 2018, which is the result of the government's ability and geopolitical realities. It has fallen 5% since 2001. 2. Population contraction since 2014 has led to growth in Italy's political weight index, as the stability of land per capita has allowed the government to focus on development. 3. Italy's governmental weight index has remained stable around 40 out of 100 for the past 20 years, and is the main factor influencing fluctuations in political weight. Budget size has decreased slightly but remained near normal levels.

Recommended
Recommended
More Related Content
Similar to Italyaa
Similar to Italyaa (20)
More from maysam araee daronkola
More from maysam araee daronkola (8)
Recently uploaded
Recently uploaded (8)
Italyaa
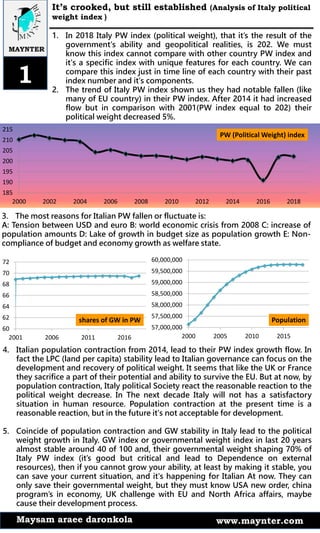
- 1. 185 190 195 200 205 210 215 2000 2002 2004 2006 2008 2010 2012 2014 2016 2018 57,000,000 57,500,000 58,000,000 58,500,000 59,000,000 59,500,000 60,000,000 2000 2005 2010 2015 60 62 64 66 68 70 72 2001 2006 2011 2016 It’s crooked, but still established )Analysis of Italy political weight index ( 1. In 2018 Italy PW index (political weight), that it’s the result of the government's ability and geopolitical realities, is 202. We must know this index cannot compare with other country PW index and it's a specific index with unique features for each country. We can compare this index just in time line of each country with their past index number and it's components. 2. The trend of Italy PW index shown us they had notable fallen (like many of EU country) in their PW index. After 2014 it had increased flow but in comparison with 2001(PW index equal to 202) their political weight decreased 5%. MAYNTER www.maynter.comMaysam araee daronkola 1 3. The most reasons for Italian PW fallen or fluctuate is: A: Tension between USD and euro B: world economic crisis from 2008 C: increase of population amounts D: Lake of growth in budget size as population growth E: Non- compliance of budget and economy growth as welfare state. 4. Italian population contraction from 2014, lead to their PW index growth flow. In fact the LPC (land per capita) stability lead to Italian governance can focus on the development and recovery of political weight. It seems that like the UK or France they sacrifice a part of their potential and ability to survive the EU. But at now, by population contraction, Italy political Society react the reasonable reaction to the political weight decrease. In The next decade Italy will not has a satisfactory situation in human resource. Population contraction at the present time is a reasonable reaction, but in the future it's not acceptable for development. 5. Coincide of population contraction and GW stability in Italy lead to the political weight growth in Italy. GW index or governmental weight index in last 20 years almost stable around 40 of 100 and, their governmental weight shaping 70% of Italy PW index (it’s good but critical and lead to Dependence on external resources), then if you cannot grow your ability, at least by making it stable, you can save your current situation, and it's happening for Italian At now. They can only save their governmental weight, but they must know USA new order, china program’s in economy, UK challenge with EU and North Africa affairs, maybe cause their development process. PW (Political Weight) index shares of GW in PW Population
- 2. 37.5 38 38.5 39 39.5 40 40.5 41 2000 2002 2004 2006 2008 2010 2012 2014 2016 2018 Italian authorities must move) Analysis of Italy governmental weight index ( 1. GW index regression designed in a specific form, which based on that, analysis of each country development and their progress doing by internal and external variant, not only current internal position in compare with past position. There to, Italian GW index is the product of their politics, economy and political-economy. at the present time. The Italy GW index equal to 40 of 100 and in all the 20 last years it has very low fluctuated around this number. Then, we can say Italy GW index or governmental ability is stable and main factor of Italy political weight index (PW index) fluctuate depends to their geopolitical realities. it's true that they have not progress, but they are really good in stability. MAYNTER www.maynter.comMaysam araee daronkola 2 2. Italy present political system Δt (which founded from 1958), shaped 27% of Italy governmental weight or GW index body. This means that they have a little amount of legitimacy in the political Society, and their governance like as France or Germany, that restarting in past WWII, must spend much money and use much matters or force, instead of mental elements, for Society management. The Italy Δt in 2018 equal to 19/45 (with 72 years old governance) that in comparison with UK (with 84 of 100) it's not good, but in comparison with Russia and other new founded states or governance, it's good index. The small amount of Δt, sign of low confidence from political society to governance (historically) and lack of mental elements of power. So, any country with low Δt must use of more physical elements of power, like as economy and Force, for society management. 3. The B index that represent of economical elements of power in GW index body, equal to 33 of 100 in Italy, and its share in GW body is 32%. In fact it's near to normal amount of B shares in GW body but in all the last 2 decade, it had decreased flow. although its fallen is not a big amount and it had only 2% decline. Present trend of B index in Italy shown us they are in a gentle slope, go away from welfare. 4. CP or concentration of Power share in Italy GW body is almost around of 41%. we can see this number in France and Germany, that all of them has a familiar policy in governance with Italy and their governance restarting after World War II, the size of CP show us the huge part of power in Italy shaped of authority or force, that represented by government and judicial system. As regards Italy B index (budget size index) near to the normal size, then only their stability and durability of present governance can decrease CP, and it's happening with shifting of authority by mental elements of power or Δt in GW body. Also, we must know that the growth of B value and clean hands of political system can help to Δt growth. GW (Governmental Weight) index 20 25 30 35 40 45 2001 2003 2005 2007 2009 2011 2013 2015 2017 2019 Share of B or budget size Share of Δt or Governance stability Share of CP or concentration of power
- 3. Trend of budget, budget per capita and budget size index (B index) in Italy 1. Italy national budget like as most of EU zone state can describe and analyzing in Euro and dollar. In 2018 Italy budget in Euro is 800 billion euro and by looking to its trend in last 20 years, it was obviously always ascended, such a way that, it had increase 43% in comparison with 2000. We must know in UK, France and Germany this rate was bigger than of Italy in the same time. MAYNTER www.maynter.comMaysam araee daronkola 3 3. Italy BPC or budget per capita in 2018 equal to $16100. it was $18200 in 2008 and $8800 in 2000. then it's obvious that, Italy BPC in comparison with 20 years ago increased something close to 100%, but in comparison to 2008, it had 13% downfall. The Italy growing flow in national budget and population contraction, to a great extent, will be lead to BPC growing flow in 2019 and other next year's. Italy BPC, encounter of UK is bigger and encounter of France, Germany and welfare state is smaller. 2. But in dollar, Italian national budget has big fluctuated in some years. Although, Italy budget growth in 2018, in comparison with 2000, is 96% but in comparison with 2008 (beginning of world economic crisis) it had 10% downfall. In 2018, Italy budget in dollar equal to 980 billion dollar and in 2008 they have 1080 billion dollar. Italy most downfall happened in during of 2008-2010 (even they have contraction budget in euro at the same time) and in 2012 & 2015. The downfall of the dollar budget in 2015 fully depends to euro and dollar tension, but in last 4 years it had increased flow. It seems that by attention to the China and us economic War, Eurozone and euro currency has enough opportunity for will be strengthen. Then, by euro strengthening against dollar we anticipate Italian budget in dollar will has increasing flow in next year. 400,000,000,000 600,000,000,000 800,000,000,000 1,000,000,000,000 1,200,000,000,000 2000 2002 2004 2006 2008 2010 2012 2014 2016 2018 4. Although, the Italian national budget (in Euro and dollar) and their BPC, at least in last 3 years, had a rising flow, but they B index or budget size index in last 20 years had a decline flow, such that it has 24% downfall at 2018 in comparison to 2000. In fact, in addition to increase of budget amount, we must pay attention to population size for BPC management and welfare state BPC growth and its rate. Because the B index shown your distance from best BPC in welfare state. This index in Germany in last 20 years had increased flow and in UK too. But in France, like as Italy it had decreased flow. 25 30 35 40 45 2000 2002 2004 2006 2008 2010 2012 2014 2016 2018 0 10000 20000 30000 40000 2000 2002 2004 2006 2008 2010 2012 2014 2016 2018 Budget in euroBudget in dollar BPCGDP per capita B or budget size index