Binomial distribution
•Download as PPTX, PDF•
2 likes•1,056 views

Explanation of a binomial probability distribution

Recommended
More Related Content
What's hot
What's hot (20)
Similar to Binomial distribution
Similar to Binomial distribution (20)
More from Robert Tinaro
Recently uploaded
Recently uploaded (20)
Binomial distribution
- 2. Definition A table of all the possible numbers of successes for n number of trials paired with the probability of that number of success.
- 4. StudyTip The sum of the probabilities must equal 1
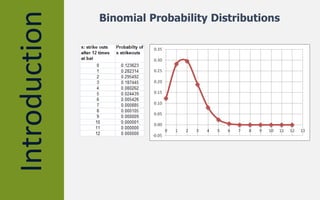
- 5. Graph The number of successes is the independent variable, and graphed on the horizontal axis The probability is the dependent variable, and graphed on the vertical axis
- 6. Graph The graphs always make this “bell” like shape
- 7. Formula Mean of the distribution: = np Variance of the distribution: 2 = npq Standard deviation of the distribution: = npq
- 8. Example Notice that the mean lies within the most likely outcomes. It is the expected value Notice that the mean lies at the peak of the graph
- 9. Example The standard deviation tells us what is normal. Any event more than 2 standard deviations from the mean is considered highly unlikely. 2 standard deviations from the mean covers the bell part of the graph
- 10. ProblemSolving Use the distribution table to answer questions like: What is the probability of exactly 3 successes? What is the probability of at least 3 successes? What is the probability of more than 3 successes? What is the probability 1 to 4 successes inclusive?
- 11. Example What is the probability of exactly 3 successes? The answer is the probability associated with x = 3 P(x =3) = .298571
- 12. Example What is the probability of at least 3 successes? The answer is the sum of the probabilities for x=3 to x=12 P(x 3) = .298571
- 13. Example What is the probability of more than 3 successes? The answer is the sum of the probabilities for x=4 to x=12 P(x > 3) = .111126
- 14. Example What is the probability 1 to 4 successes inclusive? The answer is the sum of the probabilities from x=1 to x=4 P(1 x 4) = .845512