Download to read offline

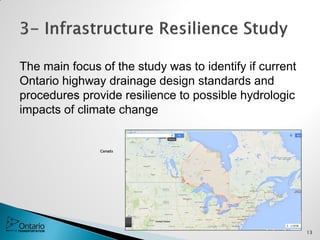


The document outlines a climate data training session aimed at municipal and conservation authority engineers regarding the impacts of climate change on drainage infrastructure in Ontario. It covers findings from various studies, new design tools, and the resilience of current drainage design standards amidst increasing rainfall and climate variability. The Ontario Ministry of Transportation has been researching these issues since 2005 and continues to develop adaptive measures to enhance infrastructure resilience.


![TERM_PROJECT_2[1].pptx siijsijdiwihduheuheb](https://cdn.slidesharecdn.com/ss_thumbnails/termproject21-250402161215-672ecd55-thumbnail.jpg?width=640&height=640&fit=bounds)


