FASTQC Analysis of FASTQ Files Before and After Trimming
1. Computational Biology and Genomics Facility, Indian Veterinary Research Institute
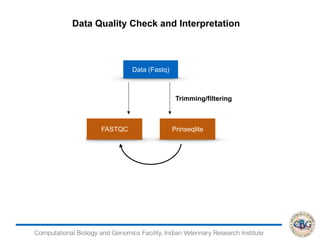
Data (Fastq)
FASTQC Prinseqlite
Trimming/filtering
Data Quality Check and Interpretation
2. Computational Biology and Genomics Facility, Indian Veterinary Research Institute
perl prinseq-lite.pl -fastq control.fastq -out_format 5 -min_len 50 -min_qual_mean 25
Input fastq file
1 (FASTA only), 2 (FASTA and QUAL), 3 (FASTQ), 4 (FASTQ and
FASTA), or 5 (FASTQ, FASTA and QUAL)
Output format Filter sequences shorter
than minimum length
(here it is 50 nucleotides)
Filter sequence with
quality score mean below
minimum quality mean
(here it is 25)
PRINSEQ -
• generates summary statistics of sequence and quality data
• used to filter, reformat and trim next-generation sequence data.
• PRINSEQ is available through a user-friendly web interface or as
standalone version.
Command for quality filtering :
perl prinseq-lite.pl -fastq control.fastq -out_format 5 -min_len 50 -
min_qual_mean 25
For any further help type :- perl prinseq-lite.pl -h
6. Computational Biology and Genomics Facility, Indian Veterinary Research Institute
The output generated from analyzing three files viz. original
fastq i.e control_R1.fastq, and the good and bad fastq files
generated from prinseq-lite
7. Computational Biology and Genomics Facility, Indian Veterinary Research Institute
Basic Statistics:
Interpretation : The Basic Statistics module generates
simple composition statistics for the file analyzed. It
gives the filename, file type, Sequences, sequence
length and GC % .
Here all the three files controlR1.fastq, control_R1
good.fastq and control_R1bad.fastq were analyzed. The
raw data file showed > 17 million reads and the good file
generated after running prinseq-lite showed > 16 million
reads. The bad file showed only 0.4 million reads.
Note :- Basic Statistics never raises a warning and never
raises an error.
Control_R1.fastq Control_R1_good.fastq
Control_R1_bad.fastq
8. Computational Biology and Genomics Facility, Indian Veterinary Research Institute
Interpre
simple
Control_R1.fastq
9. Computational Biology and Genomics Facility, Indian Veterinary Research Institute
Basic Statistics:
Interpretation : The Basic Statistics module generates
simple composition statistics for the file analyzed. It
gives the filename, file type, Sequences, sequence
length and GC % .
Here all the three files controlR1.fastq, control_R1
good.fastq and control_R1bad.fastq were analyzed. The
raw data file showed > 17 million reads and the good file
generated after running prinseq-lite showed > 16 million
reads. The bad file showed only 0.4 million reads.
Note :- Basic Statistics never raises a warning and never
raises an error.
Control_R1.fastq Control_R1_good.fastq
Control_R1_bad.fastq
Interpretation : The Basic Statistics module generates
simple composition statistics for the file analyzed. It
gives the filename, file type, Sequences, sequence
length and GC % .
Here all the three files controlR1.fastq, control_R1
good.fastq and control_R1bad.fastq were analyzed. The
raw data file showed > 17 million reads and the good file
generated after running prinseq-lite showed > 16 million
reads. The bad file showed only 0.4 million reads.
Note :- Basic Statistics never raises a warning and never
raises an error.
Control_R1.fastq Control_R1_good.fastq
Control_R1_bad.fastq
10. Computational Biology and Genomics Facility, Indian Veterinary Research Institute
Interpretation : The Basic Statistics module generates
simple composition statistics for the file analyzed. It
gives the filename, file type, Sequences, sequence
Control_R1_good.fastq
11. Computational Biology and Genomics Facility, Indian Veterinary Research Institute
Basic Statistics:
Interpretation : The Basic Statistics module generates
simple composition statistics for the file analyzed. It
gives the filename, file type, Sequences, sequence
length and GC % .
Here all the three files controlR1.fastq, control_R1
good.fastq and control_R1bad.fastq were analyzed. The
raw data file showed > 17 million reads and the good file
generated after running prinseq-lite showed > 16 million
reads. The bad file showed only 0.4 million reads.
Note :- Basic Statistics never raises a warning and never
raises an error.
Control_R1.fastq Control_R1_good.fastq
Control_R1_bad.fastq
Interpretation : The Basic Statistics module generates
simple composition statistics for the file analyzed. It
gives the filename, file type, Sequences, sequence
length and GC % .
Here all the three files controlR1.fastq, control_R1
good.fastq and control_R1bad.fastq were analyzed. The
raw data file showed > 17 million reads and the good file
generated after running prinseq-lite showed > 16 million
reads. The bad file showed only 0.4 million reads.
Note :- Basic Statistics never raises a warning and never
raises an error.
Control_R1.fastq Control_R1_good.fastq
Control_R1_bad.fastq
Interpretation : The Basic Statistics module generates
simple composition statistics for the file analyzed. It
gives the filename, file type, Sequences, sequence
length and GC % .
Here all the three files controlR1.fastq, control_R1
good.fastq and control_R1bad.fastq were analyzed. The
raw data file showed > 17 million reads and the good file
generated after running prinseq-lite showed > 16 million
reads. The bad file showed only 0.4 million reads.
Note :- Basic Statistics never raises a warning and never
raises an error.
Control_R1.fastq Control_R1_good.fastq
Control_R1_bad.fastq
12. Computational Biology and Genomics Facility, Indian Veterinary Research Institute
Interpret
simple c
gives th
length an
Here all
good.fas
raw data
generate
reads. Th
Note :- B
raises an
Control_R1_bad.fastq
13. Computational Biology and Genomics Facility, Indian Veterinary Research Institute
Basic Statistics:
Interpretation : The Basic Statistics module generates
simple composition statistics for the file analyzed. It
gives the filename, file type, Sequences, sequence
length and GC % .
Here all the three files controlR1.fastq, control_R1
good.fastq and control_R1bad.fastq were analyzed. The
raw data file showed > 17 million reads and the good file
generated after running prinseq-lite showed > 16 million
reads. The bad file showed only 0.4 million reads.
Note :- Basic Statistics never raises a warning and never
raises an error.
Control_R1.fastq Control_R1_good.fastq
Control_R1_bad.fastq
Interpretation : The Basic Statistics module generates
simple composition statistics for the file analyzed. It
gives the filename, file type, Sequences, sequence
length and GC % .
Here all the three files controlR1.fastq, control_R1
good.fastq and control_R1bad.fastq were analyzed. The
raw data file showed > 17 million reads and the good file
generated after running prinseq-lite showed > 16 million
reads. The bad file showed only 0.4 million reads.
Note :- Basic Statistics never raises a warning and never
raises an error.
Control_R1.fastq Control_R1_good.fastq
Control_R1_bad.fastq
Interpretation : The Basic Statistics module generates
simple composition statistics for the file analyzed. It
gives the filename, file type, Sequences, sequence
length and GC % .
Here all the three files controlR1.fastq, control_R1
good.fastq and control_R1bad.fastq were analyzed. The
raw data file showed > 17 million reads and the good file
generated after running prinseq-lite showed > 16 million
reads. The bad file showed only 0.4 million reads.
Note :- Basic Statistics never raises a warning and never
raises an error.
Control_R1.fastq Control_R1_good.fastq
Control_R1_bad.fastq
14. Computational Biology and Genomics Facility, Indian Veterinary Research Institute
Interpretation : The Basic Statistics module generates
simple composition statistics for the file analyzed. It
gives the filename, file type, Sequences, sequence
length and GC % .
Here all the three files controlR1.fastq, control_R1
good.fastq and control_R1bad.fastq were analyzed. The
raw data file showed > 17 million reads and the good file
generated after running prinseq-lite showed > 16 million
reads. The bad file showed only 0.4 million reads.
Note :- Basic Statistics never raises a warning and never
raises an error.
15. Computational Biology and Genomics Facility, Indian Veterinary Research Institute
Interpretation : The Basic Statistics module generates
simple composition statistics for the file analyzed. It
gives the filename, file type, Sequences, sequence
length and GC % .
Here all the three files controlR1.fastq, control_R1
good.fastq and control_R1bad.fastq were analyzed. The
raw data file showed > 17 million reads and the good file
generated after running prinseq-lite showed > 16 million
reads. The bad file showed only 0.4 million reads.
Note :- Basic Statistics never raises a warning and never
raises an error.
Control_R1.fastq Control_R1_good.fastq
Control_R1_bad.fastq
Interpretation : The Basic Statistics module genera
simple composition statistics for the file analyzed
gives the filename, file type, Sequences, sequen
length and GC % .
Here all the three files controlR1.fastq, control_
good.fastq and control_R1bad.fastq were analyzed. T
raw data file showed > 17 million reads and the good
generated after running prinseq-lite showed > 16 mill
reads. The bad file showed only 0.4 million reads.
Note :- Basic Statistics never raises a warning and ne
raises an error.
Control_R1.fastq Control_R1_good.fa
Control_R1_bad.fastq
16. Computational Biology and Genomics Facility, Indian Veterinary Research Institute
Interpretation: This view shows an overview of the range of quality
values across all bases at each position in the FastQ file.
For each position a BoxWhisker type plot is drawn. The central line (red
in colour) is the median value.
The box (yellow in colour) represents the inter-quartile
range (25-75%). The upper and lower whiskers represent the 10% and
90% points. The line (blue in colour) that runs across the graphs
represents the mean quality.
It can be appreciated that output of good files looks to have the best
means quality in comparison to raw data file. The bad file had a very
low mean quality thereby, a failure was issued as indicated by a cross
mark (red in colour) against per base sequence quality in the main
window of that data set.
Note : A warning will be issued if the lower quartile for any base is less
than 10, or if the median for any base is less than 25. A failure was
raised if the lower quartile for any base is less than 5 or if the median
for any base is less than 20.
Control_R1.fastq Control_R1_good.fastq
Control_R1_bad.fastq
Per Base Sequence Quality
18. Computational Biology and Genomics Facility, Indian Veterinary Research Institute
Interpretation: This view shows an overview of the range of quality
values across all bases at each position in the FastQ file.
For each position a BoxWhisker type plot is drawn. The central line (red
in colour) is the median value.
The box (yellow in colour) represents the inter-quartile
range (25-75%). The upper and lower whiskers represent the 10% and
90% points. The line (blue in colour) that runs across the graphs
represents the mean quality.
It can be appreciated that output of good files looks to have the best
means quality in comparison to raw data file. The bad file had a very
low mean quality thereby, a failure was issued as indicated by a cross
mark (red in colour) against per base sequence quality in the main
window of that data set.
Note : A warning will be issued if the lower quartile for any base is less
than 10, or if the median for any base is less than 25. A failure was
raised if the lower quartile for any base is less than 5 or if the median
for any base is less than 20.
Control_R1.fastq Control_R1_good.fastq
Control_R1_bad.fastq
Per Base Sequence Quality
19. Computational Biology and Genomics Facility, Indian Veterinary Research InstituteInterpretation: This view shows an overview of the range of quality
Control_R1_good.fastq
20. Computational Biology and Genomics Facility, Indian Veterinary Research Institute
Interpretation: This view shows an overview of the range of quality
values across all bases at each position in the FastQ file.
For each position a BoxWhisker type plot is drawn. The central line (red
in colour) is the median value.
The box (yellow in colour) represents the inter-quartile
range (25-75%). The upper and lower whiskers represent the 10% and
90% points. The line (blue in colour) that runs across the graphs
represents the mean quality.
It can be appreciated that output of good files looks to have the best
means quality in comparison to raw data file. The bad file had a very
low mean quality thereby, a failure was issued as indicated by a cross
mark (red in colour) against per base sequence quality in the main
window of that data set.
Note : A warning will be issued if the lower quartile for any base is less
than 10, or if the median for any base is less than 25. A failure was
raised if the lower quartile for any base is less than 5 or if the median
for any base is less than 20.
Control_R1.fastq Control_R1_good.fastq
Control_R1_bad.fastq
Per Base Sequence Quality
21. Computational Biology and Genomics Facility, Indian Veterinary Research Institute
Interp
values
For ea
in colo
The bo
range
90% p
represe
It can
means
low me
mark (
window
Note :
than 1
raised
for any
Control_R1_bad.fastq
22. Computational Biology and Genomics Facility, Indian Veterinary Research Institute
Interpretation: This view shows an overview of the range of quality
values across all bases at each position in the FastQ file.
For each position a BoxWhisker type plot is drawn. The central line (red
in colour) is the median value.
The box (yellow in colour) represents the inter-quartile
range (25-75%). The upper and lower whiskers represent the 10% and
90% points. The line (blue in colour) that runs across the graphs
represents the mean quality.
It can be appreciated that output of good files looks to have the best
means quality in comparison to raw data file. The bad file had a very
low mean quality thereby, a failure was issued as indicated by a cross
mark (red in colour) against per base sequence quality in the main
window of that data set.
Note : A warning will be issued if the lower quartile for any base is less
than 10, or if the median for any base is less than 25. A failure was
raised if the lower quartile for any base is less than 5 or if the median
for any base is less than 20.
Control_R1.fastq Control_R1_good.fastq
Control_R1_bad.fastq
Per Base Sequence Quality
23. Computational Biology and Genomics Facility, Indian Veterinary Research Institute
Interpretation: This view shows an overview of the range of quality
values across all bases at each position in the FastQ file.
For each position a BoxWhisker type plot is drawn. The central line (red
in colour) is the median value.
The box (yellow in colour) represents the inter-quartile
range (25-75%). The upper and lower whiskers represent the 10% and
90% points. The line (blue in colour) that runs across the graphs
represents the mean quality.
It can be appreciated that output of good files looks to have the best
means quality in comparison to raw data file. The bad file had a very
low mean quality thereby, a failure was issued as indicated by a cross
mark (red in colour) against per base sequence quality in the main
window of that data set.
Note : A warning will be issued if the lower quartile for any base is less
than 10, or if the median for any base is less than 25. A failure was
raised if the lower quartile for any base is less than 5 or if the median
for any base is less than 20.
24. Computational Biology and Genomics Facility, Indian Veterinary Research Institute
Interpretation : The Basic Statistics module generates
simple composition statistics for the file analyzed. It
gives the filename, file type, Sequences, sequence
length and GC % .
Here all the three files controlR1.fastq, control_R1
good.fastq and control_R1bad.fastq were analyzed. The
raw data file showed > 17 million reads and the good file
generated after running prinseq-lite showed > 16 million
reads. The bad file showed only 0.4 million reads.
Note :- Basic Statistics never raises a warning and never
raises an error.
Control_R1.fastq Control_R1_good.fastq
Control_R1_bad.fastq
Interpretation : The Basic Statistics module genera
simple composition statistics for the file analyzed
gives the filename, file type, Sequences, sequen
length and GC % .
Here all the three files controlR1.fastq, control_
good.fastq and control_R1bad.fastq were analyzed. T
raw data file showed > 17 million reads and the good
generated after running prinseq-lite showed > 16 mill
reads. The bad file showed only 0.4 million reads.
Note :- Basic Statistics never raises a warning and ne
raises an error.
Control_R1.fastq Control_R1_good.fa
Control_R1_bad.fastq
25. Computational Biology and Genomics Facility, Indian Veterinary Research Institute
Interpretation: The per sequence quality score report allows us to see if a
subset of your sequences have universally low quality values. The area
under the bell shaped curve was greater for the good file than the raw data
file indicating that most of the sequences had very good quality in the good
file in comparison to the raw data file.Average quality per read is also
better in the good file. In the bad file most of the sequences in the bad had
very poor quality. A failure was also issued as indicated by a cross mark
(red in colour) against per sequence quality score in the main window of
that data set.
Note : A warning is raised if the most frequently observed mean quality is
below 27 - this equates to a 0.2% error rate. A failure error is raised if the
most frequently observed mean quality is below 20 - this equates to a 1%
error rate.
Control_R1.fastq Control_R1_good.fastq
Control_R1_bad.fastq
Per Sequence Quality Scores
Interpretation: The per sequence quality score report allows us to see if a
subset of your sequences have universally low quality values. The area
under the bell shaped curve was greater for the good file than the raw data
file indicating that most of the sequences had very good quality in the good
file in comparison to the raw data file.Average quality per read is also
better in the good file. In the bad file most of the sequences in the bad had
very poor quality. A failure was also issued as indicated by a cross mark
(red in colour) against per sequence quality score in the main window of
that data set.
Note : A warning is raised if the most frequently observed mean quality is
below 27 - this equates to a 0.2% error rate. A failure error is raised if the
most frequently observed mean quality is below 20 - this equates to a 1%
error rate.
Control_R1.fastq Control_R1_good.fastq
Control_R1_bad.fastq
26. Computational Biology and Genomics Facility, Indian Veterinary Research Institute
Control_R1.fastq C
27. Computational Biology and Genomics Facility, Indian Veterinary Research Institute
Interpretation: The per sequence quality score report allows us to see if a
subset of your sequences have universally low quality values. The area
under the bell shaped curve was greater for the good file than the raw data
file indicating that most of the sequences had very good quality in the good
file in comparison to the raw data file.Average quality per read is also
better in the good file. In the bad file most of the sequences in the bad had
very poor quality. A failure was also issued as indicated by a cross mark
(red in colour) against per sequence quality score in the main window of
that data set.
Note : A warning is raised if the most frequently observed mean quality is
below 27 - this equates to a 0.2% error rate. A failure error is raised if the
most frequently observed mean quality is below 20 - this equates to a 1%
error rate.
Control_R1.fastq Control_R1_good.fastq
Control_R1_bad.fastq
Per Sequence Quality Scores
Interpretation: The per sequence quality score report allows us to see if a
subset of your sequences have universally low quality values. The area
under the bell shaped curve was greater for the good file than the raw data
file indicating that most of the sequences had very good quality in the good
file in comparison to the raw data file.Average quality per read is also
better in the good file. In the bad file most of the sequences in the bad had
very poor quality. A failure was also issued as indicated by a cross mark
(red in colour) against per sequence quality score in the main window of
that data set.
Note : A warning is raised if the most frequently observed mean quality is
below 27 - this equates to a 0.2% error rate. A failure error is raised if the
most frequently observed mean quality is below 20 - this equates to a 1%
error rate.
Control_R1.fastq Control_R1_good.fastq
Control_R1_bad.fastq
28. Computational Biology and Genomics Facility, Indian Veterinary Research Institute
Control_R1_good.fastq
29. Computational Biology and Genomics Facility, Indian Veterinary Research Institute
Interpretation: The per sequence quality score report allows us to see if a
subset of your sequences have universally low quality values. The area
under the bell shaped curve was greater for the good file than the raw data
file indicating that most of the sequences had very good quality in the good
file in comparison to the raw data file.Average quality per read is also
better in the good file. In the bad file most of the sequences in the bad had
very poor quality. A failure was also issued as indicated by a cross mark
(red in colour) against per sequence quality score in the main window of
that data set.
Note : A warning is raised if the most frequently observed mean quality is
below 27 - this equates to a 0.2% error rate. A failure error is raised if the
most frequently observed mean quality is below 20 - this equates to a 1%
error rate.
Control_R1.fastq Control_R1_good.fastq
Control_R1_bad.fastq
Per Sequence Quality Scores
Interpretation: The per sequence quality score report allows us to see if a
subset of your sequences have universally low quality values. The area
under the bell shaped curve was greater for the good file than the raw data
file indicating that most of the sequences had very good quality in the good
file in comparison to the raw data file.Average quality per read is also
better in the good file. In the bad file most of the sequences in the bad had
very poor quality. A failure was also issued as indicated by a cross mark
(red in colour) against per sequence quality score in the main window of
that data set.
Note : A warning is raised if the most frequently observed mean quality is
below 27 - this equates to a 0.2% error rate. A failure error is raised if the
most frequently observed mean quality is below 20 - this equates to a 1%
error rate.
Control_R1.fastq Control_R1_good.fastq
Control_R1_bad.fastq
Interpretation: The per sequence quality score report allows us to see if a
subset of your sequences have universally low quality values. The area
under the bell shaped curve was greater for the good file than the raw data
file indicating that most of the sequences had very good quality in the good
file in comparison to the raw data file.Average quality per read is also
better in the good file. In the bad file most of the sequences in the bad had
very poor quality. A failure was also issued as indicated by a cross mark
(red in colour) against per sequence quality score in the main window of
that data set.
Note : A warning is raised if the most frequently observed mean quality is
below 27 - this equates to a 0.2% error rate. A failure error is raised if the
most frequently observed mean quality is below 20 - this equates to a 1%
error rate.
Control_R1.fastq Control_R1_good.fastq
Control_R1_bad.fastq
30. Computational Biology and Genomics Facility, Indian Veterinary Research Institute
Interpretat
subset of y
under the b
file indicatin
file in com
better in the
very poor q
(red in colo
that data se
Note : A wa
below 27 -
most freque
error rate.
Control_R1_bad.fastq
31. Computational Biology and Genomics Facility, Indian Veterinary Research Institute
Interpretation: The per sequence quality score report allows us to see if a
subset of your sequences have universally low quality values. The area
under the bell shaped curve was greater for the good file than the raw data
file indicating that most of the sequences had very good quality in the good
file in comparison to the raw data file.Average quality per read is also
better in the good file. In the bad file most of the sequences in the bad had
very poor quality. A failure was also issued as indicated by a cross mark
(red in colour) against per sequence quality score in the main window of
that data set.
Note : A warning is raised if the most frequently observed mean quality is
below 27 - this equates to a 0.2% error rate. A failure error is raised if the
most frequently observed mean quality is below 20 - this equates to a 1%
error rate.
Control_R1.fastq Control_R1_good.fastq
Control_R1_bad.fastq
Per Sequence Quality Scores
Interpretation: The per sequence quality score report allows us to see if a
subset of your sequences have universally low quality values. The area
under the bell shaped curve was greater for the good file than the raw data
file indicating that most of the sequences had very good quality in the good
file in comparison to the raw data file.Average quality per read is also
better in the good file. In the bad file most of the sequences in the bad had
very poor quality. A failure was also issued as indicated by a cross mark
(red in colour) against per sequence quality score in the main window of
that data set.
Note : A warning is raised if the most frequently observed mean quality is
below 27 - this equates to a 0.2% error rate. A failure error is raised if the
most frequently observed mean quality is below 20 - this equates to a 1%
error rate.
Control_R1.fastq Control_R1_good.fastq
Control_R1_bad.fastq
Interpretation: The per sequence quality score report allows us to see if a
subset of your sequences have universally low quality values. The area
under the bell shaped curve was greater for the good file than the raw data
file indicating that most of the sequences had very good quality in the good
file in comparison to the raw data file.Average quality per read is also
better in the good file. In the bad file most of the sequences in the bad had
very poor quality. A failure was also issued as indicated by a cross mark
(red in colour) against per sequence quality score in the main window of
that data set.
Note : A warning is raised if the most frequently observed mean quality is
below 27 - this equates to a 0.2% error rate. A failure error is raised if the
most frequently observed mean quality is below 20 - this equates to a 1%
error rate.
Control_R1.fastq Control_R1_good.fastq
Control_R1_bad.fastq
32. Computational Biology and Genomics Facility, Indian Veterinary Research Institute
Interpretation: The per sequence quality score report allows us to see if a
subset of your sequences have universally low quality values. The area
under the bell shaped curve was greater for the good file than the raw data
file indicating that most of the sequences had very good quality in the good
file in comparison to the raw data file.Average quality per read is also
better in the good file. In the bad file most of the sequences in the bad had
very poor quality. A failure was also issued as indicated by a cross mark
(red in colour) against per sequence quality score in the main window of
that data set.
Note : A warning is raised if the most frequently observed mean quality is
below 27 - this equates to a 0.2% error rate. A failure error is raised if the
most frequently observed mean quality is below 20 - this equates to a 1%
error rate.
33. Computational Biology and Genomics Facility, Indian Veterinary Research Institute
Interpretation : The Basic Statistics module generates
simple composition statistics for the file analyzed. It
gives the filename, file type, Sequences, sequence
length and GC % .
Here all the three files controlR1.fastq, control_R1
good.fastq and control_R1bad.fastq were analyzed. The
raw data file showed > 17 million reads and the good file
generated after running prinseq-lite showed > 16 million
reads. The bad file showed only 0.4 million reads.
Note :- Basic Statistics never raises a warning and never
raises an error.
Control_R1.fastq Control_R1_good.fastq
Control_R1_bad.fastq
Interpretation : The Basic Statistics module genera
simple composition statistics for the file analyzed
gives the filename, file type, Sequences, sequen
length and GC % .
Here all the three files controlR1.fastq, control_
good.fastq and control_R1bad.fastq were analyzed. T
raw data file showed > 17 million reads and the good
generated after running prinseq-lite showed > 16 mill
reads. The bad file showed only 0.4 million reads.
Note :- Basic Statistics never raises a warning and ne
raises an error.
Control_R1.fastq Control_R1_good.fa
Control_R1_bad.fastq
34. Computational Biology and Genomics Facility, Indian Veterinary Research Institute
Interpretation: Per Base Sequence Content plots the proportion
of each base position in a file for which each of the four normal
DNA bases has been called. In a random library you would
expect that there would be little to no difference between the
different bases of a sequence run, so the lines in this plot should
run parallel with each other. The relative amount of each base
should reflect the overall amount of these bases in the genome,
but in any case they should not be hugely imbalanced from each
other. However in all our cases here there is a failure issued due
to variation in A to T and G to C percentages at the start of the
reads till the 14th base. This also indicates that the reads can be
trimmed at the 5’end till the 14th base.
Note : A warning is issued if the difference between A and T, or G
and C is greater than 10% in any position and a failure is issued if
the difference between A and T, or G and C is greater than 20% in
any position.
Control_R1.fastq Control_R1_good.fastq
Control_R1_bad.fastq
35. Computational Biology and Genomics Facility, Indian Veterinary Research Institute In
Control_R1.fastq
36. Computational Biology and Genomics Facility, Indian Veterinary Research Institute
Interpretation: Per Base Sequence Content plots the proportion
of each base position in a file for which each of the four normal
DNA bases has been called. In a random library you would
expect that there would be little to no difference between the
different bases of a sequence run, so the lines in this plot should
run parallel with each other. The relative amount of each base
should reflect the overall amount of these bases in the genome,
but in any case they should not be hugely imbalanced from each
other. However in all our cases here there is a failure issued due
to variation in A to T and G to C percentages at the start of the
reads till the 14th base. This also indicates that the reads can be
trimmed at the 5’end till the 14th base.
Note : A warning is issued if the difference between A and T, or G
and C is greater than 10% in any position and a failure is issued if
the difference between A and T, or G and C is greater than 20% in
any position.
Control_R1.fastq Control_R1_good.fastq
Control_R1_bad.fastq
37. Computational Biology and Genomics Facility, Indian Veterinary Research Institute
Control_R1_good.fastq
38. Computational Biology and Genomics Facility, Indian Veterinary Research Institute
Interpretation: Per Base Sequence Content plots the proportion
of each base position in a file for which each of the four normal
DNA bases has been called. In a random library you would
expect that there would be little to no difference between the
different bases of a sequence run, so the lines in this plot should
run parallel with each other. The relative amount of each base
should reflect the overall amount of these bases in the genome,
but in any case they should not be hugely imbalanced from each
other. However in all our cases here there is a failure issued due
to variation in A to T and G to C percentages at the start of the
reads till the 14th base. This also indicates that the reads can be
trimmed at the 5’end till the 14th base.
Note : A warning is issued if the difference between A and T, or G
and C is greater than 10% in any position and a failure is issued if
the difference between A and T, or G and C is greater than 20% in
any position.
Control_R1.fastq Control_R1_good.fastq
Control_R1_bad.fastq
39. Computational Biology and Genomics Facility, Indian Veterinary Research Institute
I
p
f
w
t
s
b
g
f
i
s
c
N
a
t
a
Control_R1_bad.fastq
40. Computational Biology and Genomics Facility, Indian Veterinary Research Institute
Interpretation: Per Base Sequence Content plots the proportion
of each base position in a file for which each of the four normal
DNA bases has been called. In a random library you would
expect that there would be little to no difference between the
different bases of a sequence run, so the lines in this plot should
run parallel with each other. The relative amount of each base
should reflect the overall amount of these bases in the genome,
but in any case they should not be hugely imbalanced from each
other. However in all our cases here there is a failure issued due
to variation in A to T and G to C percentages at the start of the
reads till the 14th base. This also indicates that the reads can be
trimmed at the 5’end till the 14th base.
Note : A warning is issued if the difference between A and T, or G
and C is greater than 10% in any position and a failure is issued if
the difference between A and T, or G and C is greater than 20% in
any position.
Control_R1.fastq Control_R1_good.fastq
Control_R1_bad.fastq
41. Computational Biology and Genomics Facility, Indian Veterinary Research Institute
Interpretation: Per Base Sequence Content plots the proportion
of each base position in a file for which each of the four normal
DNA bases has been called. In a random library you would
expect that there would be little to no difference between the
different bases of a sequence run, so the lines in this plot should
run parallel with each other. The relative amount of each base
should reflect the overall amount of these bases in the genome,
but in any case they should not be hugely imbalanced from each
other. However in all our cases here there is a failure issued due
to variation in A to T and G to C percentages at the start of the
reads till the 14th base. This also indicates that the reads can be
trimmed at the 5’end till the 14th base.
Note : A warning is issued if the difference between A and T, or G
and C is greater than 10% in any position and a failure is issued if
the difference between A and T, or G and C is greater than 20% in
any position.
42. Computational Biology and Genomics Facility, Indian Veterinary Research Institute
Interpretation : The Basic Statistics module generates
simple composition statistics for the file analyzed. It
gives the filename, file type, Sequences, sequence
length and GC % .
Here all the three files controlR1.fastq, control_R1
good.fastq and control_R1bad.fastq were analyzed. The
raw data file showed > 17 million reads and the good file
generated after running prinseq-lite showed > 16 million
reads. The bad file showed only 0.4 million reads.
Note :- Basic Statistics never raises a warning and never
raises an error.
Control_R1.fastq Control_R1_good.fastq
Control_R1_bad.fastq
Interpretation : The Basic Statistics module genera
simple composition statistics for the file analyzed
gives the filename, file type, Sequences, sequen
length and GC % .
Here all the three files controlR1.fastq, control_
good.fastq and control_R1bad.fastq were analyzed. T
raw data file showed > 17 million reads and the good
generated after running prinseq-lite showed > 16 mill
reads. The bad file showed only 0.4 million reads.
Note :- Basic Statistics never raises a warning and ne
raises an error.
Control_R1.fastq Control_R1_good.fa
Control_R1_bad.fastq
43. Computational Biology and Genomics Facility, Indian Veterinary Research Institute
Interpretation :This module measures the GC content across the whole
length of each sequence in a file and compares it to a modeled normal
distribution of GC content. In a normal random library you would expect to see
a roughly normal distribution of GC content where the central peak
corresponds to the overall GC content of the underlying genome. An unusually
shaped distribution could indicate a contaminated library or some other kinds
of biased subset. In our data sets a warning is raised for the raw and good
files and a failure was issued for the bad file. It is clear that the deviation from
the normal distribution is greater in the bad file output in comparison to the
good and raw file outputs.
Note : A warning is raised if the sum of the deviations from the normal
distribution represents more than 15% of the reads. And failure is issued if the
sum of the deviations from the normal distribution represents more than 30%
of the reads.
Control_R1.fastq
Control_R1_good.fastq
Control_R1_bad.fastq
Per Sequence GC Content
44. Computational Biology and Genomics Facility, Indian Veterinary Research Institute
Interpret
length of
Control_R1.fastq
Cont
45. Computational Biology and Genomics Facility, Indian Veterinary Research Institute
Interpretation :This module measures the GC content across the whole
length of each sequence in a file and compares it to a modeled normal
distribution of GC content. In a normal random library you would expect to see
a roughly normal distribution of GC content where the central peak
corresponds to the overall GC content of the underlying genome. An unusually
shaped distribution could indicate a contaminated library or some other kinds
of biased subset. In our data sets a warning is raised for the raw and good
files and a failure was issued for the bad file. It is clear that the deviation from
the normal distribution is greater in the bad file output in comparison to the
good and raw file outputs.
Note : A warning is raised if the sum of the deviations from the normal
distribution represents more than 15% of the reads. And failure is issued if the
sum of the deviations from the normal distribution represents more than 30%
of the reads.
Control_R1.fastq
Control_R1_good.fastq
Control_R1_bad.fastq
Per Sequence GC Content
46. Computational Biology and Genomics Facility, Indian Veterinary Research Institute
Interpretation :This module measures the GC content across the whole
Control_R1_good.fastq
47. Computational Biology and Genomics Facility, Indian Veterinary Research Institute
Interpretation :This module measures the GC content across the whole
length of each sequence in a file and compares it to a modeled normal
distribution of GC content. In a normal random library you would expect to see
a roughly normal distribution of GC content where the central peak
corresponds to the overall GC content of the underlying genome. An unusually
shaped distribution could indicate a contaminated library or some other kinds
of biased subset. In our data sets a warning is raised for the raw and good
files and a failure was issued for the bad file. It is clear that the deviation from
the normal distribution is greater in the bad file output in comparison to the
good and raw file outputs.
Note : A warning is raised if the sum of the deviations from the normal
distribution represents more than 15% of the reads. And failure is issued if the
sum of the deviations from the normal distribution represents more than 30%
of the reads.
Control_R1.fastq
Control_R1_good.fastq
Control_R1_bad.fastq
Per Sequence GC Content
48. Computational Biology and Genomics Facility, Indian Veterinary Research Institute
Interpretat
length of e
distribution
a roughly
correspond
shaped dis
of biased s
files and a
the normal
good and ra
Note : A wa
distribution
sum of the
of the reads
Control_R1_bad.fastq
49. Computational Biology and Genomics Facility, Indian Veterinary Research Institute
Interpretation :This module measures the GC content across the whole
length of each sequence in a file and compares it to a modeled normal
distribution of GC content. In a normal random library you would expect to see
a roughly normal distribution of GC content where the central peak
corresponds to the overall GC content of the underlying genome. An unusually
shaped distribution could indicate a contaminated library or some other kinds
of biased subset. In our data sets a warning is raised for the raw and good
files and a failure was issued for the bad file. It is clear that the deviation from
the normal distribution is greater in the bad file output in comparison to the
good and raw file outputs.
Note : A warning is raised if the sum of the deviations from the normal
distribution represents more than 15% of the reads. And failure is issued if the
sum of the deviations from the normal distribution represents more than 30%
of the reads.
Control_R1.fastq
Control_R1_good.fastq
Control_R1_bad.fastq
Per Sequence GC Content
50. Computational Biology and Genomics Facility, Indian Veterinary Research Institute
Interpretation :This module measures the GC content across the whole
length of each sequence in a file and compares it to a modeled normal
distribution of GC content. In a normal random library you would expect to see
a roughly normal distribution of GC content where the central peak
corresponds to the overall GC content of the underlying genome. An unusually
shaped distribution could indicate a contaminated library or some other kinds
of biased subset. In our data sets a warning is raised for the raw and good
files and a failure is issued for the bad file. It is clear that the deviation from
the normal distribution is greater in the bad file output in comparison to the
good and raw file outputs.
Note : A warning is raised if the sum of the deviations from the normal
distribution represents more than 15% of the reads. And failure is issued if the
sum of the deviations from the normal distribution represents more than 30%
of the reads.
51. Computational Biology and Genomics Facility, Indian Veterinary Research Institute
Interpretation : The Basic Statistics module generates
simple composition statistics for the file analyzed. It
gives the filename, file type, Sequences, sequence
length and GC % .
Here all the three files controlR1.fastq, control_R1
good.fastq and control_R1bad.fastq were analyzed. The
raw data file showed > 17 million reads and the good file
generated after running prinseq-lite showed > 16 million
reads. The bad file showed only 0.4 million reads.
Note :- Basic Statistics never raises a warning and never
raises an error.
Control_R1.fastq Control_R1_good.fastq
Control_R1_bad.fastq
Interpretation : The Basic Statistics module generat
simple composition statistics for the file analyzed.
gives the filename, file type, Sequences, sequen
length and GC % .
Here all the three files controlR1.fastq, control_R
good.fastq and control_R1bad.fastq were analyzed. T
raw data file showed > 17 million reads and the good f
generated after running prinseq-lite showed > 16 milli
reads. The bad file showed only 0.4 million reads.
Note :- Basic Statistics never raises a warning and nev
raises an error.
Control_R1.fastq Control_R1_good.fas
Control_R1_bad.fastq
52. Computational Biology and Genomics Facility, Indian Veterinary Research Institute
Interpretation:This module plots out the percentage of base calls at each
position for which an N was called. It's not unusual to see a very low
proportion of Ns appearing in a sequence, especially nearer the end of a
sequence. Here no N’s were found in all the datasets.
Note : A warning is raised if any position shows an N content of >5% and a
failure is issued if any position shows an N content of >20%
Control_R1.fastq
Control_R1_good.fastq
Control_R1_bad.fastq
Per Base N Content
Interpretation:This module plots out the percentage of base calls at each
position for which an N was called. It's not unusual to see a very low
proportion of Ns appearing in a sequence, especially nearer the end of a
sequence. Here no N’s were found in all the datasets.
Note : A warning is raised if any position shows an N content of >5% and a
failure is issued if any position shows an N content of >20%
Control_R1.fastq
Control_R1_good.fastq
Control_R1_bad.fastq
53. Computational Biology and Genomics Facility, Indian Veterinary Research Institute
Interpreta
position f
Control_R1.fastq
54. Computational Biology and Genomics Facility, Indian Veterinary Research Institute
Interpretation:This module plots out the percentage of base calls at each
position for which an N was called. It's not unusual to see a very low
proportion of Ns appearing in a sequence, especially nearer the end of a
sequence. Here no N’s were found in all the datasets.
Note : A warning is raised if any position shows an N content of >5% and a
failure is issued if any position shows an N content of >20%
Control_R1.fastq
Control_R1_good.fastq
Control_R1_bad.fastq
Per Base N Content
Interpretation:This module plots out the percentage of base calls at each
position for which an N was called. It's not unusual to see a very low
proportion of Ns appearing in a sequence, especially nearer the end of a
sequence. Here no N’s were found in all the datasets.
Note : A warning is raised if any position shows an N content of >5% and a
failure is issued if any position shows an N content of >20%
Control_R1.fastq
Control_R1_good.fastq
Control_R1_bad.fastq
55. Computational Biology and Genomics Facility, Indian Veterinary Research InstituteInterpretation:This module plots out the percentage of base calls at each
Control_R1_good.fastq
56. Computational Biology and Genomics Facility, Indian Veterinary Research Institute
Interpretation:This module plots out the percentage of base calls at each
position for which an N was called. It's not unusual to see a very low
proportion of Ns appearing in a sequence, especially nearer the end of a
sequence. Here no N’s were found in all the datasets.
Note : A warning is raised if any position shows an N content of >5% and a
failure is issued if any position shows an N content of >20%
Control_R1.fastq
Control_R1_good.fastq
Control_R1_bad.fastq
57. Computational Biology and Genomics Facility, Indian Veterinary Research Institute
Interpre
position
proportio
sequenc
Note : A
failure is
Control_R1_bad.fastq
58. Computational Biology and Genomics Facility, Indian Veterinary Research Institute
Interpretation:This module plots out the percentage of base calls at each
position for which an N was called. It's not unusual to see a very low
proportion of Ns appearing in a sequence, especially nearer the end of a
sequence. Here no N’s were found in all the datasets.
Note : A warning is raised if any position shows an N content of >5% and a
failure is issued if any position shows an N content of >20%
Control_R1.fastq
Control_R1_good.fastq
Control_R1_bad.fastq
59. Computational Biology and Genomics Facility, Indian Veterinary Research Institute
Interpretation:This module plots out the percentage of base calls at each
position for which an N was called. It's not unusual to see a very low
proportion of Ns appearing in a sequence, especially nearer the end of a
sequence. Here no N’s were found in all the datasets.
Note : A warning is raised if any position shows an N content of >5% and a
failure is issued if any position shows an N content of >20%
60. Computational Biology and Genomics Facility, Indian Veterinary Research Institute
Interpretation : The Basic Statistics module generates
simple composition statistics for the file analyzed. It
gives the filename, file type, Sequences, sequence
length and GC % .
Here all the three files controlR1.fastq, control_R1
good.fastq and control_R1bad.fastq were analyzed. The
raw data file showed > 17 million reads and the good file
generated after running prinseq-lite showed > 16 million
reads. The bad file showed only 0.4 million reads.
Note :- Basic Statistics never raises a warning and never
raises an error.
Control_R1.fastq Control_R1_good.fastq
Control_R1_bad.fastq
Interpretation : The Basic Statistics module generat
simple composition statistics for the file analyzed.
gives the filename, file type, Sequences, sequen
length and GC % .
Here all the three files controlR1.fastq, control_R
good.fastq and control_R1bad.fastq were analyzed. T
raw data file showed > 17 million reads and the good f
generated after running prinseq-lite showed > 16 milli
reads. The bad file showed only 0.4 million reads.
Note :- Basic Statistics never raises a warning and nev
raises an error.
Control_R1.fastq Control_R1_good.fas
Control_R1_bad.fastq
61. Computational Biology and Genomics Facility, Indian Veterinary Research Institute
Sequence length Distribution
Interpretation :This module generates a graph showing the distribution of fragment
sizes in the file which was analysed.In many cases this will produce a simple graph
showing a peak only at one size, but for variable length FastQ files this will show
the relative amounts of each different size of sequence fragment. Here in all the
files we have reads with a length of 101 bp.
Note : A warning is raised if all sequences are not the same length. A failure is
issued if any of the sequences have zero length.
Control_R1.fastq
Control_R1_good.fastq
Control_R1_bad.fastq
62. Computational Biology and Genomics Facility, Indian Veterinary Research Institute
Interpre
sizes in
Control_R1.fastq
Co
63. Computational Biology and Genomics Facility, Indian Veterinary Research Institute
Sequence length Distribution
Interpretation :This module generates a graph showing the distribution of fragment
sizes in the file which was analysed.In many cases this will produce a simple graph
showing a peak only at one size, but for variable length FastQ files this will show
the relative amounts of each different size of sequence fragment. Here in all the
files we have reads with a length of 101 bp.
Note : A warning is raised if all sequences are not the same length. A failure is
issued if any of the sequences have zero length.
Control_R1.fastq
Control_R1_good.fastq
Control_R1_bad.fastq
64. Computational Biology and Genomics Facility, Indian Veterinary Research InstituteInterpretation :This module generates a graph showing the distribution of fragment
Control_R1_good.fastq
65. Computational Biology and Genomics Facility, Indian Veterinary Research Institute
Interpretation :This module generates a graph showing the distribution of fragment
sizes in the file which was analysed.In many cases this will produce a simple graph
showing a peak only at one size, but for variable length FastQ files this will show
the relative amounts of each different size of sequence fragment. Here in all the
files we have reads with a length of 101 bp.
Note : A warning is raised if all sequences are not the same length. A failure is
issued if any of the sequences have zero length.
Control_R1.fastq
Control_R1_good.fastq
Control_R1_bad.fastq
Sequence length Distribution
66. Computational Biology and Genomics Facility, Indian Veterinary Research Institute
Interpretati
sizes in the
showing a
the relative
files we ha
Note : A w
issued if an
Control_R1_bad.fastq
67. Computational Biology and Genomics Facility, Indian Veterinary Research Institute
Interpretation: This module generates a graph showing the distribution of fragment
sizes in the file which was analysed.In many cases this will produce a simple graph
showing a peak only at one size, but for variable length FastQ files this will show
the relative amounts of each different size of sequence fragment. Here in all the
files we have reads with a length of 101 bp.
Note : A warning is raised if all sequences are not the same length. A failure is
issued if any of the sequences have zero length.
Control_R1.fastq
Control_R1_good.fastq
Control_R1_bad.fastq
Sequence length Distribution
68. Computational Biology and Genomics Facility, Indian Veterinary Research Institute
Interpretation: This module generates a graph showing the distribution of fragment
sizes in the file which was analysed.In many cases this will produce a simple graph
showing a peak only at one size, but for variable length FastQ files this will show
the relative amounts of each different size of sequence fragment. Here in all the
files we have reads with a length of 101 bp.
Note : A warning is raised if all sequences are not the same length. A failure is
issued if any of the sequences have zero length.
69. Computational Biology and Genomics Facility, Indian Veterinary Research Institute
Interpretation : The Basic Statistics module generates
simple composition statistics for the file analyzed. It
gives the filename, file type, Sequences, sequence
length and GC % .
Here all the three files controlR1.fastq, control_R1
good.fastq and control_R1bad.fastq were analyzed. The
raw data file showed > 17 million reads and the good file
generated after running prinseq-lite showed > 16 million
reads. The bad file showed only 0.4 million reads.
Note :- Basic Statistics never raises a warning and never
raises an error.
Control_R1.fastq Control_R1_good.fastq
Control_R1_bad.fastq
Interpretation : The Basic Statistics module generat
simple composition statistics for the file analyzed.
gives the filename, file type, Sequences, sequen
length and GC % .
Here all the three files controlR1.fastq, control_R
good.fastq and control_R1bad.fastq were analyzed. T
raw data file showed > 17 million reads and the good f
generated after running prinseq-lite showed > 16 milli
reads. The bad file showed only 0.4 million reads.
Note :- Basic Statistics never raises a warning and nev
raises an error.
Control_R1.fastq Control_R1_good.fas
Control_R1_bad.fastq
70. Computational Biology and Genomics Facility, Indian Veterinary Research Institute
Control_R1.fastq
No Overrepresented Sequences
Control_R1_good.fastq
No Overrepresented Sequences
Sequence Count Percentage Possible Source
GATCGGAAGA
GCACACGTCTG
AACTCCAGTCA
CTGACCAACTC
TCCGTATGC
3950 0.84781596
16915967
TrueSeq Adapter,
index 4 (110%
over 50 bp)
Interpretation: Overrepresented sequences include the sequences that
are highly duplicated in your library, as well as any primer and/or adapter
dimers that were present in the original library. Adapter sequences are
always present in a sequencing experiment at some level, but aren't
problematic in small percentages. These adapters will not align to your
genome. They can be ignored, or you may use analysis software to
remove them. This module lists all of the sequence, which make up
more than 0.1% of the total. To conserve memory only sequences which
appear in the first 200,000 sequences are tracked to the end of the file.
It is therefore possible that a sequence,which is overrepresented but
doesn't appear at the start of the file for some reason could be missed
by this module. Here wee find overrepresented sequences of adapter in
the bad file
Note : A warning is raised if any sequence is found to represent more
than 0.1% of the total and a failure is issued if any sequence is found to
represent more than 1% of the total.
Control_R1_bad.fastq
Overrepresented Sequences
71. Computational Biology and Genomics Facility, Indian Veterinary Research Institute
Control_R1.fastq
No Overrepresented Sequences
Sequence Count Percentage Possible Source
GATCGGAAGA
GCACACGTCTG
AACTCCAGTCA
CTGACCAACTC
TCCGTATGC
3950 0.84781596
16915967
TrueSeq Adapter,
index 4 (110%
over 50 bp)
I
a
d
a
p
g
r
m
a
I
d
b
t
N
t
r
Control_R1_bad.fastq
72. Computational Biology and Genomics Facility, Indian Veterinary Research Institute
Control_R1.fastq
No Overrepresented Sequences
Control_R1_good.fastq
No Overrepresented Sequences
Sequence Count Percentage Possible Source
GATCGGAAGA
GCACACGTCTG
AACTCCAGTCA
CTGACCAACTC
TCCGTATGC
3950 0.84781596
16915967
TrueSeq Adapter,
index 4 (110%
over 50 bp)
Interpretation: Overrepresented sequences include the sequences that
are highly duplicated in your library, as well as any primer and/or adapter
dimers that were present in the original library. Adapter sequences are
always present in a sequencing experiment at some level, but aren't
problematic in small percentages. These adapters will not align to your
genome. They can be ignored, or you may use analysis software to
remove them. This module lists all of the sequence, which make up
more than 0.1% of the total. To conserve memory only sequences which
appear in the first 200,000 sequences are tracked to the end of the file.
It is therefore possible that a sequence,which is overrepresented but
doesn't appear at the start of the file for some reason could be missed
by this module. Here wee find overrepresented sequences of adapter in
the bad file
Note : A warning is raised if any sequence is found to represent more
than 0.1% of the total and a failure is issued if any sequence is found to
represent more than 1% of the total.
Control_R1_bad.fastq
Overrepresented Sequences
73. Computational Biology and Genomics Facility, Indian Veterinary Research Institute
No Overrepresented Sequences
Interpretation: Overrepresented sequences include the sequences that
are highly duplicated in your library, as well as any primer and/or adapter
dimers that were present in the original library. Adapter sequences are
always present in a sequencing experiment at some level, but aren't
problematic in small percentages. These adapters will not align to your
genome. They can be ignored, or you may use analysis software to
remove them. This module lists all the sequences, which make up more
than 0.1% of the total. To conserve memory only sequences which
appear in the first 200,000 sequences are tracked to the end of the file.
It is therefore possible that a sequence,which is overrepresented but
doesn't appear at the start of the file for some reason could be missed
by this module. Here wee find overrepresented sequences of adapter in
the bad file
Note : A warning is raised if any sequence is found to represent more
than 0.1% of the total and a failure is issued if any sequence is found to
represent more than 1% of the total.
74. Computational Biology and Genomics Facility, Indian Veterinary Research Institute
Interpretation : The Basic Statistics module generates
simple composition statistics for the file analyzed. It
gives the filename, file type, Sequences, sequence
length and GC % .
Here all the three files controlR1.fastq, control_R1
good.fastq and control_R1bad.fastq were analyzed. The
raw data file showed > 17 million reads and the good file
generated after running prinseq-lite showed > 16 million
reads. The bad file showed only 0.4 million reads.
Note :- Basic Statistics never raises a warning and never
raises an error.
Control_R1.fastq Control_R1_good.fastq
Control_R1_bad.fastq
Interpretation : The Basic Statistics module generat
simple composition statistics for the file analyzed.
gives the filename, file type, Sequences, sequen
length and GC % .
Here all the three files controlR1.fastq, control_R
good.fastq and control_R1bad.fastq were analyzed. T
raw data file showed > 17 million reads and the good f
generated after running prinseq-lite showed > 16 milli
reads. The bad file showed only 0.4 million reads.
Note :- Basic Statistics never raises a warning and nev
raises an error.
Control_R1.fastq Control_R1_good.fas
Control_R1_bad.fastq
75. Computational Biology and Genomics Facility, Indian Veterinary Research Institute
Duplicate sequences
Interpretation: This module counts the degree of duplication for every
sequence in the set and creates a plot showing the relative number of
sequences with different degrees of duplication. In this module analysis
occurs only for the first 200,000 different sequences seen. The number of
occurrences of these sequences is then tracked through the rest of the file,
but any new sequences after the first 200,000 are then discarded. Also,
any sequences with more than 10 duplicates are placed into the 10
duplicates category - so it's not unusual to see a small rise in this final
category. If the rate at which the duplicate plot falls from unique sequences
is slow – showing appreciable proportions of the library with duplication
levels of 3-5, and a small spike in the 10+ bin there may be a biological
rather than a technical cause. The most common type of library to produce
this type of plot is an RNA-Seq library. In this type of library it is expected
that some sequences will occur very frequently, and others will be very
rare. If you want to see the very rare sequences (eg low copy number
transcripts), then you will have to greatly over-sequence the most frequent
sequences (eg housekeeping genes), so a high level of duplication in part
of the library is unavoidable. Therefore you see a warning in the case of
raw and good files
Note: A warning is raised if non-unique sequences make up more than
20% of the total. And failure is issued if non-unique sequences make up
more than 50% of the total.
Control_R1.fastq
Control_R1_good.fastq
Control_R1_bad.fastq
76. Computational Biology and Genomics Facility, Indian Veterinary Research Institute
Interpret
sequenc
sequenc
occurs o
Control_R1.fastq
77. Computational Biology and Genomics Facility, Indian Veterinary Research Institute
Duplicate sequences
Interpretation: This module counts the degree of duplication for every
sequence in the set and creates a plot showing the relative number of
sequences with different degrees of duplication. In this module analysis
occurs only for the first 200,000 different sequences seen. The number of
occurrences of these sequences is then tracked through the rest of the file,
but any new sequences after the first 200,000 are then discarded. Also,
any sequences with more than 10 duplicates are placed into the 10
duplicates category - so it's not unusual to see a small rise in this final
category. If the rate at which the duplicate plot falls from unique sequences
is slow – showing appreciable proportions of the library with duplication
levels of 3-5, and a small spike in the 10+ bin there may be a biological
rather than a technical cause. The most common type of library to produce
this type of plot is an RNA-Seq library. In this type of library it is expected
that some sequences will occur very frequently, and others will be very
rare. If you want to see the very rare sequences (eg low copy number
transcripts), then you will have to greatly over-sequence the most frequent
sequences (eg housekeeping genes), so a high level of duplication in part
of the library is unavoidable. Therefore you see a warning in the case of
raw and good files
Note: A warning is raised if non-unique sequences make up more than
20% of the total. And failure is issued if non-unique sequences make up
more than 50% of the total.
Control_R1.fastq
Control_R1_good.fastq
Control_R1_bad.fastq
78. Computational Biology and Genomics Facility, Indian Veterinary Research Institute
Interpretation: This module counts the degree of duplication for every
Control_R1_good.fastq
79. Computational Biology and Genomics Facility, Indian Veterinary Research Institute
Duplicate sequences
Interpretation: This module counts the degree of duplication for every
sequence in the set and creates a plot showing the relative number of
sequences with different degrees of duplication. In this module analysis
occurs only for the first 200,000 different sequences seen. The number of
occurrences of these sequences is then tracked through the rest of the file,
but any new sequences after the first 200,000 are then discarded. Also,
any sequences with more than 10 duplicates are placed into the 10
duplicates category - so it's not unusual to see a small rise in this final
category. If the rate at which the duplicate plot falls from unique sequences
is slow – showing appreciable proportions of the library with duplication
levels of 3-5, and a small spike in the 10+ bin there may be a biological
rather than a technical cause. The most common type of library to produce
this type of plot is an RNA-Seq library. In this type of library it is expected
that some sequences will occur very frequently, and others will be very
rare. If you want to see the very rare sequences (eg low copy number
transcripts), then you will have to greatly over-sequence the most frequent
sequences (eg housekeeping genes), so a high level of duplication in part
of the library is unavoidable. Therefore you see a warning in the case of
raw and good files
Note: A warning is raised if non-unique sequences make up more than
20% of the total. And failure is issued if non-unique sequences make up
more than 50% of the total.
Control_R1.fastq
Control_R1_good.fastq
Control_R1_bad.fastq
80. Computational Biology and Genomics Facility, Indian Veterinary Research Institute
Interpr
sequen
sequen
occurs
occurre
but any
any se
duplica
catego
is slow
levels o
rather t
this typ
that so
rare.
transcr
sequen
of the l
raw and
Note: A
20% of
more th
Control_R1_bad.fastq
81. Computational Biology and Genomics Facility, Indian Veterinary Research Institute
Duplicate sequences
Interpretation: This module counts the degree of duplication for every
sequence in the set and creates a plot showing the relative number of
sequences with different degrees of duplication. In this module analysis
occurs only for the first 200,000 different sequences seen. The number of
occurrences of these sequences is then tracked through the rest of the file,
but any new sequences after the first 200,000 are then discarded. Also,
any sequences with more than 10 duplicates are placed into the 10
duplicates category - so it's not unusual to see a small rise in this final
category. If the rate at which the duplicate plot falls from unique sequences
is slow – showing appreciable proportions of the library with duplication
levels of 3-5, and a small spike in the 10+ bin may be biological rather than
technical. The most common type of library to produce this type of plot is
an RNA-Seq library. In this type of library it is expected that some
sequences will occur very frequently, and others will be very rare. If you
want to see very rare sequences (eg low copy number transcripts), then
you will have to greatly over-sequence the most frequent sequences (eg
housekeeping genes), so a high level of duplication in part of the library is
unavoidable. Therefore you see a warning in the case of raw and good
files
Note: A warning is raised if non-unique sequences make up more than
20% of the total. And failure is issued if non-unique sequences make up
more than 50% of the total.
Control_R1.fastq
Control_R1_good.fastq
Control_R1_bad.fastq
82. Computational Biology and Genomics Facility, Indian Veterinary Research Institute
Interpretation: This module counts the degree of duplication for every
sequence in the set and creates a plot showing the relative number of
sequences with different degrees of duplication. In this module analysis
occurs only for the first 200,000 different sequences seen. The number of
occurrences of these sequences is then tracked through the rest of the file,
but any new sequences after the first 200,000 are then discarded. Also,
any sequences with more than 10 duplicates are placed into the 10
duplicates category - so it's not unusual to see a small rise in this final
category. If the rate at which the duplicate plot falls from unique sequences
is slow – showing appreciable proportions of the library with duplication
levels of 3-5, and a small spike in the 10+ bin may be biological rather than
technical. The most common type of library to produce this type of plot is
an RNA-Seq library. In this type of library it is expected that some
sequences will occur very frequently, and others will be very rare. If you
want to see very rare sequences (eg low copy number transcripts), then
you will have to greatly over-sequence the most frequent sequences (eg
housekeeping genes), so a high level of duplication in part of the library is
unavoidable. Therefore you see a warning in the case of raw and good
files
Note: A warning is raised if non-unique sequences make up more than
20% of the total. And failure is issued if non-unique sequences make up
more than 50% of the total.
83. Computational Biology and Genomics Facility, Indian Veterinary Research Institute
Interpretation : The Basic Statistics module generates
simple composition statistics for the file analyzed. It
gives the filename, file type, Sequences, sequence
length and GC % .
Here all the three files controlR1.fastq, control_R1
good.fastq and control_R1bad.fastq were analyzed. The
raw data file showed > 17 million reads and the good file
generated after running prinseq-lite showed > 16 million
reads. The bad file showed only 0.4 million reads.
Note :- Basic Statistics never raises a warning and never
raises an error.
Control_R1.fastq Control_R1_good.fastq
Control_R1_bad.fastq
Interpretation : The Basic Statistics module generat
simple composition statistics for the file analyzed.
gives the filename, file type, Sequences, sequen
length and GC % .
Here all the three files controlR1.fastq, control_R
good.fastq and control_R1bad.fastq were analyzed. T
raw data file showed > 17 million reads and the good f
generated after running prinseq-lite showed > 16 milli
reads. The bad file showed only 0.4 million reads.
Note :- Basic Statistics never raises a warning and nev
raises an error.
Control_R1.fastq Control_R1_good.fas
Control_R1_bad.fastq
84. Computational Biology and Genomics Facility, Indian Veterinary Research Institute
Overrepresented Kmers
Interpretation: This module counts the enrichment of every 5-mer within the
sequence library. Any k-mer showing more than a 3 fold overall enrichment or a 5
fold enrichment at any given base position will be reported by this module.
Note: A warning is raised if any k-mer is enriched more than 3 fold overall, or
more than 5 fold at any individual position.
And failure is issued if non-unique if any k-mer is enriched more than 10 fold at
any individual base position
Control_R1.fastq
Control_R1_good.fastq
Control_R1_bad.fastq
85. Computational Biology and Genomics Facility, Indian Veterinary Research Institute
Interpre
sequenc
fold enric
Control_R1.fastq
86. Computational Biology and Genomics Facility, Indian Veterinary Research Institute
Interpretation: This module counts the enrichment of every 5-mer within the
sequence library. Any k-mer showing more than a 3 fold overall enrichment or a 5
fold enrichment at any given base position will be reported by this module.
Note: A warning is raised if any k-mer is enriched more than 3 fold overall, or
more than 5 fold at any individual position.
And failure is issued if non-unique if any k-mer is enriched more than 10 fold at
any individual base position
Control_R1.fastq
Control_R1_good.fastq
Control_R1_bad.fastq
87. Computational Biology and Genomics Facility, Indian Veterinary Research Institute
Interpretation: This module counts the enrichment of every 5-mer within the
sequence library. Any k-mer showing more than a 3 fold overall enrichment or a 5
fold enrichment at any given base position will be reported by this module.
Control_R1_good.fastq
88. Computational Biology and Genomics Facility, Indian Veterinary Research Institute
Interpretation: This module counts the enrichment of every 5-mer within the
sequence library. Any k-mer showing more than a 3 fold overall enrichment or a 5
fold enrichment at any given base position will be reported by this module.
Note: A warning is raised if any k-mer is enriched more than 3 fold overall, or
more than 5 fold at any individual position.
And failure is issued if non-unique if any k-mer is enriched more than 10 fold at
any individual base position
Control_R1.fastq
Control_R1_good.fastq
Control_R1_bad.fastq
89. Computational Biology and Genomics Facility, Indian Veterinary Research Institute
In
se
fol
No
mo
An
an
Control_R1_bad.fastq
90. Computational Biology and Genomics Facility, Indian Veterinary Research Institute
Interpretation: This module counts the enrichment of every 5-mer within the
sequence library. Any k-mer showing more than a 3 fold overall enrichment or a 5
fold enrichment at any given base position will be reported by this module.
Note: A warning is raised if any k-mer is enriched more than 3 fold overall, or
more than 5 fold at any individual position.
And failure is issued if non-unique if any k-mer is enriched more than 10 fold at
any individual base position
Control_R1.fastq
Control_R1_good.fastq
Control_R1_bad.fastq
91. Computational Biology and Genomics Facility, Indian Veterinary Research Institute
Interpretation: This module counts the enrichment of every 5-mer within the
sequence library. Any k-mer showing more than a 3 fold overall enrichment or a 5
fold enrichment at any given base position will be reported by this module.
Note: A warning is raised if any k-mer is enriched more than 3 fold overall, or
more than 5 fold at any individual position.
And failure is issued if non-unique if any k-mer is enriched more than 10 fold at
any individual base position