WSO2CON 2024 - How CSI Piemonte Is Apifying the Public Administration
Safety stock ASCP safety stock
1. How Does ASCP Calculate Organization Item Attribute Setup MRP Planned Safety Stock?
Solution
ASCP calculates safety stockfor MRP Planned Safety Stock items in three steps
1. Calculate safety stock based on percentage
2. Smooth within time interval
3. Smooth across time interval
NOTE: Smoothing of Safety Stock cannot be done when Profile MSC: Use FIFO Pegging - Yes. We will
only be able to accomplish step #1 and calculate safety stock.
The steps are explained below with example.
----------------------------------------------------------
Date 1-M 2-Tu 3-W 4-Th 5-F 6-Sa 7-Su 8-M 9-Tu 10-W
---- ---- ---- ---- ---- ---- ---- ---- ---- ----
Demands 5 15 5 35 30 20 20 10
----------------------------------------------------------
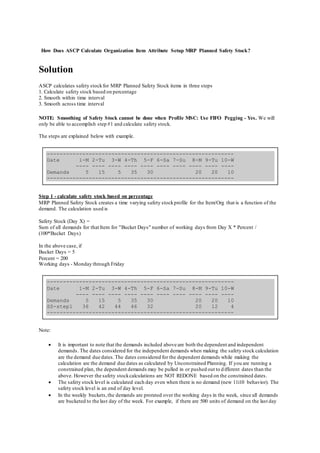
Step 1 - calculate safety stock based on percentage
MRP Planned Safety Stock creates a time varying safety stockprofile for the Item/Org that is a function of the
demand. The calculation used is
Safety Stock (Day X) =
Sum of all demands for that Item for "Bucket Days" number of working days from Day X * Percent /
(100*Bucket Days)
In the above case, if
Bucket Days = 5
Percent = 200
Working days - Monday through Friday
----------------------------------------------------------
Date 1-M 2-Tu 3-W 4-Th 5-F 6-Sa 7-Su 8-M 9-Tu 10-W
---- ---- ---- ---- ---- ---- ---- ---- ---- ----
Demands 5 15 5 35 30 20 20 10
SS-step1 36 42 44 46 32 20 12 4
----------------------------------------------------------
Note:
It is important to note that the demands included above are both the dependent and independent
demands. The dates considered for the independent demands when making the safety stock calculation
are the demand due dates.The dates considered for the dependent demands while making the
calculation are the demand due dates as calculated by Unconstrained Planning. If you are running a
constrained plan, the dependent demands may be pulled in or pushed out to different dates than the
above. However the safety stockcalculations are NOT REDONE based on the constrained dates.
The safety stock level is calculated each day even when there is no demand (new 11i10 behavior). The
safety stock level is an end of day level.
In the weekly buckets,the demands are prorated over the working days in the week, since all demands
are bucketed to the last day of the week. For example, if there are 500 units of demand on the last day
2. of the week, say Friday, and there are 5 working days then the safety stock calculation will use a daily
demand of 100 units.
If either Safety Stock Bucket Days or Safety Stock Percent are null, then the default in both cases is 0
and safety stockis 0.
Step 2 - Smooth Within Time Interval
Safety stock is then smoothed within the time interval specified in "MSC: Safety stock change interval (Days)"
using the smoothing method specified in the profile "MSC: Smoothing method to calculate Safety stock within
Change interval". The valid methods are - Minimum, Maximum and Average.
Continuing in the same example with
MSC: Safety stockchange interval (Days) = 2
MSC: Smoothing method to calculate Safety stock within Change interval = Average
----------------------------------------------------------
Date 1-M 2-Tu 3-W 4-Th 5-F 6-Sa 7-Su 8-M 9-Tu 10-W
---- ---- ---- ---- ---- ---- ---- ---- ---- ----
Demands 5 15 5 35 30 20 20 10
SS-step1 36 42 44 46 32 20 12 4
SS-step2 39 39 45 45 26 26 8 8
----------------------------------------------------------
Step 3 - Smooth Across Time Interval
Starting from the time interval that has the maximum value of safety stock, ASCP goes forwards and backwards
from this time interval to smooth out the safety stocks in the othertime intervals using the profiles below.
MSC: Maximum Percentage variation in safety stockvalues - This gives maximum allowed deviation. Any
percentage deviation in safety stockbetween two consecutive time intervals that is more than this absolute value
is not permitted. If the actual deviation is more than this value, then this value is used as a "cap" and safety stock
value is reset based on this cap
MSC: Minimum Percentage variation in safety stock values - Minimum deviation that is considered significant
enough.Any percentage deviation in safety stock between two consecutive time intervals that is less than this
value is regarded as not significant enough to be considered by planning. In cases such as this ASCP keep the
safety stock value the same between the two time intervals.
The way to calculate deviation percentage on the left of peak is different from that used on the right. However
this may change in a future release subject to the Enhancement Request Bug 3450590.
1. On the left of the peak
On date Dm quantity is Qm
On date D(m+1) quantity is Q(m+1)
Where Dm < Dpeak
Deviation percentage = |Q(m+1) - Qm| / Q(m+1)
i.e. the later bucket is the reference bucket and quantity from the later bucket is used in denominator.
2. On the right of the peak
On date Dn quantity is Qn
On date D(n+1) quantity is Q(n+1)
Where Dn > Dpeak
Deviation percentage = |Q(n+1) - Qn| / Qn
i.e. the earlier bucket is the reference bucket and quantity from the earlier bucket is used in denominator.
Continuing in the same example with
MSC: Maximum Percentage variation in safety stockvalues = 50
MSC: Minimum Percentage variation in safety stock values = 15
3. ----------------------------------------------------------
Date 1-M 2-Tu 3-W 4-Th 5-F 6-Sa 7-Su 8-M 9-Tu 10-W
---- ---- ---- ---- ---- ---- ---- ---- ---- ----
Demands 5 15 5 35 30 20 20 10
SS-step1 36 42 44 46 32 20 12 4
SS-step2 39 39 45 45 26 26 8 8
Deviation --13%-- -------42%------- --69%--
SS-step3 45 45 45 45 26 26 13 13
----------------------------------------------------------
Second time interval is identified as peak.
First time interval - Deviation of 13% is ignored and SS is copied from second time interval.
Third time interval - Deviation of 42% is within the minimum and maximum and hence value is
retained.
Fourth time interval - Deviation of 69% is truncated to the maximum allowed deviation, i.e. 50%
Step 4 - How to Figure Out Constrained Plan Safety Stock
Because demands can be shifted by an ECC constrained plan when viewing the output,it is difficult to
determine if the safety stockcalculation is correct. With the help of Bug 12381899 we're in a better position to
help figure out the safety stockfor these types of constrained plans.We're going to discuss safety stock
calculation with the MRP Planned % but not including either of the smoothing scenarios previously discussed.
Example data setup:
Item = JMake
Item Id = 123
Org = M1
Org_id = 456
MRP Planned % = 10 (ie 10%)
Bucket Days = 2
ASCP Plan Name = JMECC and is run with anchor date 12-APR-2011
Plan ID = 22
Note: Assume profile option MSC: Use Safety Lead Time = No (we'll talk about this later and how it
affects the calculation)
Using the earlier discussion in this note, users cannot match the value for safety stockgenerated by ASCP in any
of the buckets. However we can get the unconstrained sumof demands to calculate the safety stock for 12-
APR-2011 (remember safety stock bucket days = 2 for the example) which is the first day of the bucket to
calculate by running the following sql (Please Note we are using our example data inputs above in this sql
and your data/dates will be different):
select sum(using_requirement_quantity)
from msc_demands where plan_id = 22
and demand_id in
(select distinct demand_id
from msc_full_pegging
where plan_id = 22
and inventory_item_id = 123
and organization_id = 456
and demand_date >= to_date('2011/04/12', 'yyyy/mm/dd')
and demand_date <= to_date('2011/04/13', 'yyyy/mm/dd'));
Inputs for the above:
plan_id in two places
inventory_item_id
organization_id
4. to_date values - you have to change these as needed based on the bucket days and which bucket date you're
calculating
The above will return the sum of the demands for the two days bucket for the item/org/plan. Let's say the output
= 782730. You then perform your normal safety stockcalculation with formula from earlier:
Safety Stock (Day X) =
Sum of all demands for that Item for "Bucket Days" number of working days from Day X * Percent /
(100*Bucket Days)
Sum of demands for two days = 782730
Percent = 10
Bucket Days = 2
(782730 x 10) / (100 x 2) = 39136.5 rounded up is 39137 which should be the calculation for the first daily
bucket 12-APR-2011
If profile MSC: Use Safety Lead Time = Yes - This profile option is used to tell whether to use safety lead-
time planning (when set to Yes) or non-transient / transient safety stockplanning (when set to No). The
calculation is only slightly different
For example, safety stockbucket days is still 2 days. To calculate the safety stock on day 1 (12-APR-2011), we
use the total demands on day 2 (13-APR-2011) and day 3 (14-APR-2011). Note we're not looking at the
demands for day 1 (12-APR-2011) at all. We'll still use the same sql as we used before but we have to change
the to_dates as follows:
select sum(using_requirement_quantity)
from msc_demands where plan_id = 22
and demand_id in
(select distinct demand_id
from msc_full_pegging
where plan_id = 22
and inventory_item_id = 123
and organization_id = 456
and demand_date >= to_date('2011/04/13', 'yyyy/mm/dd')
and demand_date <= to_date('2011/04/14', 'yyyy/mm/dd'));
The only difference in the above vs the other sql are the to_dates. You still calculate the safety stock with the
output the same way as we did earlier although the sum value returned by the sql obviously could be different.