SlideShare a Scribd company logo
1 of 8
Download to read offline
P a g e 1 | 8
DESCRIPTION OF THE TOPIC
Items Description of the Topic
Course Data Analysis for Social Science Teachers
Topic What is data? Types of Measurement
Module Id 1.2
1. What is Measurement?
Measurement refers to attaching numbers or labels to objects or events.
We know how to measure heights and weights of individuals. We measure height in, say,
centimeters and weight in kilograms.
The following table contains Statistical data of weights for a class of 60 students:
Individual Height (cms)
1 170
2 168
3 172
-
-
60 176
This table presents the data relating to the Heights of a Finance class of 30 students:
Individual Weight (kg)
1 75
2 71
3 82
-
-
30 78
Through measurement, we can generate data. Data is a collection of measurements. Data is
analyzed to yield some insights.
We may describe the central tendency of the heights and weight data using mean, median and
mode. We can also describe the variability in the data using Range, Mean Deviation, Quartile
Deviation and Standard Deviation. We may also use such tools as skewness and kurtosis to
P a g e 2 | 8
describe the shape of the distribution. However, the choice of a particular measure of central
tendency depends on the way we measure the data.
Similarly, when we are trying to describe the relationship between two variables, the choice of the
statistical technique depends on the way the two variables have been measured.
Can we measure anything easily?
When we try to measure something, we realize that it is far easier to measure certain things
compared to the other.
Taking physical measurements like Height, Weight, Blood Pressure, and Blood Sugar is much
easier than measuring the constructs such as Attitude, Motivation, Honesty, and Punctuality.
Just as we use a measurement tape to measure height and a weighing machine to measure the
weight, we need some instrument, popularly known as scale, to measure the constructs such as
attitude, motivation, honesty, etc.
Before we understand how a scale is developed to measure constructs like attitude, motivation,
honesty, etc., let us devote some time to understand different levels at which something can be
measured.
Different Ways (Levels) of Measuring a Construct
We can measure a particular thing in different ways (or at different levels).
Let us say, we are trying to measure the age of our respondents in a survey. we may measure the
age in the following ways (or levels):
a) We may just categorize the respondents into three groups: Young, Middle Age, and Old
Age;
b) We may categorize the respondents into certain age intervals: Below 30, 31 to 60, 61 to 90,
91 and above;and
c) We might also record everyone’s age in the completed years/completed months/completed
days, etc.
2. Levels of Measurement
Broadly there are four levels or scales of measurement: Nominal, Ordinal, Interval and Ratio.
Before we proceed to understand different levels or scales of measurement, let us reemphasize
the choice of statistical tools to analyze the data is primarily dependent on the way the
underlying construct/variables were measured.
P a g e 3 | 8
2.1 Nominal Scale
When we measure something using a nominal scale, we use numbers as just labels or identifiers.
For example, each player in a cricket team is labeled with a number (printed on their jersey) to
easily identify them when they are playing. These numbers are just labels and do not make any
difference even when we interchange the numbers given to two players. Further, we may not assign
consecutive numbers to players. Even when they are assigned consecutive numbers, say, 1 to 11,
the order will not have any meaning.
I used to watch Indian Cricket from 2001 to 2010. I remember Rahul Dravid wearing a jersey
numbered 5 and Sachin Tendulkar wearing a jercy numbered 10. Did these numbers have any
significance? Can it be said that Tendulkar was twice efficient as Dravid? For that matter Ganguly
used to wear a jersey numbered 1. Can it be said that Tendulkar was ten times better than Ganguly?
Further, we can also assign alphabets like A, B, C, D instead of 1,2,3,4. It too does the same
purpose. Now we realize that when we are measuring something using a nominal scale, we are just
assigning labels, or we are categorizing the subjects into predefined bins.
Let us take another example. A market research firm wanted to do a survey of brand loyalty. Let
us say this survey in three cities, namely, Hyderabad, Delhi, and Mumbai and we are interested in
the city of origin of our respondents. When we try to measure the city of or origin of respondents,
we simply pick a respondent, note him/her and put him/her in one of the bins of Hyderabad, Delhi,
and Mumbai.
Gender, color preference, nationality, personality type, native state are some of the examples of
variables that are generally measured on a nominal scale
Now let us turn to the Ordinal Scale.
2.2 Ordinal scale
When we measure something using an ordinal scale, again we attach labels to the
objects/respondents. However here the labels can be arranged in an order. Consider the example
of the designations of teachers in a university: Assistant Professors, Associate Professors, and
Professors. These are just labels. While we pick a teacher, we will be able to categorize him/her
into one of the three bins. However, these labels have some order. When organized from the lowest
to the highest, we will get the order starting with Assistant Professor, Associate Professor, and
then Professor. Similarly the designations in police or military organizations are on an ordinal
scale. These designations have some order.
Sometimes we also assign numbers as labels. Think of ranks of students in the NEET examination.
The label 1st
rank is assigned to the student who has scored the highest marks; the next highest
scorer gets the label 2nd
rank and the next, the third rank and so on.
P a g e 4 | 8
The ordinal scale measurement is one step better than the nominal scale measurement in that the
labels assigned can be arranged in an order. However, we notice that the distance between two
consecutive labels may not be the same.
Let us get back to the example of the NEET examination. The differences between 1st
rank holder
and the 2nd
rank holder may not be the same and the same is true between the 2nd
rank holder and
3rd
rank holder. Let us say the first three rankers have scored the 98, 96, and 92 respectively. The
distance between 1st
and 2nd
ranker is 2 marks, whereas the distance between 2nd
rank and 3rd
rank
holder is 4 marks.
Individual Rank Marks
A 1 98
B 2 96
C 3 92
2.3 Interval Scale
An ordinal scale wherein the interval between any two consecutive data points is the same can be
termed as an interval scale. That means in an interval scale, the data points are ordered and the
distance between any two consecutive data points is the same. The popular example of interval
scale is temperature. We know the difference between 10 degree Celsius and 11 degree Celsius is
same as 18 degree Celsius and 19 degree Celsius. Similarly, the difference between any two
consecutive points on a Fahrenheit scale is also the same. The intervals are same.
However, we cannot say 20 degree Celsius is twice as much as 10 degree Celsius. This is not
possible because we do not have any absolute zero on a Celsius scale. The Celsius scale was
developed noting the freezing point of water as 0-Degree celsius; and boiling point of water as 100
degree Celsius and dividing the distance into 100 equal parts. That’s why the Celsius scale was
originally called the centigrade scale; that is ‘cent’ means 100. On the contrary, on a Fahrenheit
scale, the distance between the freezing point of water and boiling point of water is divided into
180 equal parts. The freezing point on Fahrenheit scale is noted as 32 degrees Fahrenheit and the
boiling point is 212 degrees Fahrenheit. The distance is divided into 180 equal parts (212-32=180).
However, on both the scales, the zero is arbitrary. In fact, the original centigrade scale has 0 as the
boiling point and 100 as the freezing point, that means it is running in the opposite direction. 100
degree Celsius then would have meant very cool.
As there is no absolute zero, the ratios of numbers on an interval scale are not meaningful. That’s
the reason why we can say that 20-degree celsius is not twice as 10-degree celsius.
Now, let us examine in detail why the ratios are not meaningful on an interval scale.
P a g e 5 | 8
We know the equation to convert Celsius to Fahrenheit, i.e
F= 32+1.8C
Let us look at the following data on two scales.
Celsius
Scale
Fahrenheit
Scale
Freezing Point of Water 0 32
10 50
20 68
Boiling Point of Water 100 212
The ratio of 20/10 on the Celsius Scale is:
20
10
= 2,
whereas the ratio of equivalent data points on the Fahrenheit scale is:
68
50
=1.36.
Incompatibility between the Ratios
We can take another example of an interval scale as a time of the day. We have a 12-hour scale
and 24-hour scale
12-hour scale 2pm 3pm 4pm 5pm 6pm 7pm 8pm
24-hour scale 14 15 16 17 18 19 20
On the 12-hour scale, the difference between 4pm and 2pm is: 2 hours
Also
On the 24 hour scale, the difference between 16 and 14 is: 2 hours
However, the ratios are not equal
4
2
= 2 and
16
14
= 1.14
The reason why the ratios are not meaningful in an interval scale is because of the absence of a
natural or absolute zero.
The zero on an interval scale is just another point and is arbitrary. The freezing point of water is
fixed at zero degree centigrade. We have already noted in the original scale that the zero is boiling
point of water. Similarly, midnight 12 am is fixed at 0 hours. It is arbitrary too.
P a g e 6 | 8
2.4 Ratio Scale
The interval scale wherein the ratios are equal is called a ratio scale. Measurement of height,
weight, distance, etc., are examples of a ratio scale. The other examples include sales, profits,
costs, etc.
Lets us take the measurement of distance.
Meters Kilometers
0 0
1000 1
2000 2
3000 3
The intervals between any two consecutive points on both the scales are the same:
3km-2km=2km-1km=1km
2000meters-1999 meters=1999meters-1998meters= 1mtr
At the same time the ratios are also equal.
However, the ratios are not equal:
3000 𝑚𝑒𝑡𝑒𝑟𝑠
2000 𝑚𝑒𝑡𝑒𝑟𝑠
= 1.5 and
3 𝑘𝑚
2 𝑘𝑚
= 1.5
In the same way the ratios of sales, profits and costs are also meaningful. In a ratio scale the ratios
are meaningful for there exists an absolute zero. In comparison the interval scale will have an
arbitrary zero
3. Level of Measurement and Choice of Statistical Measures
When the data is on a ratio scale, we can compute all three measures of central tendency -- Mean,
Median and Mode -- and all measures of variance. However, in case of the data on nominal scale,
we can use only one measure of central tendency, i.e. mode.
The following table presents the summary of the choice of measures of central tendency and
variance for different levels of measurement:
Leave of Measurement Choice of Measures of Central
Tendency
Choice of Measures of
Spread/Variance
Nominal Mode only None
Ordinal Mode & Median Inter Quartile Range(IQR)
Interval Mode, Median & Mean IQR, Range, Variance and
Standard Deviation
Ratio Mode, Median & Mean IQR, Range, Variance and
Standard Deviation
P a g e 7 | 8
What Level of Measurement is desirable?
Where possible it is always desirable to measure by the ratio scale. Because the ratio scale data
allows the application of many statistical tools on it.
4. Different Types of Data
Univariate Data is data that concerns only one variable. The data concerning the heights of a
Finance class of 30 students presented in the following table is an example of Univariate Data
Individual Weight (kg)
1 75
2 71
3 82
-
-
30 78
Bivariate Data is data concerning only two variables. Continuing with our earlier example, if we
add the weight of each student along with his/her height, it will be a bivariate data.
Individual Weight (kg) Height(cms)
1 75 172
2 71 169
3 82 174
-
-
30 78 176
Multivariate Data is data concerning more than two variables.
Individual Weight (kgs) Height(cms) Marks in a
Exam(max 100)
Gender
1 75 172 80 Male
2 71 169 75 Male
3 82 174 82 Female
-
-
30 78 176 69 Male
P a g e 8 | 8
Categorical Data
The data measured on Numerical or Ordinal Scale is generally referred to as Categorical Data.
Categorical data is also referred to as Non-parametric data.
Numerical Data
The data measured on Interval or Ratio Scale is generally referred to as Numerical Data. The words
Numerical Data, Metric Data, Continuous Data, Parametric Data are generally used
interchangeably.

More Related Content

What's hot

What's hot (7)

Module 4 Temperature
Module 4   TemperatureModule 4   Temperature
Module 4 Temperature
 
9th Physics Short Questions ( English Medium)
9th Physics   Short Questions ( English Medium) 9th Physics   Short Questions ( English Medium)
9th Physics Short Questions ( English Medium)
 
Accuracy & uncertainty
Accuracy & uncertaintyAccuracy & uncertainty
Accuracy & uncertainty
 
Scientific measurement
Scientific measurementScientific measurement
Scientific measurement
 
Ch1 z5e chem fnd
Ch1 z5e chem fndCh1 z5e chem fnd
Ch1 z5e chem fnd
 
Physics 1
Physics 1Physics 1
Physics 1
 
AP Physics 1 - Introduction
AP Physics 1 - IntroductionAP Physics 1 - Introduction
AP Physics 1 - Introduction
 

Similar to What is data, types of measurement

Measurement in research
Measurement in researchMeasurement in research
Measurement in researchBikram Pradhan
 
Measurement scales
Measurement scalesMeasurement scales
Measurement scalesUsra Hasan
 
1591683157-scales-of-measurement (1).ppt
1591683157-scales-of-measurement (1).ppt1591683157-scales-of-measurement (1).ppt
1591683157-scales-of-measurement (1).pptmuhammadshoaib287341
 
Data And Variable In Scientific Research
Data And Variable In Scientific ResearchData And Variable In Scientific Research
Data And Variable In Scientific ResearchAswin Sarath
 
Scaling and Measurement techniques
Scaling and Measurement techniquesScaling and Measurement techniques
Scaling and Measurement techniquesJignesh Kariya
 
Aed1222 lesson 2
Aed1222 lesson 2Aed1222 lesson 2
Aed1222 lesson 2nurun2010
 
Measurement and scaling
Measurement and scalingMeasurement and scaling
Measurement and scalingBalaji P
 
Level of measurement
Level of measurementLevel of measurement
Level of measurementSubodh Khanal
 
Chemistry Unit 1 PPT 2
Chemistry Unit 1 PPT 2Chemistry Unit 1 PPT 2
Chemistry Unit 1 PPT 2jk_redmond
 
07 Mesurement and Scaling.pptx
07 Mesurement and Scaling.pptx07 Mesurement and Scaling.pptx
07 Mesurement and Scaling.pptxMesfinMelese4
 
Measurement & scaling ,Research methodology
    Measurement & scaling ,Research methodology    Measurement & scaling ,Research methodology
Measurement & scaling ,Research methodologySONA SEBASTIAN
 
Frequency Measures for Healthcare Professioanls
Frequency Measures for Healthcare ProfessioanlsFrequency Measures for Healthcare Professioanls
Frequency Measures for Healthcare Professioanlsalberpaules
 

Similar to What is data, types of measurement (20)

Measurementand scaling-10
Measurementand scaling-10Measurementand scaling-10
Measurementand scaling-10
 
Measurement in research
Measurement in researchMeasurement in research
Measurement in research
 
Measurement scales
Measurement scalesMeasurement scales
Measurement scales
 
1591683157-scales-of-measurement (1).ppt
1591683157-scales-of-measurement (1).ppt1591683157-scales-of-measurement (1).ppt
1591683157-scales-of-measurement (1).ppt
 
2016 ANALISIS STATISTIK.ppt
2016 ANALISIS STATISTIK.ppt2016 ANALISIS STATISTIK.ppt
2016 ANALISIS STATISTIK.ppt
 
EXPLAIN SPSS-part1.pdf
EXPLAIN SPSS-part1.pdfEXPLAIN SPSS-part1.pdf
EXPLAIN SPSS-part1.pdf
 
Data And Variable In Scientific Research
Data And Variable In Scientific ResearchData And Variable In Scientific Research
Data And Variable In Scientific Research
 
Statistics(Basic)
Statistics(Basic)Statistics(Basic)
Statistics(Basic)
 
Scaling and Measurement techniques
Scaling and Measurement techniquesScaling and Measurement techniques
Scaling and Measurement techniques
 
Aed1222 lesson 2
Aed1222 lesson 2Aed1222 lesson 2
Aed1222 lesson 2
 
Types of Data, Key Concept
Types of Data, Key ConceptTypes of Data, Key Concept
Types of Data, Key Concept
 
Measurment scales
Measurment scalesMeasurment scales
Measurment scales
 
Measurement and scaling
Measurement and scalingMeasurement and scaling
Measurement and scaling
 
Level of measurement
Level of measurementLevel of measurement
Level of measurement
 
Measurement and scale
Measurement and scale Measurement and scale
Measurement and scale
 
Chemistry Unit 1 PPT 2
Chemistry Unit 1 PPT 2Chemistry Unit 1 PPT 2
Chemistry Unit 1 PPT 2
 
07 Mesurement and Scaling.pptx
07 Mesurement and Scaling.pptx07 Mesurement and Scaling.pptx
07 Mesurement and Scaling.pptx
 
Libro en ingles
Libro en inglesLibro en ingles
Libro en ingles
 
Measurement & scaling ,Research methodology
    Measurement & scaling ,Research methodology    Measurement & scaling ,Research methodology
Measurement & scaling ,Research methodology
 
Frequency Measures for Healthcare Professioanls
Frequency Measures for Healthcare ProfessioanlsFrequency Measures for Healthcare Professioanls
Frequency Measures for Healthcare Professioanls
 

More from RajaKrishnan M

Shortcomings of Demat Account
Shortcomings of Demat AccountShortcomings of Demat Account
Shortcomings of Demat AccountRajaKrishnan M
 
Demat Account Services
Demat Account ServicesDemat Account Services
Demat Account ServicesRajaKrishnan M
 
Depository Participant
Depository ParticipantDepository Participant
Depository ParticipantRajaKrishnan M
 
Services provided in Mobile Banking
Services provided in Mobile BankingServices provided in Mobile Banking
Services provided in Mobile BankingRajaKrishnan M
 
Factors affecting share price
Factors affecting share priceFactors affecting share price
Factors affecting share priceRajaKrishnan M
 
Loss of Confidence of small investors
Loss of Confidence of small investorsLoss of Confidence of small investors
Loss of Confidence of small investorsRajaKrishnan M
 
Technological forces fueling e-commerce
Technological forces fueling e-commerceTechnological forces fueling e-commerce
Technological forces fueling e-commerceRajaKrishnan M
 
Encryption and Decryption
Encryption and DecryptionEncryption and Decryption
Encryption and DecryptionRajaKrishnan M
 
Meaning, Anatomy and Forces Fueling e-commerce
Meaning, Anatomy and Forces Fueling e-commerceMeaning, Anatomy and Forces Fueling e-commerce
Meaning, Anatomy and Forces Fueling e-commerceRajaKrishnan M
 
Forces Fueling e-commerce
Forces Fueling e-commerceForces Fueling e-commerce
Forces Fueling e-commerceRajaKrishnan M
 
Inter Organizational e-commerce
Inter Organizational e-commerceInter Organizational e-commerce
Inter Organizational e-commerceRajaKrishnan M
 
Factors for the success of m-commerce
Factors for the success of m-commerceFactors for the success of m-commerce
Factors for the success of m-commerceRajaKrishnan M
 
Advantages of E-Commerce
Advantages of E-CommerceAdvantages of E-Commerce
Advantages of E-CommerceRajaKrishnan M
 
E-Commerce and E- Businesss
E-Commerce and E- BusinesssE-Commerce and E- Businesss
E-Commerce and E- BusinesssRajaKrishnan M
 
Electronic Data Interchange & Internet
Electronic Data Interchange & InternetElectronic Data Interchange & Internet
Electronic Data Interchange & InternetRajaKrishnan M
 

More from RajaKrishnan M (20)

Shortcomings of Demat Account
Shortcomings of Demat AccountShortcomings of Demat Account
Shortcomings of Demat Account
 
Demat Account Services
Demat Account ServicesDemat Account Services
Demat Account Services
 
Depository Participant
Depository ParticipantDepository Participant
Depository Participant
 
Services provided in Mobile Banking
Services provided in Mobile BankingServices provided in Mobile Banking
Services provided in Mobile Banking
 
Ombudsman scheme
Ombudsman scheme Ombudsman scheme
Ombudsman scheme
 
Factors affecting share price
Factors affecting share priceFactors affecting share price
Factors affecting share price
 
Rights of investors
Rights of investorsRights of investors
Rights of investors
 
Loss of Confidence of small investors
Loss of Confidence of small investorsLoss of Confidence of small investors
Loss of Confidence of small investors
 
Facilities by BSE
Facilities by BSEFacilities by BSE
Facilities by BSE
 
Technological forces fueling e-commerce
Technological forces fueling e-commerceTechnological forces fueling e-commerce
Technological forces fueling e-commerce
 
Encryption and Decryption
Encryption and DecryptionEncryption and Decryption
Encryption and Decryption
 
Meaning, Anatomy and Forces Fueling e-commerce
Meaning, Anatomy and Forces Fueling e-commerceMeaning, Anatomy and Forces Fueling e-commerce
Meaning, Anatomy and Forces Fueling e-commerce
 
Forces Fueling e-commerce
Forces Fueling e-commerceForces Fueling e-commerce
Forces Fueling e-commerce
 
Inter Organizational e-commerce
Inter Organizational e-commerceInter Organizational e-commerce
Inter Organizational e-commerce
 
Factors for the success of m-commerce
Factors for the success of m-commerceFactors for the success of m-commerce
Factors for the success of m-commerce
 
Advantages of E-Commerce
Advantages of E-CommerceAdvantages of E-Commerce
Advantages of E-Commerce
 
Types of E-Commerce
Types of E-CommerceTypes of E-Commerce
Types of E-Commerce
 
E-Commerce and E- Businesss
E-Commerce and E- BusinesssE-Commerce and E- Businesss
E-Commerce and E- Businesss
 
RFID
RFIDRFID
RFID
 
Electronic Data Interchange & Internet
Electronic Data Interchange & InternetElectronic Data Interchange & Internet
Electronic Data Interchange & Internet
 

Recently uploaded

The Most Excellent Way | 1 Corinthians 13
The Most Excellent Way | 1 Corinthians 13The Most Excellent Way | 1 Corinthians 13
The Most Excellent Way | 1 Corinthians 13Steve Thomason
 
General AI for Medical Educators April 2024
General AI for Medical Educators April 2024General AI for Medical Educators April 2024
General AI for Medical Educators April 2024Janet Corral
 
A Critique of the Proposed National Education Policy Reform
A Critique of the Proposed National Education Policy ReformA Critique of the Proposed National Education Policy Reform
A Critique of the Proposed National Education Policy ReformChameera Dedduwage
 
Student login on Anyboli platform.helpin
Student login on Anyboli platform.helpinStudent login on Anyboli platform.helpin
Student login on Anyboli platform.helpinRaunakKeshri1
 
Advanced Views - Calendar View in Odoo 17
Advanced Views - Calendar View in Odoo 17Advanced Views - Calendar View in Odoo 17
Advanced Views - Calendar View in Odoo 17Celine George
 
Arihant handbook biology for class 11 .pdf
Arihant handbook biology for class 11 .pdfArihant handbook biology for class 11 .pdf
Arihant handbook biology for class 11 .pdfchloefrazer622
 
Class 11th Physics NEET formula sheet pdf
Class 11th Physics NEET formula sheet pdfClass 11th Physics NEET formula sheet pdf
Class 11th Physics NEET formula sheet pdfAyushMahapatra5
 
Sanyam Choudhary Chemistry practical.pdf
Sanyam Choudhary Chemistry practical.pdfSanyam Choudhary Chemistry practical.pdf
Sanyam Choudhary Chemistry practical.pdfsanyamsingh5019
 
Measures of Central Tendency: Mean, Median and Mode
Measures of Central Tendency: Mean, Median and ModeMeasures of Central Tendency: Mean, Median and Mode
Measures of Central Tendency: Mean, Median and ModeThiyagu K
 
Z Score,T Score, Percential Rank and Box Plot Graph
Z Score,T Score, Percential Rank and Box Plot GraphZ Score,T Score, Percential Rank and Box Plot Graph
Z Score,T Score, Percential Rank and Box Plot GraphThiyagu K
 
Holdier Curriculum Vitae (April 2024).pdf
Holdier Curriculum Vitae (April 2024).pdfHoldier Curriculum Vitae (April 2024).pdf
Holdier Curriculum Vitae (April 2024).pdfagholdier
 
Grant Readiness 101 TechSoup and Remy Consulting
Grant Readiness 101 TechSoup and Remy ConsultingGrant Readiness 101 TechSoup and Remy Consulting
Grant Readiness 101 TechSoup and Remy ConsultingTechSoup
 
The basics of sentences session 2pptx copy.pptx
The basics of sentences session 2pptx copy.pptxThe basics of sentences session 2pptx copy.pptx
The basics of sentences session 2pptx copy.pptxheathfieldcps1
 
Unit-IV- Pharma. Marketing Channels.pptx
Unit-IV- Pharma. Marketing Channels.pptxUnit-IV- Pharma. Marketing Channels.pptx
Unit-IV- Pharma. Marketing Channels.pptxVishalSingh1417
 
Kisan Call Centre - To harness potential of ICT in Agriculture by answer farm...
Kisan Call Centre - To harness potential of ICT in Agriculture by answer farm...Kisan Call Centre - To harness potential of ICT in Agriculture by answer farm...
Kisan Call Centre - To harness potential of ICT in Agriculture by answer farm...Krashi Coaching
 
Software Engineering Methodologies (overview)
Software Engineering Methodologies (overview)Software Engineering Methodologies (overview)
Software Engineering Methodologies (overview)eniolaolutunde
 
Ecosystem Interactions Class Discussion Presentation in Blue Green Lined Styl...
Ecosystem Interactions Class Discussion Presentation in Blue Green Lined Styl...Ecosystem Interactions Class Discussion Presentation in Blue Green Lined Styl...
Ecosystem Interactions Class Discussion Presentation in Blue Green Lined Styl...fonyou31
 
Q4-W6-Restating Informational Text Grade 3
Q4-W6-Restating Informational Text Grade 3Q4-W6-Restating Informational Text Grade 3
Q4-W6-Restating Informational Text Grade 3JemimahLaneBuaron
 

Recently uploaded (20)

The Most Excellent Way | 1 Corinthians 13
The Most Excellent Way | 1 Corinthians 13The Most Excellent Way | 1 Corinthians 13
The Most Excellent Way | 1 Corinthians 13
 
General AI for Medical Educators April 2024
General AI for Medical Educators April 2024General AI for Medical Educators April 2024
General AI for Medical Educators April 2024
 
A Critique of the Proposed National Education Policy Reform
A Critique of the Proposed National Education Policy ReformA Critique of the Proposed National Education Policy Reform
A Critique of the Proposed National Education Policy Reform
 
Student login on Anyboli platform.helpin
Student login on Anyboli platform.helpinStudent login on Anyboli platform.helpin
Student login on Anyboli platform.helpin
 
Advanced Views - Calendar View in Odoo 17
Advanced Views - Calendar View in Odoo 17Advanced Views - Calendar View in Odoo 17
Advanced Views - Calendar View in Odoo 17
 
Arihant handbook biology for class 11 .pdf
Arihant handbook biology for class 11 .pdfArihant handbook biology for class 11 .pdf
Arihant handbook biology for class 11 .pdf
 
INDIA QUIZ 2024 RLAC DELHI UNIVERSITY.pptx
INDIA QUIZ 2024 RLAC DELHI UNIVERSITY.pptxINDIA QUIZ 2024 RLAC DELHI UNIVERSITY.pptx
INDIA QUIZ 2024 RLAC DELHI UNIVERSITY.pptx
 
Class 11th Physics NEET formula sheet pdf
Class 11th Physics NEET formula sheet pdfClass 11th Physics NEET formula sheet pdf
Class 11th Physics NEET formula sheet pdf
 
Sanyam Choudhary Chemistry practical.pdf
Sanyam Choudhary Chemistry practical.pdfSanyam Choudhary Chemistry practical.pdf
Sanyam Choudhary Chemistry practical.pdf
 
Measures of Central Tendency: Mean, Median and Mode
Measures of Central Tendency: Mean, Median and ModeMeasures of Central Tendency: Mean, Median and Mode
Measures of Central Tendency: Mean, Median and Mode
 
Z Score,T Score, Percential Rank and Box Plot Graph
Z Score,T Score, Percential Rank and Box Plot GraphZ Score,T Score, Percential Rank and Box Plot Graph
Z Score,T Score, Percential Rank and Box Plot Graph
 
Código Creativo y Arte de Software | Unidad 1
Código Creativo y Arte de Software | Unidad 1Código Creativo y Arte de Software | Unidad 1
Código Creativo y Arte de Software | Unidad 1
 
Holdier Curriculum Vitae (April 2024).pdf
Holdier Curriculum Vitae (April 2024).pdfHoldier Curriculum Vitae (April 2024).pdf
Holdier Curriculum Vitae (April 2024).pdf
 
Grant Readiness 101 TechSoup and Remy Consulting
Grant Readiness 101 TechSoup and Remy ConsultingGrant Readiness 101 TechSoup and Remy Consulting
Grant Readiness 101 TechSoup and Remy Consulting
 
The basics of sentences session 2pptx copy.pptx
The basics of sentences session 2pptx copy.pptxThe basics of sentences session 2pptx copy.pptx
The basics of sentences session 2pptx copy.pptx
 
Unit-IV- Pharma. Marketing Channels.pptx
Unit-IV- Pharma. Marketing Channels.pptxUnit-IV- Pharma. Marketing Channels.pptx
Unit-IV- Pharma. Marketing Channels.pptx
 
Kisan Call Centre - To harness potential of ICT in Agriculture by answer farm...
Kisan Call Centre - To harness potential of ICT in Agriculture by answer farm...Kisan Call Centre - To harness potential of ICT in Agriculture by answer farm...
Kisan Call Centre - To harness potential of ICT in Agriculture by answer farm...
 
Software Engineering Methodologies (overview)
Software Engineering Methodologies (overview)Software Engineering Methodologies (overview)
Software Engineering Methodologies (overview)
 
Ecosystem Interactions Class Discussion Presentation in Blue Green Lined Styl...
Ecosystem Interactions Class Discussion Presentation in Blue Green Lined Styl...Ecosystem Interactions Class Discussion Presentation in Blue Green Lined Styl...
Ecosystem Interactions Class Discussion Presentation in Blue Green Lined Styl...
 
Q4-W6-Restating Informational Text Grade 3
Q4-W6-Restating Informational Text Grade 3Q4-W6-Restating Informational Text Grade 3
Q4-W6-Restating Informational Text Grade 3
 

What is data, types of measurement

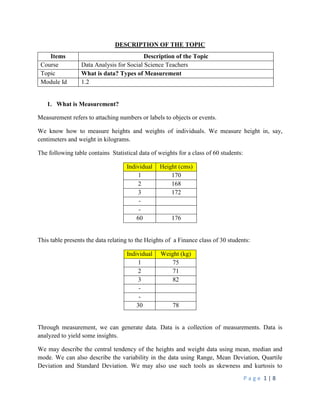
  • 1. P a g e 1 | 8 DESCRIPTION OF THE TOPIC Items Description of the Topic Course Data Analysis for Social Science Teachers Topic What is data? Types of Measurement Module Id 1.2 1. What is Measurement? Measurement refers to attaching numbers or labels to objects or events. We know how to measure heights and weights of individuals. We measure height in, say, centimeters and weight in kilograms. The following table contains Statistical data of weights for a class of 60 students: Individual Height (cms) 1 170 2 168 3 172 - - 60 176 This table presents the data relating to the Heights of a Finance class of 30 students: Individual Weight (kg) 1 75 2 71 3 82 - - 30 78 Through measurement, we can generate data. Data is a collection of measurements. Data is analyzed to yield some insights. We may describe the central tendency of the heights and weight data using mean, median and mode. We can also describe the variability in the data using Range, Mean Deviation, Quartile Deviation and Standard Deviation. We may also use such tools as skewness and kurtosis to
  • 2. P a g e 2 | 8 describe the shape of the distribution. However, the choice of a particular measure of central tendency depends on the way we measure the data. Similarly, when we are trying to describe the relationship between two variables, the choice of the statistical technique depends on the way the two variables have been measured. Can we measure anything easily? When we try to measure something, we realize that it is far easier to measure certain things compared to the other. Taking physical measurements like Height, Weight, Blood Pressure, and Blood Sugar is much easier than measuring the constructs such as Attitude, Motivation, Honesty, and Punctuality. Just as we use a measurement tape to measure height and a weighing machine to measure the weight, we need some instrument, popularly known as scale, to measure the constructs such as attitude, motivation, honesty, etc. Before we understand how a scale is developed to measure constructs like attitude, motivation, honesty, etc., let us devote some time to understand different levels at which something can be measured. Different Ways (Levels) of Measuring a Construct We can measure a particular thing in different ways (or at different levels). Let us say, we are trying to measure the age of our respondents in a survey. we may measure the age in the following ways (or levels): a) We may just categorize the respondents into three groups: Young, Middle Age, and Old Age; b) We may categorize the respondents into certain age intervals: Below 30, 31 to 60, 61 to 90, 91 and above;and c) We might also record everyone’s age in the completed years/completed months/completed days, etc. 2. Levels of Measurement Broadly there are four levels or scales of measurement: Nominal, Ordinal, Interval and Ratio. Before we proceed to understand different levels or scales of measurement, let us reemphasize the choice of statistical tools to analyze the data is primarily dependent on the way the underlying construct/variables were measured.
  • 3. P a g e 3 | 8 2.1 Nominal Scale When we measure something using a nominal scale, we use numbers as just labels or identifiers. For example, each player in a cricket team is labeled with a number (printed on their jersey) to easily identify them when they are playing. These numbers are just labels and do not make any difference even when we interchange the numbers given to two players. Further, we may not assign consecutive numbers to players. Even when they are assigned consecutive numbers, say, 1 to 11, the order will not have any meaning. I used to watch Indian Cricket from 2001 to 2010. I remember Rahul Dravid wearing a jersey numbered 5 and Sachin Tendulkar wearing a jercy numbered 10. Did these numbers have any significance? Can it be said that Tendulkar was twice efficient as Dravid? For that matter Ganguly used to wear a jersey numbered 1. Can it be said that Tendulkar was ten times better than Ganguly? Further, we can also assign alphabets like A, B, C, D instead of 1,2,3,4. It too does the same purpose. Now we realize that when we are measuring something using a nominal scale, we are just assigning labels, or we are categorizing the subjects into predefined bins. Let us take another example. A market research firm wanted to do a survey of brand loyalty. Let us say this survey in three cities, namely, Hyderabad, Delhi, and Mumbai and we are interested in the city of origin of our respondents. When we try to measure the city of or origin of respondents, we simply pick a respondent, note him/her and put him/her in one of the bins of Hyderabad, Delhi, and Mumbai. Gender, color preference, nationality, personality type, native state are some of the examples of variables that are generally measured on a nominal scale Now let us turn to the Ordinal Scale. 2.2 Ordinal scale When we measure something using an ordinal scale, again we attach labels to the objects/respondents. However here the labels can be arranged in an order. Consider the example of the designations of teachers in a university: Assistant Professors, Associate Professors, and Professors. These are just labels. While we pick a teacher, we will be able to categorize him/her into one of the three bins. However, these labels have some order. When organized from the lowest to the highest, we will get the order starting with Assistant Professor, Associate Professor, and then Professor. Similarly the designations in police or military organizations are on an ordinal scale. These designations have some order. Sometimes we also assign numbers as labels. Think of ranks of students in the NEET examination. The label 1st rank is assigned to the student who has scored the highest marks; the next highest scorer gets the label 2nd rank and the next, the third rank and so on.
  • 4. P a g e 4 | 8 The ordinal scale measurement is one step better than the nominal scale measurement in that the labels assigned can be arranged in an order. However, we notice that the distance between two consecutive labels may not be the same. Let us get back to the example of the NEET examination. The differences between 1st rank holder and the 2nd rank holder may not be the same and the same is true between the 2nd rank holder and 3rd rank holder. Let us say the first three rankers have scored the 98, 96, and 92 respectively. The distance between 1st and 2nd ranker is 2 marks, whereas the distance between 2nd rank and 3rd rank holder is 4 marks. Individual Rank Marks A 1 98 B 2 96 C 3 92 2.3 Interval Scale An ordinal scale wherein the interval between any two consecutive data points is the same can be termed as an interval scale. That means in an interval scale, the data points are ordered and the distance between any two consecutive data points is the same. The popular example of interval scale is temperature. We know the difference between 10 degree Celsius and 11 degree Celsius is same as 18 degree Celsius and 19 degree Celsius. Similarly, the difference between any two consecutive points on a Fahrenheit scale is also the same. The intervals are same. However, we cannot say 20 degree Celsius is twice as much as 10 degree Celsius. This is not possible because we do not have any absolute zero on a Celsius scale. The Celsius scale was developed noting the freezing point of water as 0-Degree celsius; and boiling point of water as 100 degree Celsius and dividing the distance into 100 equal parts. That’s why the Celsius scale was originally called the centigrade scale; that is ‘cent’ means 100. On the contrary, on a Fahrenheit scale, the distance between the freezing point of water and boiling point of water is divided into 180 equal parts. The freezing point on Fahrenheit scale is noted as 32 degrees Fahrenheit and the boiling point is 212 degrees Fahrenheit. The distance is divided into 180 equal parts (212-32=180). However, on both the scales, the zero is arbitrary. In fact, the original centigrade scale has 0 as the boiling point and 100 as the freezing point, that means it is running in the opposite direction. 100 degree Celsius then would have meant very cool. As there is no absolute zero, the ratios of numbers on an interval scale are not meaningful. That’s the reason why we can say that 20-degree celsius is not twice as 10-degree celsius. Now, let us examine in detail why the ratios are not meaningful on an interval scale.
  • 5. P a g e 5 | 8 We know the equation to convert Celsius to Fahrenheit, i.e F= 32+1.8C Let us look at the following data on two scales. Celsius Scale Fahrenheit Scale Freezing Point of Water 0 32 10 50 20 68 Boiling Point of Water 100 212 The ratio of 20/10 on the Celsius Scale is: 20 10 = 2, whereas the ratio of equivalent data points on the Fahrenheit scale is: 68 50 =1.36. Incompatibility between the Ratios We can take another example of an interval scale as a time of the day. We have a 12-hour scale and 24-hour scale 12-hour scale 2pm 3pm 4pm 5pm 6pm 7pm 8pm 24-hour scale 14 15 16 17 18 19 20 On the 12-hour scale, the difference between 4pm and 2pm is: 2 hours Also On the 24 hour scale, the difference between 16 and 14 is: 2 hours However, the ratios are not equal 4 2 = 2 and 16 14 = 1.14 The reason why the ratios are not meaningful in an interval scale is because of the absence of a natural or absolute zero. The zero on an interval scale is just another point and is arbitrary. The freezing point of water is fixed at zero degree centigrade. We have already noted in the original scale that the zero is boiling point of water. Similarly, midnight 12 am is fixed at 0 hours. It is arbitrary too.
  • 6. P a g e 6 | 8 2.4 Ratio Scale The interval scale wherein the ratios are equal is called a ratio scale. Measurement of height, weight, distance, etc., are examples of a ratio scale. The other examples include sales, profits, costs, etc. Lets us take the measurement of distance. Meters Kilometers 0 0 1000 1 2000 2 3000 3 The intervals between any two consecutive points on both the scales are the same: 3km-2km=2km-1km=1km 2000meters-1999 meters=1999meters-1998meters= 1mtr At the same time the ratios are also equal. However, the ratios are not equal: 3000 𝑚𝑒𝑡𝑒𝑟𝑠 2000 𝑚𝑒𝑡𝑒𝑟𝑠 = 1.5 and 3 𝑘𝑚 2 𝑘𝑚 = 1.5 In the same way the ratios of sales, profits and costs are also meaningful. In a ratio scale the ratios are meaningful for there exists an absolute zero. In comparison the interval scale will have an arbitrary zero 3. Level of Measurement and Choice of Statistical Measures When the data is on a ratio scale, we can compute all three measures of central tendency -- Mean, Median and Mode -- and all measures of variance. However, in case of the data on nominal scale, we can use only one measure of central tendency, i.e. mode. The following table presents the summary of the choice of measures of central tendency and variance for different levels of measurement: Leave of Measurement Choice of Measures of Central Tendency Choice of Measures of Spread/Variance Nominal Mode only None Ordinal Mode & Median Inter Quartile Range(IQR) Interval Mode, Median & Mean IQR, Range, Variance and Standard Deviation Ratio Mode, Median & Mean IQR, Range, Variance and Standard Deviation
  • 7. P a g e 7 | 8 What Level of Measurement is desirable? Where possible it is always desirable to measure by the ratio scale. Because the ratio scale data allows the application of many statistical tools on it. 4. Different Types of Data Univariate Data is data that concerns only one variable. The data concerning the heights of a Finance class of 30 students presented in the following table is an example of Univariate Data Individual Weight (kg) 1 75 2 71 3 82 - - 30 78 Bivariate Data is data concerning only two variables. Continuing with our earlier example, if we add the weight of each student along with his/her height, it will be a bivariate data. Individual Weight (kg) Height(cms) 1 75 172 2 71 169 3 82 174 - - 30 78 176 Multivariate Data is data concerning more than two variables. Individual Weight (kgs) Height(cms) Marks in a Exam(max 100) Gender 1 75 172 80 Male 2 71 169 75 Male 3 82 174 82 Female - - 30 78 176 69 Male
  • 8. P a g e 8 | 8 Categorical Data The data measured on Numerical or Ordinal Scale is generally referred to as Categorical Data. Categorical data is also referred to as Non-parametric data. Numerical Data The data measured on Interval or Ratio Scale is generally referred to as Numerical Data. The words Numerical Data, Metric Data, Continuous Data, Parametric Data are generally used interchangeably.