
Recommended
Recommended
More Related Content
What's hot
What's hot (19)
Similar to An Automatic Color Feature Vector Classification Based on Clustering Method
Similar to An Automatic Color Feature Vector Classification Based on Clustering Method (20)
More from RSIS International
More from RSIS International (20)
Recently uploaded
Recently uploaded (20)
An Automatic Color Feature Vector Classification Based on Clustering Method
- 1. International Journal of Research and Scientific Innovation (IJRSI) | Volume IV, Issue IV, April 2017 | ISSN 2321–2705 www.rsisinternational.org Page 13 An Automatic Color Feature Vector Classification Based on Clustering Method T. Balaji Assistant Professor of Computer Science, Govt. Arts College, Melur, India Abstract - In computer vision application, visual features such as shape, color and texture are extracted to characterize images. Each of the features is represented using one or more feature descriptors. One of the important requirements in image retrieval, indexing, classification, clustering, etc. is extracting efficient features from images. The color feature is one of the most widely used visual features. Use of color histogram is the most common way for representing color feature. One of disadvantage of the color histogram is that it does not take the color spatial distribution into consideration. In this paper an automatic color feature vector classification based on clustering approach is presented, which effectively describes the spatial information of color features. The image retrieval results are compare to improved color feature vector show the acceptable efficiency of this approach. It propose an automatic color feature vector classification of satellite images using clustering approach. The intention is to study cluster a set of satellite images in several categories on the color similarity basis. The images are processed using LAB color space in the feature extraction stage. The resulted color-based feature vectors are clustered using an automatic unsupervised classification algorithm. Some experiments based on the proposed recognition technique have also been performed. More research, however, is needed to identify and reduce uncertainties in the image processing chain to improve classification accuracy. The mathematical training and prediction analysis of a general familiarity with satellite classifications meet typical map accuracy standards. Keywords: Feature Extraction, Classification, Clustering and Feature Vector I. INTRODUCTION igital image recognition represents an important computer vision domain. An image recognition process consists of classifying a set of images on the basis of their content similarity. As any pattern recognition task, image recognition is characterized by a feature extraction step and a feature vector classification. The feature extraction consists of an image content analysis. The image content is provided by its color, texture and shape information. Numerous color, texture and shape analysis techniques have been developed in recent years. The image classification process may have a supervised character, using a template image set, or an unsupervised character. It provide an automatic unsupervised image recognition technique. Therefore, we consider the following automatic recognition task. If {I1,…IN} represents the set of color images to be recognized, these digital images have to be clustered automatically in a number of color-based classes. First, to propose an image feature extraction that uses LAB color space characteristics. This featuring process is described in an automatic feature vector clustering technique based on a K-Means algorithm. Color, texture and shape are the most common visually features. These features are independent of specific domain and can use in general systems of retrieval images. The color feature is the first and one of the most widely used visual features in image retrieval and indexing. The most important advantages of color feature are power of representing visual content of images, simple extracting color information of images and high efficiency, relatively power in separating images from each other, relatively robust to background complication and independent of image size and orientation. Image is a different kind of data which includes a huge amount of information, such as color information, objects, edges, pixel definition, dimensions and others. Therefore the treatment of image data is a sensitive concern to preserve the complete information. This paper addresses the various key features and properties of image data by which the information from the image is extracted and utilized for different applications of face recognition, image retrieval and others. Another way is to divide the image into different regions and calculate color features for each region. Dividing image into sub-images (blocks) and extracting useful information from these blocks is a way for improving color histogram and attending to homogenous blocks seems to be effective. A Histogram counts the number of pixels of each kind and can be rapidly created by reading each image pixel just once and incrementing the appropriate bin of the histogram. Color histograms are relatively invariant to translation, rotation about the imaging axis, small off-axis rotation, scale changes and partial occlusion. II. BACKGROUND OF THE STUDY As we know that local features are the image patterns which differ from its immediate neighbourhood. It is usually affected by the change of an image property or several properties simultaneously, although it is not necessary localized exactly on these changes. There are mainly three properties commonly considered as intensity, color, and texture. Local features can be points, but also edges or small image patches. Typically, some measurements are taken from a region centered on a local feature and converted into descriptors. The descriptor scan then is used for various applications. Good features should have the following properties: D
- 2. International Journal of Research and Scientific Innovation (IJRSI) | Volume IV, Issue IV, April 2017 | ISSN 2321–2705 www.rsisinternational.org Page 14 A. Uniqueness / Informativeness The strength patterns underlying the discovered features should show a lot of variation, such that features can be distinguished and matched. B. Repeatability Given two images of the same objector view, taken under different viewing conditions, a high percentage of the features noticed on the scene part observable in both images should be found in both images. C. Vicinity The features should be limited, so as to decrease the probability of occlusion and to permit simple model estimates of the geometric and photometric deformations between two images taken under different viewing circumstances. D. Accurateness The detected features should be accurately localized, in both image location, with respect to scale and possibly shape. E. Effectiveness Preferably, the recognition of features in a new image should allow for time-critical applications. Repeatability, debatably the most significant property of all, can be achieved in two different ways: either by invariance or by robustness. F. Magnitude The number of detected features should be satisfactorily large, such that a sensible number of features are detected even on small objects. However, the optimal number of features depends on the application. Ideally, the number of identified features should be controllable over a large range by a simple and intuitive threshold. The density of features should reflect the information content of the image to provide a compact image representation. G. Robustness In case of relatively small deformations, it often suffices to make feature detection methods less sensitive to such deformations, i.e., the accuracy of the detection may decrease but not drastically. Also geometric and photometric deviations from the mathematical model used to obtain invariance are often overcome by including more robustness. H. Invariance When large deformations are to be projected, the preferred approach is to model these mathematically if possible, and then develop methods for feature detection that are unaffected by these mathematical transformations. III. CLASSIFICATION OVERVIEW Classification is a partitions an image into distinct regions containing each pixel with similar attributes. It is to be meaningful and useful for image analysis and interpretation should strongly relate to depicted objects or features of interest. Meaningful classification is the first step from low- level image processing transforming a grayscale or color image into one or more other remote sensing images to high- level image description in terms of features, objects, and scenes. The success of image analysis depends on reliability of classification, but an accurate partitioning of an image is generally a very challenging problem of remote sensing image applications. Classification techniques are either contextual or non- contextual. There is no account of spatial relationships between features in an image and group pixels together on the basis of some global attribute, e.g. gray level or color. Contextual techniques additionally exploit these relationships, e.g. group together pixels with similar gray levels and close spatial locations.The division of remote sensing image into meaningful structures and image classification is often an essential step in image analysis, object representation, visualization and many other image processing tasks. A great variety of classification methods has been proposed in the past decades and some categorization is necessary to present the methods properly derived. The categorization presented in this paper is therefore rather a categorization regarding the emphasis of an approach than a strict division. IV. CLUSTERING METHOD Clustering is a grouping of data with similar characteristics. This "similarity" in a given set may vary according to data, because clustering is used in various fields such as numerical taxonomy, morphometric, systematic, etc. Thus, a clustering algorithm that fits the numerical measure of optimization in a data may not optimize another set of data (for example, depending on the units selected). There are many algorithms to solve a clustering problem. The algorithms used in the applet concentrate on "joining", "splitting", and "switching" search methods. The clustering method uses a three dimensional model for demonstration purposes. However the algorithms can calculate clusters in n- dimensions. For planning to an algorithm based on principal component analysis, projecting the n-dimensional data on to a three dimensional space. There are many methods of clustering developed for wide variety of purposes. Clustering algorithms used for unsupervised classification of remote sensing data vary according to the efficiency with which clustering takes place. Clustering is divided into hierarchical clustering and non-hierarchical clustering. V. FEATURE EXTRACTION USING LAB COLOR SPACE The characteristics of the LAB color space make it suitable for extracting global color features from a digital satellite image. Therefore it convert the analyzed RGB images into LAB format. The characteristic known as luminance or intensity is represented on the axis named L, that is perpendicular on a pile of “ab” planes, each one containing all the possible colors for a given luminance. One of the most useful characteristic of the LAB color space is that the colors
- 3. International Journal of Research and Scientific Innovation (IJRSI) | Volume IV, Issue IV, April 2017 | ISSN 2321–2705 www.rsisinternational.org Page 15 are uniformly distributed in an “ab” plane, from green to red along the“a” axis and from blue to yellow along the “b” axis shown in figure 1. One color is defined by a point (a1, b1) in an “ab” plane of a given luminance L, and colors are changing gradually and uniformly in the plane around the point. It is important that the human eye perceives this gradual change of color as a uniform one. The values of the coordinates L, a and b are real numbers when applying RGB to LAB mathematical conversion, but, these values are mapped to 256 levels. Fig. 1: Color Distribution in “ab” plane for L=134 A precise color is defined in the LAB color space by a triplet (L,a,b),much like a triplet (R,G,B) defines a color in the RGB color space. However, in LAB the pair (a,b) can be viewed as a pure color and the L coordinate gives only how darker or lighter that color is seen by the human eye. A reduction of the number of colors is needed in order to obtain global characteristics. Therefore, it take into consideration each quadrant of an “ab” plane as an independent subset of colors. It is ok to consider quadrants for a global case of classifying or retrieving images based on their color content. However, for dedicated applications it would be possible to split the “ab” planes in more complicated shapes in order to depict some specific colors. Then the (a,b) pairs are ordered according to the values in the bins, the colors with a greater number of corresponding pixels in the image being on top of the list. Then colors very close in the “ab” planes are merged in this lists, which became a list of fewer colors, but with larger counts of pixels. Finally, the top (a,b) pair is taken as the most important color in the corresponding quadrant. Collecting all the 32 important colors provides us the following feature vector in classification process. Each column matrix represents a winning (ai, bi) color pair. The color contents of two images can be easily compared on the base of the color features extracted as above. It is essential to use the fact that the 32 components of the feature matrix in fact 32 pairs of coordinates designating points in an “ab” plane of the LAB color system. This techniques is used to analyze the Euclidean distance as a metric for color feature vectors. It assures that comparing two color components of two images means comparing the distance between two points in the same “ab” plane and the same quadrant. VI. FEATURE EXTRACTION The feature is defined as a function of one or more measurements, each of which specifies some quantifiable property of an object, and is computed such that it quantifies some significant characteristics of the object. For classify the various features currently employed are as follows: A. General Features Application independent features such as color, texture, and shape. According to the abstraction level, they can be further divided in to the following: Pixel-level Features - Features calculated at each pixel, e.g. color, location. Local Features - Features calculated over the results of subdivision of the image band on image classification or edge detection. Global Features - Features calculated over the entire image or just regular sub-area of an image. Domain Specific Features - Application dependent features such as human faces, fingerprints, and conceptual features. These features are often a synthesis of low-level features for a specific domain. On the other hand, all features can be coarsely classified in to low-level features and high- level features. Low-level features can be extracted directed from the original images, whereas high-level feature extraction must be based on low level features. The feature extraction diagram is shown in the following fig. 2. Fig. 2. Diagram of Feature Extraction processing Based on Clustering Approach B. Color Features The color feature is one of the most widely used visual features in image retrieval. Images characterized by color features have many advantages: Robustness - The color histogram is invariant to rotation of the image on the view axis, and changes in small steps when rotated otherwise or scaled. It is also insensitive to changes in image and histogram resolution and occlusion. Effectiveness - There is high percentage of relevance between the query image and the extracted matching images. Implementation Simplicity - The construction of the color histogram is a straightforward process, including scanning the image, assigning color values to the resolution of the
- 4. International Journal of Research and Scientific Innovation (IJRSI) | Volume IV, Issue IV, April 2017 | ISSN 2321–2705 www.rsisinternational.org Page 16 histogram, and building the histogram using color components as indices. Computational Simplicity - The histogram computation has O(X, Y ) complexity for images of size X × Y . The complexity for a single image match is linear, O(n), where n represents the number of different colors or resolution of the histogram. Low Storage Requirements - The color histogram size is significantly smaller than the image itself, assuming color quantization. Typically, the color of an image is represented through some color model. There exist various color models to describe color information. One representation of color content of the image is by using color histogram. Statistically, it denotes the joint probability of the intensities of the three color channels. A feature vector is then formed by concatenating the three channel histograms into one vector. Color descriptors of images can be global or local and consist of a number of histogram descriptors and color descriptors represented by color moments, color coherence vectors. Color histogram describes the distribution of colors within a whole or within an interest region of image. So, the computational complexity of the co-occurrence matrix depends quadratically on the number of gray-scales used for quantization. Features can be extracted from the co-occurrence matrix to reduce feature space dimensionality and the formal definitions of five features from the co-occurrence matrix are done. VII. PROPOSED AUTOMATIC FEATURE VECTOR CLASSIFICATION APPROACH The normal feature vector classification algorithms used in these systems are commonly divided into three tasks such as extraction, selection and classification. The extraction task transforms rich content of images into various content features. Feature extraction is the process of generating features to be used in the selection and classification tasks. Feature selection reduces the number of features provided to the classification task. Those features which are likely to assist in discrimination are selected and used in the classification task. Of these three activities, feature extraction is most critical because the particular features made available for discrimination directly influence the efficacy of the classification task. The end result of the extraction task is a set of features, commonly called a feature vector, which constitutes a representation of the image. This process can be divided in the following stages: A. Preprocessing The image is first processed in order to extract the features, which describe its contents. The processing involves filtering, normalization, segmentation and object identification. The output of this stage is a set of significant regions and objects. B. Feature Extraction Features such as shape, texture, color, etc. are used to describe the content of the image. Image features can be classified into primitives. In this paper, an automatic unsupervised feature vector classification technique is proposed. The clustering approach groups the N computed feature vectors, V(Ii)…..V(IN) in a number of K color classes. The provided method uses a sequence of K-Means clustering procedures and identifies the optimal number of clusters using a validation index. The K- Means algorithm represents an unsupervised method for cluster analysis that aims to partition N observations into K clusters in which each observation belongs to the cluster with the nearest mean. The following objective function has to be minimized by the K-Means procedure, as a within-cluster sum of squares: Where d is the Euclidian distance, Ci is the centroid of the current cluster and Ind(Ci) represents the set of indices of pixels corresponding to the feature vectors from that cluster. The clustering procedure containing the following steps: Procedure: An Automatic Color Feature Vector Classification Step 1: Initialize K centroids, one for each cluster, each centroid representing a point in the feature vector space. Step 2: Each image feature vector is associated to the closest centroid Step 3: The centroids of the obtained clusters are recomputed, as means of the contained feature vectors Step 4: Steps 2 and 3 are repeated until the centroids of classes no longer change their positions Step 5: The optimal number of clusters is determined to maximize the inter-cluster distances and minimize the intra-cluster distances Step 6: Finally to get different level of clustering image Table 1: Algorithm for an Automatic Color Feature Vector Classification Approach
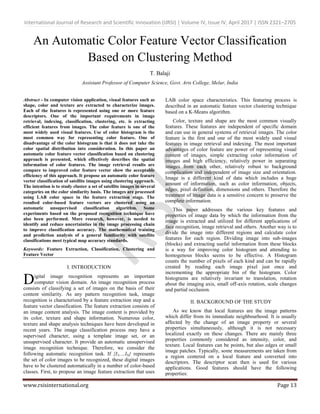
- 5. International Journal of Research and Scientific Innovation (IJRSI) | Volume IV, Issue IV, April 2017 | ISSN 2321–2705 www.rsisinternational.org Page 17 The number K that maximizes the Dunn index is considered the optimal number of clusters. The main advantage of Dunn index is its linear time complexity, the main disadvantage being the vulnerability for noise in the data. Therefore, if they obtained image feature vector classes, for a given K, are Cl1….ClK, then the optimal number of clusters is computed as: The Ci being the centroid of the cluster Cli and d(Cli) the intra-cluster distance of that cluster, representing the absolute/squared distance between all pairs of cluster elements. As seen in the Eqn. 7, the K-Means algorithm is executed N times for determining the optimal number of clusters. If the number of images is very high, the computational cost increases very much, therefore it could use a lower number of running times. VIII. EXPERIMENTAL RESULTS Numerous experiments have been performed on satellite image using this color-based image classification technique. This type of satellite image classification was implemented using MATLAB version 7.6 software. The complete process of this algorithm standards are summarized in the following Fig. 3. (a) (b) (c) (d) (e) (f) (g) (h) (i) (j) (k) Fig. 3. Resultant Satellite Image, a. Original Satellite image, b. Image for Cluster Label Index 1, c. Image for Cluster Label Index 2, d. Image for
- 6. International Journal of Research and Scientific Innovation (IJRSI) | Volume IV, Issue IV, April 2017 | ISSN 2321–2705 www.rsisinternational.org Page 18 Cluster Label Index 3, e. Image for Cluster Label Index 4, f. Image for Cluster Label Index 5, g. Image Cluster 1, h. Image Cluster 2, i. Image Cluster 3, j. Image Cluster 4 and k. Image Cluster 5 IX. CONCLUSION A machine vision approach for color images are presented in this article. The study has brought original contributions in both feature extraction and classification stages. It also proposes an automatic color feature extraction approach using clustering. Some robust color based feature vectors, based on clustering coordinates in the color space are obtained. Next, an automatic feature vector classification technique has been provided. It uses a sequence of K- Means procedure and a validation index that computes the optimal number of clusters. The results described successfully applied in the image retrieval and indexing domains. The unsupervised image recognition method could be used in the automatic development of a cluster based image index. It developed some color based image indexing and extracting techniques and improving the new color feature vectors results have been obtained. REFERENCES [1]. Balaji T., and Sumathi M., “Fast and Efficient Classification Algorithm for FCM Clustering in Remote Sensing Images”, IJISET, Vol. 1, Issue 2, pp. 124–130, May 2014. [2]. Balaji T., amd Sumathi M., “Relational Color Features of Remote Sensing Image Classification Using Dynamic Global Threshold Method”, International Conference Proceedings, ICRSI, Gujarat, pp. 29-34, December 2013. [3]. Balaji T., and Sumathi M., “Relational Features of Remote Sensing Image Classification Using Effective K-Means Clustering”, IJoART, Vol. 8, Issue 8, pp. 103–107, August 2013. [4]. Poulami Haldar and Joydeep Mukherjee, “Content Based Image Retrieval Using Histogram, Color and Edge”, International Journal of Computer Applications, pp 25-31, 2012. [5]. Dr. H.B.Kekre ,MR.Dhirendra Mishra, MS. Stuti narula and MS. Vidhi Shah , “Color Feature Extraction for CBIR”, International Journal of Engineering Science & Technology (IJEST), pp. 8357- 8365, 2011. [6]. Ciobanu A., Costin M., Barbu T., “Extraction of Main Colors from a Digital Color Image”, Proceedings of the International Multidisciplinary Scientific Geo Conference, Vol. 1, pp. 1069−1076, 2010. [7]. A. Ciobanu, M. Costin, T. Barbu, “Extraction of Main Colors From A Digital Color Image”, Proc. of International Multidisciplinary Scientific Geo Conference, Vol. 1, pp. 1069-1076, 2010. [8]. Barbu T., Ciobanu A., “Color-Based Image Retrieval Technique Using Relevance Feedback”, Proceedings of Third International Conference on Electronics, Computers and Artificial Intelligence, Vol. 4, pp. 105−108, 2009. [9]. Kanungo T., Mount D.M., Netanyahu N.S., Piatko C.D., Silverman R., Wu A.Y., “An Efficient K-Means Clustering Algorithm: Analysis and Implementation”, IEEE Transactions on Pattern Analysis and Machine Intelligence, Vol. 24, No. 7, pp. 881−892, 2009. [10]. Ying Liua, Dengsheng Zhanga, Guojun Lua and WeiYing Mab, “A Survey of Content Based Image Retrieval With High-Level Semantics", Pattern Recognition, Elsevier, pp 262-282, 2009. [11]. M. Castrillon-Santana and Q. C. Vuong, “An Analysis of Automatic Gender Classification”, In Proceedings of Conference on Progress in Pattern Recognition, Image Analysis and Applications, pp. 271–280, 2009. [12]. F. Scalzo, G. Bebis, M. Nicolescu, and L. Loss, “Feature Fusion Hierarchies for Gender Classification”, In Proceedings of International Conference on Pattern Recognition, 2008. AUTHOR PROFILES Dr. T. Balaji received post graduate degree (M.C.A.) in 1999 from Alagappa University, Karaikudi, M.Phil. degree in 2003 from Manonmaniam Sundaranar University, Tirunelveli, M.Tech. degree in 2007 from Manonmaniam Sundaranar University, Tirunelveli and Ph.D. (Computer Science) degree in 2016 from Madurai Kamaraj University, Madurai, TamilNadu. He is having 16 years of experience in teaching. He is working as an Assistant Professor at Govt. Arts College, Melur for the last 10 years. His areas of interest are Medical Image Processing, Signal Processing, Remote Sensing and Image Classification. He has published and presented over 20 research papers in international and national journals of repute. As an educationist he has conceptualized and implemented a new curriculum with encrusted learning, energetic work and exploration project as a part of under graduate education and post graduate education.