Download as PDF, PPTX

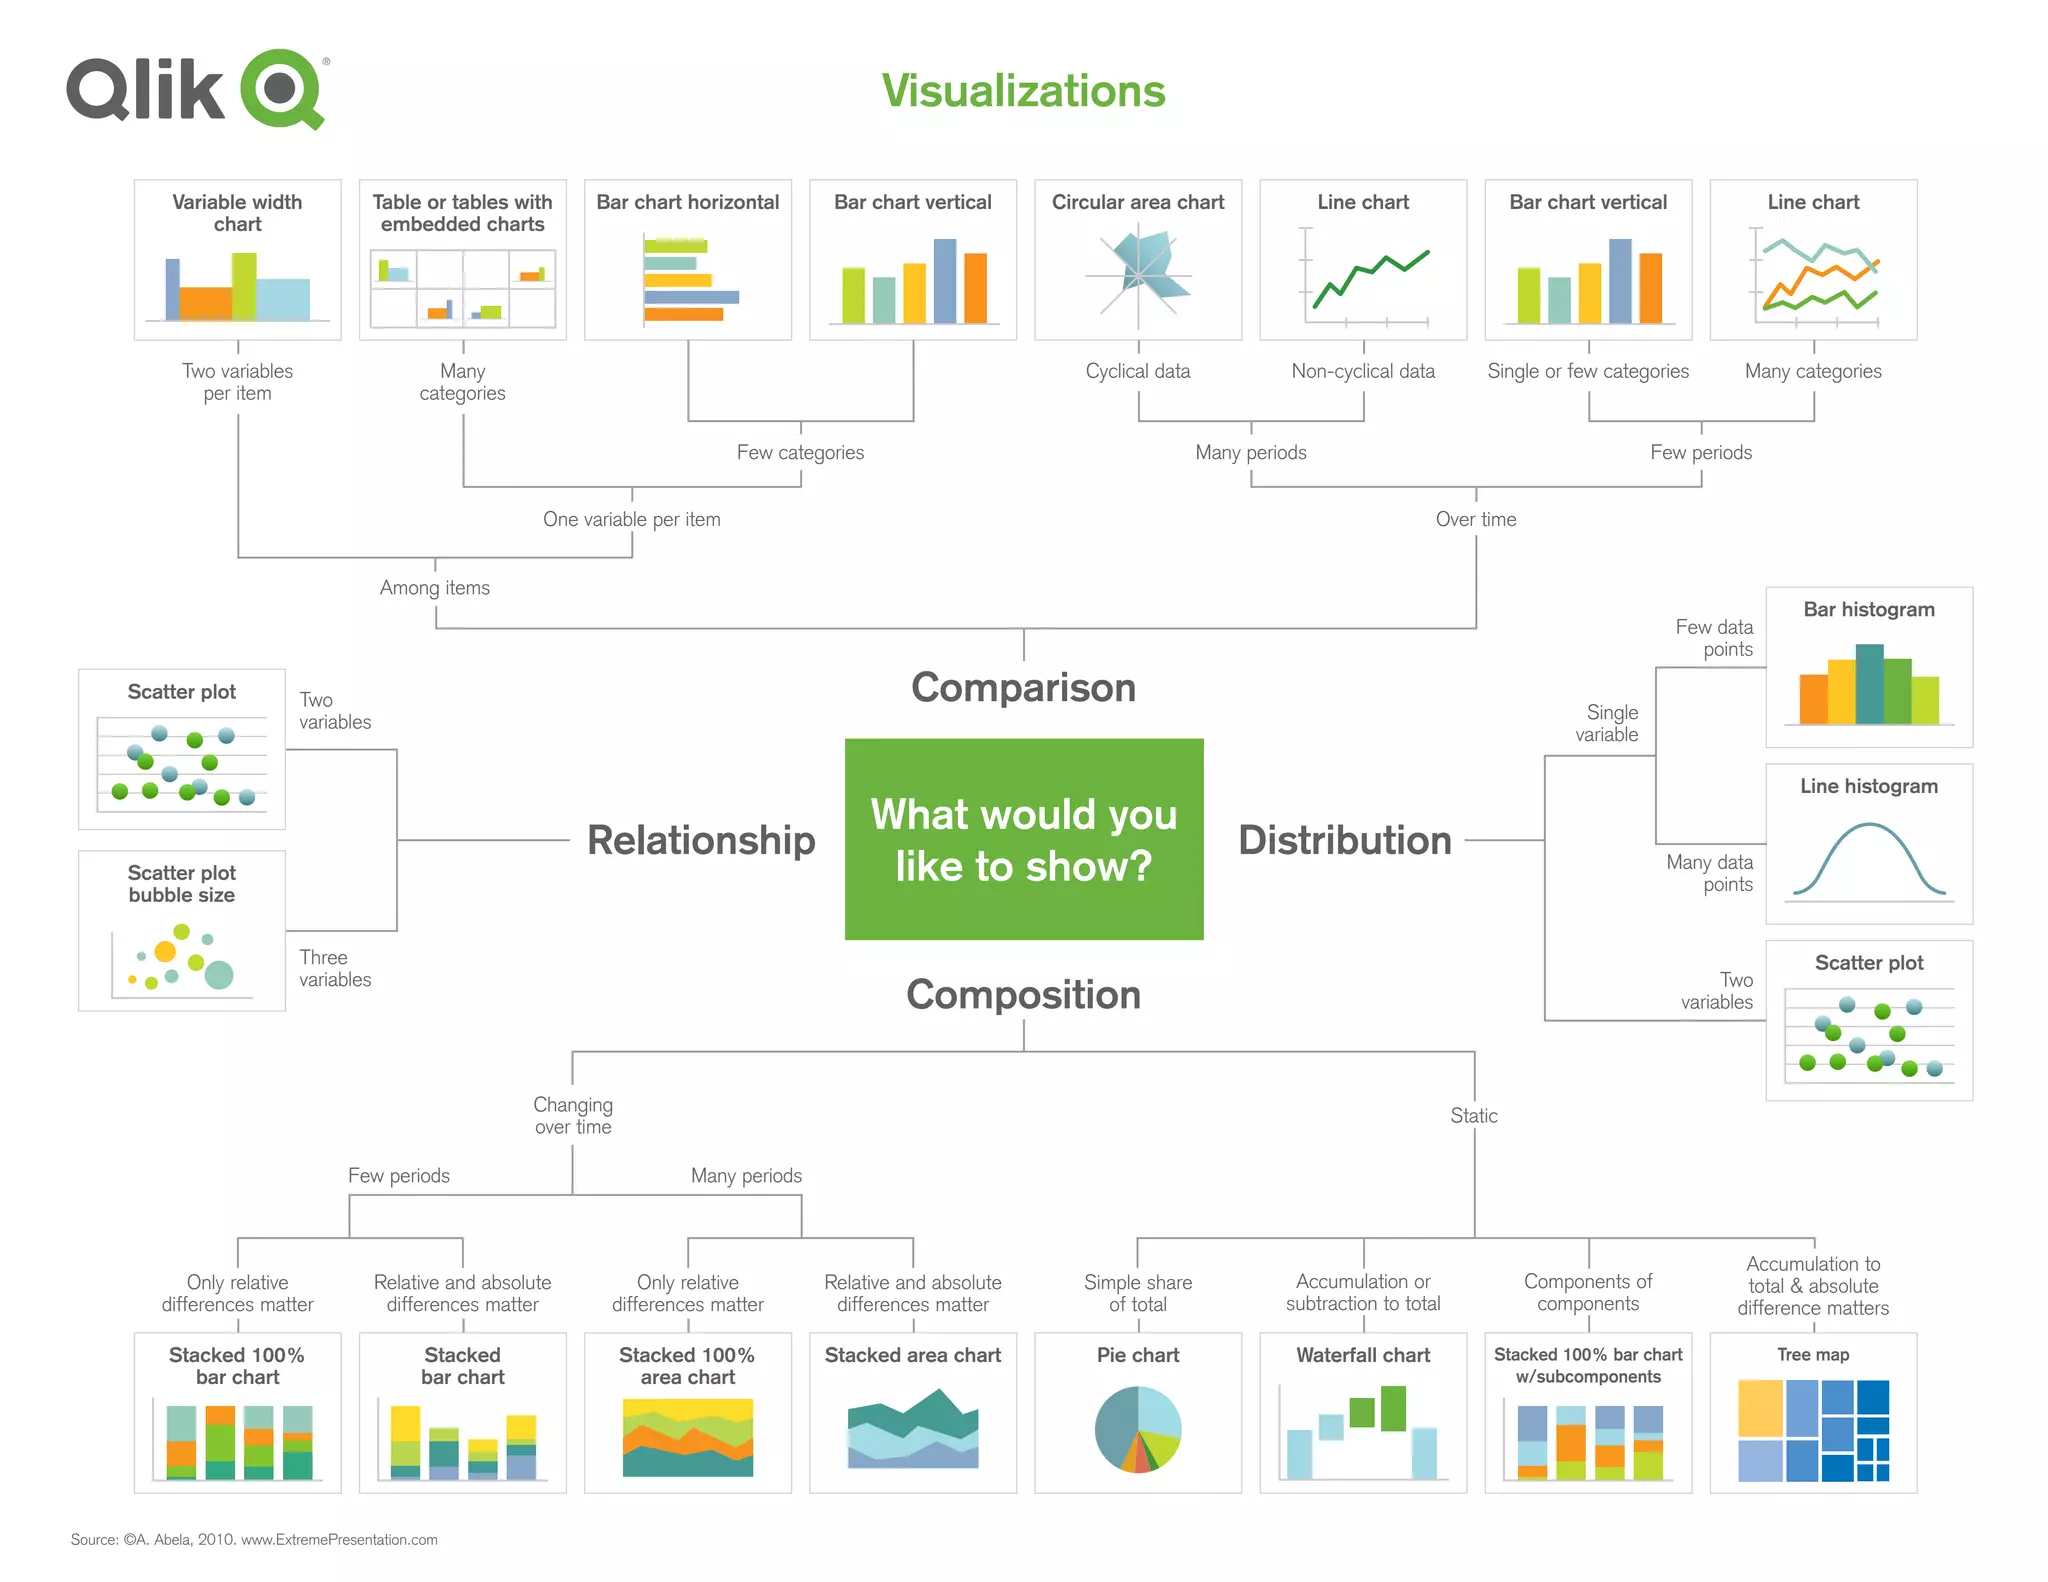

The document discusses various types of data visualizations, categorizing them into comparison, composition, distribution, and relationship charts. It outlines the purpose and application of each chart type, highlighting how they can help answer specific analytical questions. Examples include pie charts, stacked bar charts, scatter plots, and histograms, each serving distinct roles in data analysis.


![[Case Study] Enabling Content Bingeing with LookBookHQ](https://cdn.slidesharecdn.com/ss_thumbnails/lookbookhqintelsecuritysdcasestudymay2016final-160530145656-thumbnail.jpg?width=640&height=640&fit=bounds)


