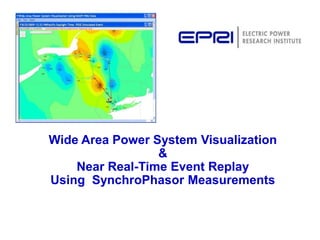
Wide Area Power System Visualization & Near Real-Time Event Replay Using SynchroPhasor Measurements
•Download as PPTX, PDF•
0 likes•107 views

The document summarizes the development of a wide area power system visualization software using synchrophasor measurements. It describes the objectives to improve situational awareness, the system architecture with data transfer from PDCs to the application server, and techniques used to improve performance for near real-time event replay. Testing of the beta version at TVA is discussed, along with visualization displays for frequency, voltage magnitude, and phase angle. The summary concludes that good progress was made in design, development, and integration testing of the software.

Recommended
Recommended
More Related Content
What's hot
What's hot (20)
Similar to Wide Area Power System Visualization & Near Real-Time Event Replay Using SynchroPhasor Measurements
Similar to Wide Area Power System Visualization & Near Real-Time Event Replay Using SynchroPhasor Measurements (20)
More from Power System Operation
More from Power System Operation (20)
Recently uploaded
Recently uploaded (20)
Wide Area Power System Visualization & Near Real-Time Event Replay Using SynchroPhasor Measurements
- 1. Wide Area Power System Visualization & Near Real-Time Event Replay Using SynchroPhasor Measurements
- 2. Wide Area Power System Visualization Objectives 2© 2009 Electric Power Research Institute, Inc. All rights reserved. • Improve operator situational awareness • Perform wide area power system visualization using real-time synchrophasor measurements for – Real-time reliability monitoring – Real-time large event detection – Near real-time event replay – Location of disturbance • Perform event replay for post event analysis
- 3. System Architecture Overview WA PS Visualization Application Via Internet or Intranet On-line Event Trigger Event Oriented Application Database Location of Disturbance Visualization Web Service Data Transfer SuperPDC Data ServerApplication Server Web Server Application Service with Memory Residence DB 3© 2009 Electric Power Research Institute, Inc. All rights reserved.
- 4. Performance Challenges 4© 2009 Electric Power Research Institute, Inc. All rights reserved. •Transfer large volume of synchrophasor measurements from distributed phasor data concentrators (PDC) to application server. •Transfer synchrophasor measurements from application server to each user’s computer. •Perform near real-time event replay for on-going event by large number of users. •Perform post event analysis while each user may replay different events.
- 5. Techniques for Performance Improvements 5© 2009 Electric Power Research Institute, Inc. All rights reserved. • Improve performance of real-time reliability monitoring – Use memory residence object-oriented database – Transfer 1 or 2 samples per second when there is no events • Improve performance of near real-time event replay and post event analysis – Use event oriented application database – Efficiently handle event related synchrophasor data – Replay events locally fully utilizing user’s computer resources
- 6. Wide Area Power System Visualization Main Features 6© 2009 Electric Power Research Institute, Inc. All rights reserved. • Real-time security monitoring using real-time synchrophasor measurements • On-line event detection • Near real-time event replay • Location of disturbance • Post event analysis • High performance visualization Frequency contour Voltage magnitude contour Voltage angle contour Angle differences Trending charts Dashboards
- 7. Wide Area Power System Visualization Integration & Performance Testing 7© 2009 Electric Power Research Institute, Inc. All rights reserved. • Deployed beta version of wide area visualization application at TVA in October of 2009 • Integrated with SuperPDC at TVA in October of 2009 • Integrated with OpenPDC in January of 2009 performed by TVA • Performed integration testing using real-time synchrophasor measurements of Eastern Interconnection • Performed testing using 45 simulated PMUs in NYISO area
- 8. Near Real-Time Event Replay Testing Results 49 PMUs with 300s event data (about 10MB) Using a Laptop 8© 2009 Electric Power Research Institute, Inc. All rights reserved. Traditional Approach (Second) New Approach (Second) Insert event data into event database from PMU data server 644 33 Read event data from event database from application server 25 1 Visualization display shows up after an event is detected. 858 About 5
- 9. Frequency Visualization Display using 1000 MW Generator Outage Data on March 22, 2006 9© 2009 Electric Power Research Institute, Inc. All rights reserved.
- 10. Voltage Magnitude Contour Display Using Real-Time SynchroPhasor Measurements 10© 2009 Electric Power Research Institute, Inc. All rights reserved.
- 11. Phase Angle Contour Display Using Real-Time SynchroPhasor Measurements 11© 2009 Electric Power Research Institute, Inc. All rights reserved.
- 12. Frequency Contour Display Using Real-Time SynchroPhasor Measurements 12© 2009 Electric Power Research Institute, Inc. All rights reserved.
- 13. Summary 13© 2009 Electric Power Research Institute, Inc. All rights reserved. • Made very good progress in the design, development and integration testing of wide area power system visualization software • Developed power system visualization technologies for meeting performance requirements • Allowed operators to perform near real time event replay to track on-going event • Completed integration and testing of a beta version of visualization software at TVA
- 14. Acknowledgement Funding and Technical Support • The current EPRI R&D projects of wide area power system visualization using synchrophasor measurements are funded by – TVA – ConEd – NYSERDA – EPRI Technology Innovation (TI) • Technical supports: TVA, Virginia Tech, NYISO, NYPA, ConEd and LIPA 14© 2009 Electric Power Research Institute, Inc. All rights reserved.
- 15. DOE Demonstration of a Novel Synchrophasor Based Situation Awareness System 15© 2009 Electric Power Research Institute, Inc. All rights reserved. • DOE issued the contract on September 30, 2009. • Project will be completed in 3 years. • Large scale demonstration using synchrophasor measurements for • Real-time reliability monitoring • On-line event detection and location of disturbance • Near real-time event replay • Post event analysis • Early warning of potential system problems • Project teams: EPRI, TVA, Yilu Liu of UTK and HTC Tech
- 16. Deliverables 16© 2009 Electric Power Research Institute, Inc. All rights reserved. • Technical report • Demonstration using synchrophasor measurements – Wide area power system visualization for real-time reliability monitoring – Near real-time event replay – Early detection of system problems (TVA area) • Software installation guide and user guide • Technical training • One technical workshop at the end of Phase 1 • One technical workshop at the end of Phase 3