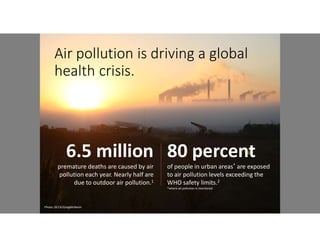
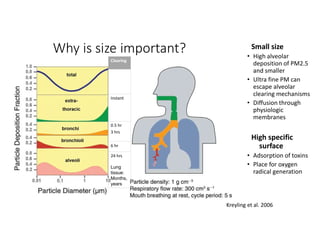
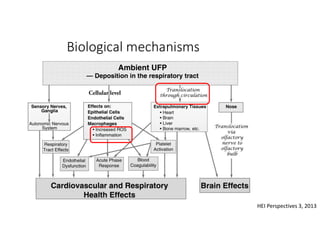
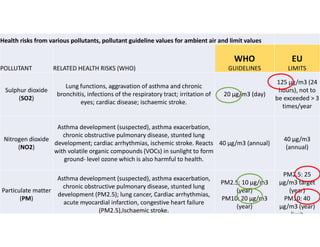
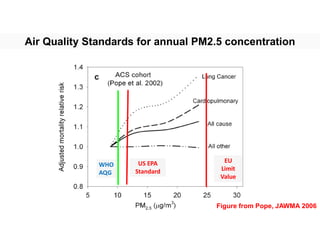
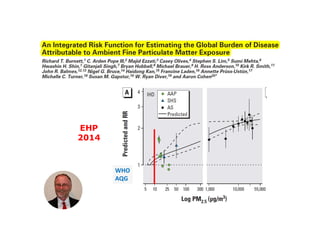
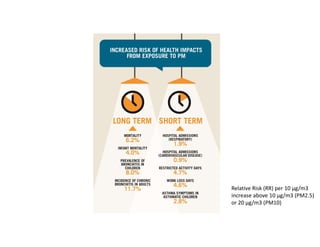
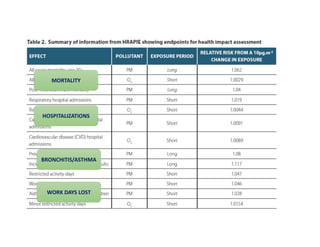
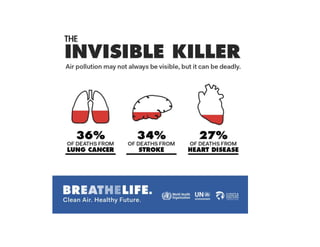
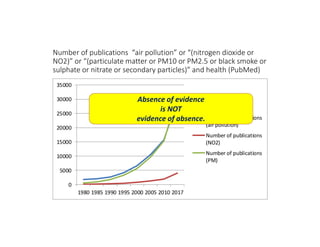
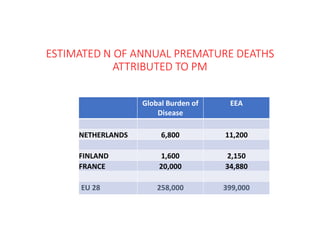
Presentation by Vlatka Matkovic at the OpenDataDay event 'Towards Clean Air with Open Data'. The event took place at BeCentral in Brussels on Saturday 3 March 2018.
1. Air quality
and its implications on our
health
Vlatka Matkovic, PhD in Public Health
Health & Environment Alliance (HEAL)
@VlatkaMatkovic
Towards Clean Air with Open Data
Brussels, March 2018
2. 6.5 million
premature deaths are caused by air
pollution each year. Nearly half are
due to outdoor air pollution.1
Air pollution is driving a global
health crisis.
80 percent
of people in urban areas* are exposed
to air pollution levels exceeding the
WHO safety limits.2
*where air pollution is monitored
Photo: GCCA/GregMcNevin
3. Air pollutants
HEI, Health Effects Institute.
Air pollution is a complex
mixture of gaseous,
volatile, semi-volatile and
particulate matter, and its
exact composition varies
widely.
5. Why is size important?
Kreyling et al. 2006
Small size
• High alveolar
deposition of PM2.5
and smaller
• Ultra fine PM can
escape alveolar
clearing mechanisms
• Diffusion through
physiologic
membranes
High specific
surface
• Adsorption of toxins
• Place for oxygen
radical generation
Clearing
Instant
0.5 hr
3 hrs
6 hr
24 hrs
Lung
tissue:
Months,
years
7. Health risks from various pollutants, pollutant guideline values for ambient air and limit values
POLLUTANT RELATED HEALTH RISKS (WHO)
WHO
GUIDELINES
EU
LIMITS
Sulphur dioxide
(SO2)
Lung functions, aggravation of asthma and chronic
bronchitis, infections of the respiratory tract; irritation of
eyes; cardiac disease; ischaemic stroke.
20 μg/m3 (day)
125 μg/m3 (24
hours), not to
be exceeded > 3
times/year
Nitrogen dioxide
(NO2)
Asthma development (suspected), asthma exacerbation,
chronic obstructive pulmonary disease, stunted lung
development; cardiac arrhythmias, ischemic stroke. Reacts
with volatile organic compounds (VOCs) in sunlight to form
ground- level ozone which is also harmful to health.
40 μg/m3 (annual)
40 μg/m3
(annual)
Particulate matter
(PM)
Asthma development (suspected), asthma exacerbation,
chronic obstructive pulmonary disease, stunted lung
development (PM2.5); lung cancer, Cardiac arrhythmias,
acute myocardial infarction, congestive heart failure
(PM2.5),Ischaemic stroke.
PM2.5: 10 μg/m3
(year)
PM10: 20 μg/m3
(year)
PM2.5: 25
μg/m3 target
(year)
PM10: 40
μg/m3 (year)
limit
8. WHO EHC 188, 1997, 2nd edition
“On the basis of a background level of 15 µg/m3
(0.008 ppm) and the fact that significant adverse
health effects occur with an additional level of 28.2
µg/m3 (0.015 ppm) or more, an annual guideline
value of 40 µg/m3 (0.023 ppm) is proposed. This
value will avoid the most severe exposures.”
Where does the NO2 40 µg/m3
annual average AQG come from?
9. WHO
AQG
Air Quality Standards for annual PM2.5 concentration
EU
Limit
Value
US EPA
Standard
Figure from Pope, JAWMA 2006
14. Number of publications “air pollution” or “(nitrogen dioxide or
NO2)” or “(particulate matter or PM10 or PM2.5 or black smoke or
sulphate or nitrate or secondary particles)” and health (PubMed)
0
5000
10000
15000
20000
25000
30000
35000
1980 1985 1990 1995 2000 2005 2010 2017
Number of publications
(air pollution)
Number of publications
(NO2)
Number of publications
(PM)
Absence of evidence
is NOT
evidence of absence.
15. Committee on the Medical Effects of Air Pollutants (update provisional, pending full report)
https://www.gov.uk/government/uploads/system/uploads/attachment_data/file/632916/air-quality-plan-technical-report.pdf
Policy CRF Source Comment
Reductions of all traffic
pollutants
1.023 (95% CI: 1.008,
1.037) per 10μg/m3
annual average NO 2
Single pollutant model
meta-analysis
Newer studies than
HRAPIE, general
population only; 1.06 for
PM2.5 as alternative
Reductions primarily
targeting NOx
emissions
1.006 – 1.013 20% reduction adjustment
for PM2.5, then expert
judgement NO2 30-70% of
this
Typical % reduction
from studies with more
moderate correlations
Add effect on nitrate to
both
1.06 (95% CI: 1.04 –
1.08) per 10μg/m3
annual average
Hoek et al (2013) Location will be
different
Burden Not appropriate for NO2 alone, consider for mixture
16. ESTIMATED N OF ANNUAL PREMATURE DEATHS
ATTRIBUTED TO PM
Global Burden of
Disease
EEA
NETHERLANDS 6,800 11,200
FINLAND 1,600 2,150
FRANCE 20,000 34,880
EU 28 258,000 399,000
17. DIFFERENCES BETWEEN Global Burden of Disease
AND EEA APPROACH
GBD EEA
Concentrations Sat., CTM, Meas.,
geog. 10x10 km
Airbase interpol.
1x1 km
Counterfactual 2.4-5.9 μg/m3 0 or 2.5 μg/m3
Basis AAP, HAP, SHS, AS AAP
Causes IHD, Stroke, LRI,
COPD, Lung CA
Non-accidental
all-cause
Shape Curvilinear Linear
Age dep. RR YES (IHD only) NO
COD recoding YES NO