
Recommended
More Related Content
What's hot
What's hot (20)
Similar to Bode plot
Similar to Bode plot (20)
More from Mrunal Deshkar
Recently uploaded
Recently uploaded (20)
Bode plot
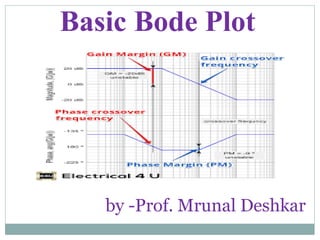
- 1. Basic Bode Plot by -Prof. Mrunal Deshkar
- 2. The Bode plot or the Bode diagram consists of two plots − 1. Magnitude plot 2. Phase plot •The magnitude of the open loop transfer function in dB is - •The phase angle of the open loop transfer function in degrees is - Bode plot
- 3. Basic of Bode Plots
- 5. Consider the open loop transfer function G(s)H(s)=K Magnitude M=20logK Phase angle ϕ =0 degrees If K=1, then magnitude is 0 dB. If K>1, then magnitude will be positive. If K<1, then magnitude will be negative.
- 6. Consider the open loop transfer function G(s)H(s)=s. Magnitude M=20logω Phase angle ϕ =90 At ω=0.1 rad/sec, the magnitude is -20 dB. At ω=1 rad/sec, the magnitude is 0 dB. At ω=10 rad/sec, the magnitude is 20 dB.
- 7. Consider the open loop transfer function G(s)H(s)=1+sτ
- 8. Construction of Bode Plots
- 9. Stability Analysis using Bode Plots Phase Cross over Frequency The frequency at which the phase plot is having the phase of - 1800 is known as phase cross over frequency. It is denoted by ωpc. The unit of phase cross over frequency is rad/sec. Gain Cross over Frequency The frequency at which the magnitude plot is having the magnitude of zero dB is known as gain cross over frequency. It is denoted by ωgc. The unit of gain cross over frequency is rad/sec. If ωpc>ωgc : control system is stable. If ωpc=ωgc : control system is marginally stable. If ωpc<ωgc : control system is unstable.
- 11. GM & PM are +ve : the control system is stable. GM & PM are zero : the control system is marginally stable. GM & PM are -ve : the control system is unstable.
- 12. The procedure of drawing a Bode plot: 1. Substitute the s = jω in the open loop transfer function G(s) × H(s). 2. Find the corresponding corner frequencies and tabulate them. 3. Now we are required one semi-log graph chooses a frequency range such that the plot should start with the frequency which is lower than the lowest corner frequency. Mark angular frequencies on the x-axis, mark slopes on the left hand side of the y-axis by marking a zero slope in the middle and on the right hand side mark phase angle by taking -180o in the middle. 4. Calculate the gain factor and the type or order of the system. 5. Now calculate slope corresponding to each factor.
- 13. For drawing the Bode magnitude plot: •Mark the corner frequency on the semi-log graph paper. •Tabulate these factors moving from top to bottom in the given sequence. 1.Constant term K. 2.Integral factor 3.First order factor 4.First order factor (1+jωT). 5.Second order or quadratic factor: •Now sketch the line with the help of the corresponding slope of the given factor. Change the slope at every corner frequency by adding the slope of the next factor. You will get the magnitude plot. •Calculate the gain margin. For drawing the Bode phase plot: 1.Calculate the phase function adding all the phases of factors. 2.Substitute various values to the above function in order to find out the phase at different points and plot a curve. You will get a phase curve. 3.Calculate the phase margin.
- 20. Thank you