The document summarizes several studies conducted between 2004-2006 and 2014-2015 on growing kenaf in Iowa. It examines the effects of seed density, row spacing, nitrogen fertilizer, and planting date on kenaf yield, morphology, and fiber composition. The studies found that yield was maximized at 247,000 seeds/ha and May planting date. Nitrogen fertilizer improved fiber quality but did not increase yield after soybeans. Row spacing and seed density significantly impacted fiber characteristics in complex ways. Overall, kenaf can be grown successfully in Iowa and offers opportunities for agricultural diversity and industrial applications.
1. Optimal agricultural practices for
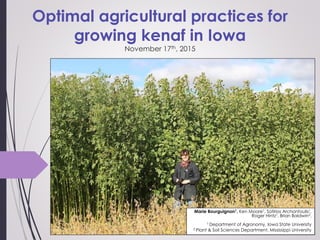
growing kenaf in Iowa
November 17th, 2015
Marie Bourguignon1, Ken Moore1, Sotirios Archontoulis1,
Roger Hintz1, Brian Baldwin2.
1 Department of Agronomy, Iowa State University
2 Plant & Soil Sciences Department, Mississippi University
2. What we know about kenaf…
Core
Short and
porous fibers
Bast
Long and valuable
fibers
4. What we do NOT know about kenaf…
?
What is its potential
for fuel ?
5. Experiment 2004 - 2005 - 2006
Treatment Unit 2004 - 2005 - 2006
Cultivar Tainung 2
Seed Density seed ha-1 185,000 278,000 370,000
Row Spacing cm 20 38 76
N Fertilizer kg ha-1 0 168
Planting Date early, late May, early June
Data Collected
Morphological
Yield, population, height & diameter,
core:bast ratio
Chemical Fiber analysis (NDF, ADF, ADL, Ash)
7. Stem height & diameter:
Smaller stem when too crowded
Larger stem in low densities and when planted in May
Core:bast ratio:
More core when planted in May and not crowded
More bast when planted later and at 8”
Adding N reduced the ratio in 2004
Morphology 2004 - 2005
8. Fiber composition 2004 - 2005
BAST CORE
Cellulose 60 %
• Date * row * density
• N slightly better
52 %
• Higher in 2005
• N beneficial but only in
2004
Hemicellulose 16 %
• Very low in 2005
• Row * density
• N not always
beneficial
21 %
• Row * density
• N beneficial but only in
2004
Lignin 5%
• Row * density
• N not always
beneficial
9 %
• Higher in 2005
• Better when planted end
of May
• N beneficial but only in
2005
Not enough information about N
No information on the growth over time
9. Experiment 2014 - 2015
Treatment Unit 2004 - 2005 - 2006 2014 - 2015
Cultivar Tainung 2 Tainung 2, Whitten
Seed Density seed ha-1 185,000 278,000 370,000 247,000 370,000
Row Spacing cm 20 38 76 38 76
N Fertilizer kg ha-1 0 116850 0 56 112 168 224
Planting Date Early, late May, early June Only one
Data
Collected
Morphological
Yield, population, height &
diameter, core:bast ratio
Yield, population, height &
diameter (biweekly)
LAI (monthly), core:bast ratio
Chemical
Fiber analysis (NDF, ADF, ADL,
Ash)
Fiber analysis (NDF, ADF, ADL,
Ash), %C, %N
10. Yield 2014
2014 yield was only influenced by seed density
(247,000 > 370,000)
Population varied among variety and field practices
11. Jun Jul Aug Sep Oct
LAI
0
1
2
3
0 kg ha
-1
56 kg ha
-1
112 kg ha
-1
168 kg ha
-1
224 kg ha
-1
Jun Jul Aug Sep Oct Nov
Height(cm)
0
50
100
150
200
250
247,000 seed ha
-1
370,000 seed ha
-1
Jun Jul Aug Sep Oct Nov
Diameter(mm)
0
5
10
15
20
25 0 kg ha
-1
56 kg ha
-1
112 kg ha
-1
168 kg ha
-1
224 kg ha
-1
Growth 2014
T2 was thicker than
Whitten except for 76 cm
and 370,000 seed ha-1
12. Fiber quantity and quality
BAST CORE
Cellulose 55 %
• Low N often beneficial
but variety dependent
52 %
• Variety * management
practices
Hemicellulose 13 %
• Variety * management
practices
• High N often beneficial
20 % • Unaffected at all
Lignin 6 % • Unaffected at all 10 % • Higher in Tainung 2
Total Ash 9 %
• Higher for Whitten or in
wide rows
• High in low N
4 %
• Higher for Tainung 2
• High in low N
C 42 % • Row * density * N 46 % • Unaffected at all
N 1.0 % • Higher with N 0.7 % • Higher with N
Fiber quantity: Whitten (1.6) had higher core:bast
ratio than Tainung 2 (1.5)
13. All factors had an effect, in variable ways
Trade-off between yield and quantity of fibers
Planting date: May seems better
Nitrogen:
No effect on yield when planted after soybean
But high effect on fiber composition
Relatively easy to grow in Iowa
Could bring diversity to agriculture and industry
Conclusions
Introduction
Annual, dicot, herbaceous and non-native. Malvaceae family.
Introduced in the US during WWII
Here is a picture of two varieties of kenaf: Tainung 2 and Whitten
Here are some other pictures of its flower and seeds.
The particularity of kenaf lays in its stem, which is composed of an outer bast with long and valuable fibers; and an inner core, with much shorter and porous fibers.
Kenaf is mostly grown for its fibers. Its stem can be used for paper pulp, rope, textile, bioplastic and biocomposite.
Very few studies have been looking at the leaves for feed purposes.
But kenaf has raised more and more interests for fuel purposes and could be used as a herbaceous lignocellulosic feestock.
Herbaceous lignocellulosic plants like kenaf for production of agro-pellets, biogas or bioethanol based on 2nd generation crop/fuel chain;
Oil, starch, sugars, lignocellulose
Glass fiber: 2 $/kg vs kenaf: 0.4-0.55 $/kg
Right now, India and China are the leaders of kenaf production. In the US, it is grown mostly in the South.
Very few kenaf studies have been conducted in the Midwest, especially in Iowa, where kenaf could be a promising crop.
There are multiple questions we can ask ourselves.
But for today, we will focus on the management practices.
Over 10 years, kenaf experiments were conducted in Iowa, looking at the seed density, row spacing, N fertilizer and planting date effects on kenaf growth.
This was a RCBD with Split plots. 3 SD, 3 RS, 3 PD and 2 N rates. The data collected were relative to the morphology and the chemistry associated with kenaf fibers.
Let’s focus on the yield first, because this is always what we are interested in.
Here is a graph with the yield for each treatment: 3 SD (3 colors), the 3 RS and the 3PD (different shades).
For 2004, there was a lot of variability. Most of the “crowded” plots performed well.
For 2005, the yield was overall lower than 2004 and it also presented variations, but less dramatic. Planting in June was in general not a good thing.
In 2006, planting late was even worse. The best yields were for 8” but
Planting at 8’ is far more variable and depends more on the planting date than planting at 15” or 30”.
….
Looking at the morphology, stem H & D were the best when it was not “too crowded”. Stems were larger in low densities, aspecially when planted in May.
Core:bast ratio: low densities planted in May improve core portion and RS of 8” + planted later improves bast portion. All are in % so it relative to the plant.
N effect: increased bast production but only in 2004, relatively to the plant.
This is the composition of bast and core. Bast had, in general, more cellulose but less hemicellulose and lignin than core.
Each of the part were, in some ways, affected by the management practices. For example, cellulose in bast was higher when planted in wide rows in May or in tight rows in June. Hemicellulose in the bast was quite different from one year to another. In 2005, there was more cellulose and lignin in the core than in 2004.
Note the effect of N that is not that dramatic.
Overall, this study has shown some interesting results but it lacked information about gradual N rates (only 0 or 150 lb/a) and no information on the growth over time.
In 2014 – 2015, a new design was made. Still a RCBD with Split-plot with this time, two cultivars (explain the two varieties), 2 RS, 2 SD, only one planting date and this time, 5 N rates.
Data collected were similar but H&D every two weeks and LAI monthly, + %C and %N at harvest.
From 2004 to 2006, the overall yield was about 9 t/ha and influenced by all management practices except N. In 2014, the yield was similar and only influenced by seed density, but still not by N (see fig). Also, the two varieties behaved similarly.
Over the growing season, seed density also influenced the height. Diameter and LAI, however, were different among N rates starting in August.
Larger diameters were achieved when plants were not crowded, which was also found in the previous study. Varieties became different on the diameter aspect too. T2 was in general thicker than Whitten except for 30” and 150,000 s/a.
This is the composition of bast and core. Bast had, in general, more cellulose but less hemicellulose and lignin than core.
Each of the part were, in some ways, affected by the management practices. For example, cellulose in bast was higher when planted in wide rows in May or in tight rows in June. Hemicellulose in the bast was quite different from one year to another. In 2005, there was more cellulose and lignin in the core than in 2004.
Note the effect of N that is not that dramatic.
Overall, this study has shown some interesting results but it lacked information about gradual N rates (only 0 or 150 lb/a) and no information on the growth over time.
Lets wrap those 4 years into one slide.
Overall, kenaf could be relatively easy to grow in Iowa and could bring diversity to its agriculture and industry.