Managing Portuquese forests for non-timber forest products - Margarida Tomé, Universidade de Lisboa
•Download as PPTX, PDF•
2 likes•544 views

A stakeholders’ driven development of forest management support tools. Margarida Tomé, Centro de Estudos Florestais, Instituto Superior de Agronomia Universidade de Lisboa Non-Timber Forest Products and Bioeconomy 28–30 November 2017, Rovaniemi, Finland

Recommended
Recommended
More Related Content
Similar to Managing Portuquese forests for non-timber forest products - Margarida Tomé, Universidade de Lisboa
Similar to Managing Portuquese forests for non-timber forest products - Margarida Tomé, Universidade de Lisboa (20)
More from Natural Resources Institute Finland (Luke) / Luonnonvarakeskus (Luke)
More from Natural Resources Institute Finland (Luke) / Luonnonvarakeskus (Luke) (20)
Recently uploaded
Recently uploaded (20)
Managing Portuquese forests for non-timber forest products - Margarida Tomé, Universidade de Lisboa
- 2. Managing Portuguese forests for non-timber forest products A stakeholders’ driven development of forest management support tools Margarida Tomé Centro de Estudos Florestais Instituto Superior de Agronomia Universidade de Lisboa
- 3. With the help of the ForChange group…
- 4. and of many others…
- 5. Topics Non-timber forest products in Portugal Cork oak – Most important forest management decisions – Long term optimisation (growth and yield models) – Short term refining – tools developed on managers’ request Stone pine – Most important forest management decisions – Long term optimisation (growth and yield models) – Short term refining – tools developed on managers’ request Conclusions
- 6. Non-timber forest products in Portugal (results from COST FP1203 survey + Marlene Marques & Ana Cardeal Msc thesis)
- 7. Tree products Understory products Mushrooms & Truffles Animal products resin Cork Pine nuts Acorns Amanita caesarea Amanita ponderosa Boletus edulis Chantharellus cibarius Terfezia arenaria Terfezia leptoderma Choiromyces gangliformis Tuber oligospermum Wild bore Red deer Roe deer Rabbit Legged partridge Lúcia-lima Erva cidreira Tomilho limão Hortelã pimenta Honey Lavanda amarela Tricholoma equestre Macrolepiota procera
- 8. Tree products Understory products Mushrooms & Truffles Animal products resin Cork Pine nuts Acorns Amanita caesarea Amanita ponderosa Boletus edulis Chantharellus cibarius Terfezia arenaria Terfezia leptoderma Choiromyces gangliformis Tuber oligospermum Wild bore Red deer Roe deer Rabbit Legged partridge Lúcia-lima Erva cidreira Tomilho limão Hortelã pimenta Honey Lavanda amarela Relevant in the past starting to come back Tricholoma equestre Macrolepiota procera
- 9. Tree products Understory products Mushrooms & Truffles Animal products resin Cork Pine nuts Acorns Amanita caesarea Amanita ponderosa Boletus edulis Chantharellus cibarius Terfezia arenaria Terfezia leptoderma Choiromyces gangliformis Tuber oligospermum Wild bore Red deer Roe deer Rabbit Legged partridge Lúcia-lima Erva cidreira Tomilho limão Hortelã pimenta Honey Lavanda amarela Have potencial but presently just used as animal food Tricholoma equestre Macrolepiota procera
- 10. Tree products Understory products Mushrooms & Truffles Animal products resin Cork Pine nuts Acorns Amanita caesarea Amanita ponderosa Boletus edulis Chantharellus cibarius Terfezia arenaria Terfezia leptoderma Choiromyces gangliformis Tuber oligospermum Wild bore Red deer Roe deer Rabbit Legged partridge Lúcia-lima Erva cidreira Tomilho limão Hortelã pimenta Honey Lavanda amarela Have potential but presently not very relevant Several “domestication” programs becoming relevant Tricholoma equestre Macrolepiota procera
- 11. Tree products Understory products Mushrooms & Truffles Animal products resin Cork Pine nuts Acorns Amanita caesarea Amanita ponderosa Boletus edulis Chantharellus cibarius Terfezia arenaria Terfezia leptoderma Choiromyces gangliformis Tuber oligospermum Wild bore Red deer Roe deer Rabbit Legged partridge Lúcia-lima Erva cidreira Tomilho limão Hortelã pimenta Honey Lavanda amarela Tricholoma equestre Macrolepiota procera Have high potential but presently not very relevant due to Unsolved property rights Subsequent market issues
- 12. Tree products Understory products Mushrooms & Truffles Animal products resin Cork Pine nuts Acorns Amanita caesarea Amanita ponderosa Boletus edulis Chantharellus cibarius Terfezia arenaria Terfezia leptoderma Choiromyces gangliformis Tuber oligospermum Wild bore Red deer Roe deer Rabbit Legged partridge Lúcia-lima Erva cidreira Tomilho limão Hortelã pimenta Honey Lavanda amarela Very important Not as much as cork and pine nuts Forest management problems very different from those for cork oak and pine nuts Tricholoma equestre Macrolepiota procera
- 13. Cork oak management in Portugal
- 14. Cork oak in Portugal Cork is the main product from cork oak (Quercus suber) that occupies in Portugal 736,775 ha (23% of Portuguese forests and 34.4% of the cork oak world area) Annual production is 100,000 Mg exports of 897 million € in 2015 (respectively 49.6% and 62.7% of the world) Exports represent 1.2% of total Portuguese exports The sector has 670 companies implying 9,000 jobs One tree produces up to 160 kg in one harvest One stand produces up to 5000 kg ha-1 (depending on site, stand density and tree size)
- 15. Cork debarking occurs every k years Movie by Joana A Paulo
- 16. 14 After extraction, the cork is usually stored in the farm in large stacks
- 17. The raw cork is then transported to the mill where it will be processed Time between harvest and processing is about 6-8 months Before processing cork is treated with boiling water in autoclaves at ambient pressure during 1 hour
- 18. Dimension expansion with boiling: radial – 10-15% tangencial and axial – 5%
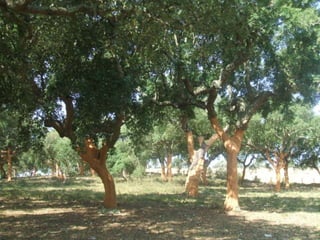
- 19. Cork oak in Portugal Historically managed as agroforestry systems Gradually transformed into silvopastoral systems Several management systems, namely: – Optimize cork production (no grazing, higher crown cover) – Maintain a multifunctional system with grazing underneath (sparse stand) Landowners are quite dynamic, always trying to adapt management to new market opportunities and changing environment (e.g. climatic conditions)
- 20. Main cork oak management decisions Tree density – evaluated by crown cover Silvicultural system – stand regeneration method Even-aged or uneven-aged cork – Cork extracted from all trees at the same time or in different years Cork debarking rotation – period between two cork extractions Long term (strategic) decisions G&Y models Short term decision Other type of tools
- 21. Main cork oak management decisions Tree density (evaluated by crown cover) – implies the selection of the type of system – a sparse stand compatible with agriculture, pasture or game – a denser forest that aims at producing cork as main product Dense stand More cork, no grazing or game Sparse stand combining cork with grazing/game
- 22. Main cork oak management decisions Silvicultural system (stand regeneration method) – Even-aged – Multi-layred – Uneven-aged Young plantation Stand with 2 layers
- 23. Main cork oak management decisions Cork debarking rotation (period between two cork extractions) – The best time to debark is when cork value is maximum – Cork value depends mainly on two factors: cork thickness (caliper) and cork quality (porosity and defects)
- 24. Cork with good quality and different calipers
- 25. Cork with poor quality and different calipers
- 26. Cork with similar caliper and different quality
- 27. Cork value is related to cork caliper
- 28. Cork prices structure in 2007 2007 prices €/@ (1@ = 15 kg) Thickness (mm) 1st to 3rd 4th 5th 6th Refuge < 18 36.0 1.7 1.7 1.7 1.7 18 to 20 36.0 36.0 13.5 1.7 1.7 20 to 25 36.0 36.0 13.5 1.7 1.7 25 to 39 88.5 54.8 13.5 16.7 1.7 > 39 88.5 54.8 13.5 16.7 1.7 small pieces and virgin cork 1.7 1.7 1.7 1.7 1.7 Quality class
- 29. Main cork oak management decisions Cork debarking rotation (period between two cork extractions) – The best time to debark is when cork value is maximum – Cork value depends mainly on two factors: cork thickness (caliper) and cork quality (porosity and defects) – Cork caliper can, to a certain extent, be controled by management – adjusting the period between cork extractions – But this is not an easy task as there is a very high variability in caliper within the stand (inter tree variability)
- 30. Inter-tree variability in cork caliper >27 mm – useful for cork stoppers <27 mm – other less valuable uses
- 31. Inter-tree variability in cork caliper
- 32. Main cork oak management decisions Cork debarking rotation (period between two cork extractions) – The best time to debark is when cork value is maximum – Cork value depends mainly on two factors: cork thickness (caliper) and cork quality (porosity and defects) – Cork caliper can, to a certain extent, be controled by management – adjusting the period between cork extractions – But this is not an easy task as there is a very high variability in caliper within the stand (inter tree variability) – Cork thickness is highly affected by weather
- 33. Weather, namely precipitation, affects cork growth Cork growth can be measured But the pattern is not always clear… low precipitation general decreasing pattern over time high precipitation
- 34. Main cork oak management decisions Cork debarking rotation (period between two cork extractions) – The best time to debark is when cork value is maximum – Cork value depends mainly on two factors: cork thickness (caliper) and cork quality (porosity and defects) – Cork caliper can, to a certain extent, be controled by management – adjusting the period between cork extractions – But this is not an easy task as there is a very high variability in caliper within the stand (inter tree variability) – Cork thickness is highly affected by weather – Cork value may also vary among years depending on the new products that are always being developed
- 35. Cork prices structure in 2007 and 2010 2007 prices €/@ (1@ = 15 kg) Thickness (mm) 1st to 3rd 4th 5th 6th Refuge < 18 36.0 1.7 1.7 1.7 1.7 18 to 20 36.0 36.0 13.5 1.7 1.7 20 to 25 36.0 36.0 13.5 1.7 1.7 25 to 39 88.5 54.8 13.5 16.7 1.7 > 39 88.5 54.8 13.5 16.7 1.7 small pieces and virgin cork 1.7 1.7 1.7 1.7 1.7 Quality class 2010 prices €/@ (1@ = 15 kg) Thickness (mm) 1st to 3rd 4th 5th 6th Refuge < 18 13.2 0.2 0.2 0.2 0.2 18 to 20 13.2 9.6 6.0 9.2 0.2 20 to 25 13.2 9.6 6.0 9.2 0.2 25 to 39 92.6 51.0 6.0 9.2 0.2 > 39 92.6 51.0 6.0 9.2 0.2 small pieces and virgin cork 0.2 0.2 0.2 0.2 0.2 Quality class
- 36. Cork oak management in Portugal Long term optimisation (the SUBER model)
- 37. The SUBER model Is a growth and yield model for cork oak in Portugal Based on the simulation of individual tree growth Includes a module for cork growth simulation and cork weight prediction at extraction Is implemented in a user friend platform freely available on the web http://www.isa.utl.pt/cef/forchange/fctools/ It allows the comparison, on the long term, of alternative management approaches
- 42. sIMfLOR platform - graphical outputs
- 43. sIMfLOR platform - graphical outputs
- 44. sIMfLOR platform - graphical outputs
- 45. SUBER model – application Case 1 – comparing management approaches – Stand density: 136 ha-1 – Basal area: 7.76 m2 ha-1 (under bark) – Quadratic mean dbh: 28 cm – Crown cover: 40% It is a relatively young stand, “more or less” even-aged Cork rotation is 9 years, with two extractions in a 9 years period (two cork ages)
- 46. Dense stand, no grazing Net present value ha-1=16238 Combined with game Net present value ha-1=14174 Uneven-aged option Net present value ha-1=13539 0 5 10 15 20 2000 2010 2020 2030 2040 2050 Year Basalarea(m2 ha-1 ) G Gu 50 70 90 110 130 2000 2010 2020 2030 2040 2050 Year Standdensity(ha-1 ) 5 6 7 8 9 10 2000 2010 2020 2030 2040 2050 Year Meancrowndiameter(m) 30 35 40 45 50 55 2000 2010 2020 2030 2040 2050 Year Percentcrowncover 0 100 200 300 2003 2008 2012 2017 2021 2026 2030 2035 2039 2044 2048 Year Corkweight(15kg) Virgin Mature 2028 0 20 40 60 80 100 <7.5 15 25 35 45 55 65 75 85 95 Diameter class (cm) Numberoftrees(ha-1) 2052 0 20 40 60 80 100 <7.5 15 25 35 45 55 65 75 85 95 Diameter class (cm) Numberoftrees(ha-1) 0 5 10 15 20 2000 2010 2020 2030 2040 2050 Year Basalarea(m2 ha-1 ) G Gu 50 70 90 110 130 2000 2010 2020 2030 2040 2050 Year Standdensity(ha-1 ) 5 6 7 8 9 10 2000 2010 2020 2030 2040 2050 Year Meancrowndiameter(m) 30 35 40 45 50 55 2000 2010 2020 2030 2040 2050 Year Percentcrowncover 0 100 200 300 2003 2008 2012 2017 2021 2026 2030 2035 2039 2044 2048 Year Corkweight(15kg) Virgin Mature 2028 0 10 20 30 40 50 <7.5 15 25 35 45 55 65 75 85 95 Diameter class (cm) Numberoftrees(ha-1) 2052 0 10 20 30 40 50 <7.5 15 25 35 45 55 65 75 85 95 Diameter class (cm) Numberoftrees(ha-1) 2003 0 10 20 30 40 <7.5 15 25 35 45 55 65 75 85 95 Diameter class (cm) Numberoftrees(ha-1) Present status of the stand 0 5 10 15 20 25 2000 2010 2020 2030 2040 2050 Year Basalarea(m2 ha-1 ) G Gu 50 70 90 110 130 2000 2010 2020 2030 2040 2050 Year Standdensity(ha-1 ) 5 6 7 8 9 10 2000 2010 2020 2030 2040 2050 Year Meancrowndiameter(m) 30 35 40 45 50 55 60 65 70 2000 2010 2020 2030 2040 2050 Year Percentcrowncover 0 100 200 300 2003 2008 2012 2017 2021 2026 2030 2035 2039 2044 2048 Year Corkweight(15kg) Virgin Mature 2028 0 10 20 30 40 50 <7.5 15 25 35 45 55 65 75 85 95 Diameter class (cm) Numberoftrees(ha-1) 2052 0 10 20 30 40 50 <7.5 15 25 35 45 55 65 75 85 95 Diameter class (cm) Numberoftrees(ha-1)
- 47. SUBER model – applications Case 2 – cork debarking rotation Some questions: – Is 9 years the best cork extraction rotation? – Is it wise to concentrate cork extraction on every ith year? – What is the impact of increasing the intensity of debarking? Again, the SUBER model was used to give answer to these questions
- 48. 10000 11000 12000 13000 14000 15000 16000 17000 6 7 8 9 10 11 12 13 Cork extraction rotation (years) Netpresentvalue(euros) 50% 40% buisiness as usual
- 50. Workshops with forest managers and landowners
- 51. Cork oak management in Portugal Short term refining tools (users’ demand)
- 52. Stakeholders’ question Field sampling of cork quality before extraction has been implemented some years ago – from a cooperation between university and practitioners - to support the cork price negotiation
- 53. Sampling is carried out before cork extraction
- 54. Each of the 5 trees closer to the plot center is identified and measured and cork is sampled by extracting one “cala”
- 55. Field assesment of cork quality One “cala”
- 56. Cork price evaluation Cork samples are boiled Cork caliper is measured, before and after boiling Cork quality is evaluated A report is produced including: – Proportion of cork samples by cork caliper class X cork quality – An estimation of cork value (price) The field assessment of cork quality supports the landowner in the cork price negotiation
- 57. Stakeholders’ question Field sampling of cork quality before extraction has been implemented some years ago to support the cork price negotiation Stakeholders asked if the cork sampling results could be used to help them to decide if it would be wise to delay cork extraction 1 or 2 years and increasing its caliper The webCorky tool was developed to answer this question
- 58. The webCorky tool Is based on the cork module of the SUBER model
- 59. Example with a cork with 9 years Cork growth model – complete years 1st half year last half year 8 complete years (cork growth index) total cork thickness
- 60. The webCorky tool Is based on the cork module of the SUBER model Helps the forest manager/landowner to decide on the best time to debark After its implementation cork sampling is sometimes undertaken at an earlier stage (1 or 2 years from the “average” cork rotation) Is available from the web – FCTOOLS site or http://home.isa.utl.pt/~joaopalma/modelos/webcorky/
- 64. Stone pine management in Portugal
- 65. Stone pine in Portugal Pine nuts is the main product from stone pine (Pinus pinea) that occupies in Portugal 175,742 ha (6% of Portuguese forests and 20% of the world area) with an increase of 45% since 1995 Exports in 2013 were 364 Mg 12.8 million € (26.9% and 9.6% of the world total) 35 € per kg Exports represent 0.017 % of total Portuguese exports The sector has 23 companies related to the processing of nuts One tree produces up to 500 kg in one harvest (with a large variation among years – masting) One stand produces up to 8000 kg ha-1 (depending on site, stand density and tree size)
- 66. Stone pine in Portugal The management objective of stone pine stands is almost always the optimization of cone production per hectare Most of the adult stands are naturally regenerated – Even-aged – Uneven-aged – Two-storied Some of the adult stands are mixed with cork oak and/or maritime pine
- 67. 67
- 68. Stone pine in Portugal The management objective of stone pine stands is almost always the optimization of cone production per hectare Most of the adult stands are naturally regenerated – Even-aged – Uneven-aged – Two-storied Some of the adult stands are mixed with cork oak and/or maritime pine New plantations are mostly even-aged pure stands, very often grafted
- 70. Stone pine in Portugal The management objective of stone pine stands is almost always the optimization of cone production per hectare Most of the adult stands are naturally regenerated – Even-aged – Uneven-aged – Two-storied Some of the adult stands are mixed with cork oak and/or maritime pine New plantations are mostly even-aged pure stands, very often grafted Collecting the cones is not easy…
- 71. Collecting the cones is hard… Manual (most common) Mechanical (introduced recently) From: UNAC 2014 From: UNAC 2014
- 72. Getting the pine nuts
- 73. Main silvicultural treatments Initial density in new plantations Selection of genetic material Decision about grafting/not grafting Thinnings Pruning Intensification: irrigation and/or fertilization Cone harvesting methods Regeneration method in existing stands (including new plantations when they get old) and time/age to start regeneration treatments
- 74. Traditional management in Portugal Operation Correia & Oliveira 2002 Louro et al. 2002 Costa et al. 2008 Initial density 625 ha-1 500 to 600 ha-1 208 to 400 ha-1 Beating up Between one and three years after installation if applicable (plantations) Pruning Remove branches without female flowers (no prescription) Removing 1/3 of branches: -Between 8 and 12 years -Between 20 and 25 years Removing branches that do not produce female flowers: -Between 35 and 40 years -Between 50 and 60 years Removing 1/3 of branches: -Between 5 and 6 years -Between 10 and 12 years -Between 20 and 25 years Thinning -15 to 20 years: 440 ha-1 -20 to 25 years: 352 ha-1 -25 to 30 years: 281 ha-1 -35 to 40 years:225 ha-1 -5 to 6 years -20 to 25 years (no information about densities after thinning) Final density 100 ha-1 225 ha-1 100 to 120 ha-1 Final harvest 80 years 80 to 100 years No information
- 75. Developing new thinning guidelines Permanent plots started to be established in 2004 There is now a large data set that is being used – To review the silviculture guidelines – To develop growth and yield models
- 76. Stand density –permanent plots data Higher cone production in trees with large diameter and crown width The heterogeneity is mainly due to masting In each year plots with very big sparse trees are always the ones with higher cone production per hectare 0 100 200 300 400 500 600 0 15 30 45 60 75 90 105 120 135 150 Treeconeproduction(kg) Diameter at breast height (cm) 0 100 200 300 400 500 600 0 2 4 6 8 10 12 14 16 18 20 22 24 26 Treeconeproduction(kg) Crown diameter (m)
- 77. 0 1000 2000 3000 4000 5000 6000 7000 8000 2 6 10 14 18 22 26 30 Coneweight(kgha-1) Basal area class (m2 ha-1) Even-aged 0 1000 2000 3000 4000 5000 6000 7000 8000 2 6 10 14 18 22 26 30 Coneweight(kgha-1) Basal area class (m2 ha-1) Uneven-aged – two storied 0 1000 2000 3000 4000 5000 6000 7000 8000 2 6 10 14 18 22 26 30 Coneweight(kgha-1) Basal area class (m2 ha-1) Uneven-aged – selection forests 0 1000 2000 3000 4000 5000 6000 7000 8000 2 6 10 14 18 22 26 30 Coneweight(kgha-1) Basal area class (m2 ha-1) All stand structures Cone production increases till a basal area of 14 and start to decrease after 18 m2ha-1 Thinning should take place to avoid basal areas > 18 m2ha-1 Stand density –permanent plots data
- 78. Cone quality may be evaluated by mean cone weight (big cones origine more pine nuts with bigger dimensions) Mean cone weight decreases with basal area, mostly after 14 m2ha-1 0 50 100 150 200 250 300 350 400 450 500 2 6 10 14 18 22 26 30 Aveageweightofacone(g) Basal area class (m2 ha-1) Even-aged 0 50 100 150 200 250 300 350 400 450 500 2 6 10 14 18 22 26 30 Aveageweightofacone(g) Basal area class (m2 ha-1) Uneven-aged – two storied 0 50 100 150 200 250 300 350 400 450 500 2 6 10 14 18 22 26 30 Aveageweightofacone(g) Basal area class (m2 ha-1) Uneven-aged – selection forests 0 50 100 150 200 250 300 350 400 450 500 2 6 10 14 18 22 26 30 Aveageweightofacone(g) Basal area class (m2 ha-1) All stand structures Stand density –permanent plots data
- 79. Cone production decreases with number of trees per ha Higher productions occur in very sparse stands (15-30 trees ha-1), despite the stand structure Stand density –permanent plots data
- 80. Stand density – some conclusions from pp The plots with higher production in even-aged stands have a basal area between 14-18 m2 ha-1, but cone quality decreases after 14 m2 ha-1 The number of trees needed to get higher cone productions per hectare in Portugal is much less than the referred in the traditional guidelines For the higher dg classes in average it is possible to achieve more cone production in even-aged stands than in uneven-aged ones. Cone production decreases even more if a stand structure near selection forest is considered On average, it is possible to attain more cone production per hectare in Portugal than in Spain
- 81. Thinning guidelines Stands must be thinned when basal area is close to 14 m2 ha-1 Basal area after thinning should be around 8 m2 ha-1 to avoid an excessive number of thinnings
- 82. Stone pine management in Portugal Long term optimisation (the PINEA.pt model)
- 83. The PINEA.pt model The Pinea.pt model is an individual tree model It is implemented in standsSIM, na interface similar to the one for the SUBER model A first version developed with diameter growth from incremente bores is available A new version of the PINEA.pt model is on-going
- 84. Application Simulation of an even-aged yound stand – N=270 ha-1 – hdom=5.5 m – ddom=18.4 cm – G=5.89 m2 This stand was simulated for 50 years, using several thinnings based on basal area – Apply thinning whenever G>Glim*1.1, in order to maintain a G value around Glim (Glim=5, 10, 15, 20, 30 m2ha-1)
- 85. Application – comparision of G developement Basalarea(m2ha-1) Age (years from planting)
- 86. Application – comparision of N development Age (years from planting) Numberoftreesperha(m2ha-1)
- 87. Application – comparision of dg development Age (years from planting) Quadraticmeandbh(cm)
- 88. Application – comparision of cone production Age (years from planting) Coneweight(kgha-1)
- 89. Application – comparision of cone production Age (years from planting) Coneweight(kaha-1)
- 90. Application – comparision of VAL Netpresentvalue(euros) Threshold basal area (m2 ha-1)
- 91. Stone pine management in Portugal Short term decisions (users’ demand)
- 92. Sampling to estimate nuts “yield” The product sold by the landowners is the cones The price is fixed between the buyer and the landowner taking the “yield” into account The “yield” is the ratio (healthy pine nuts weight)/(cones weight) The landowners asked for the development of a sampling scheme to estimate the nuts “yield” One of the difficulties is the estimation of healthy pine nuts weight, as they are inside the shells and it is not an easy task to extract them!
- 95. Sampling to estimate nuts “yield” The on-going research aims at developing a methodology to estimate healthy pine nuts weight without “opening” the pine nuts shells The methodology is based on: – Sampling trees with a procedure similar to the one used for cork quality assessment (how many plots? how many trees per plot?) – the analysis of Xrays of all the shelled pine nuts from each sampled tree
- 96. Sampling to estimate nuts “yield”
- 97. Sampling to estimate nuts “yield”
- 98. Sampling to estimate nuts “yield”
- 99. Sampling to estimate nuts “yield” The on-going research aims at developing a methodology to estimate healthy pine nuts weight without “opening” the pine nuts shells The methodology is based on: – Sampling trees with a procedure similar to the one used for cork quality assessment (how many plots? How many trees per plot?) – the analysis of Xrays of all the shelled pine nuts from each sampled tree – Estimate the weight of the nuts classified as healthy through a regression of weight on some measurements (length and width) automatically taken from the Xray
- 100. Main conclusions
- 101. Main conclusions The relevance of the tools presented here (G&Y models SUBER and PINASTER.pt model) are unquestionnable Long term optimisation is useful to support strategic decisions But the landowner has a clear advantage in using an adaptive management concept based on short term decision support tools such as WebCorky Tools to support negotiation of product price can become very useful Cork oak landowners must replace fixed silvicultural guidelines by the use of flexible tools that help them to adapt management to on-going conditions leading to an optimisation of benefits
- 102. Thank you!