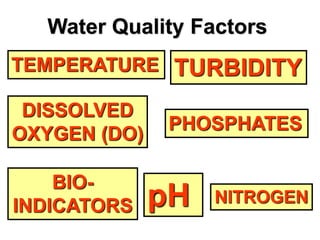
2. Water Quality – Guided Notes
- pH level
- temperature (thermal pollution)
- turbidity
- bio-indicators
- dissolved oxygen
- salinity
- phosphates and nitrates (Phosphorous and
Nitrogen)
3. Water Quality – Dissolved oxygen
- The amount of oxygen (yes the gas)
dissolved into water. It gets there by rapid
movement of water, diffusion, and as a
byproduct of photosynthesis!
4. Water Quality – Salinity
How much salt is
in water, should
know this.
PPT means parts
per thousand.
For example, if in
1000 grams of
water, there are
30 grams of salt,
it’s ocean water!
5. Water Quality – Thermal pollution
- Changing the water quality by adding
heated water to a non-heated water source.
6. TEMPERATURE
EFFECTS:
changes rate of photosynthesis
changes rate of respiration
changes DO in water
cold water holds more DO
hot water holds less DO
changes sensitivity of organisms to toxic
waste, parasites, disease.
7. TEMPERATURE
• Thermal pollution = adding warm water to
cold water.
CAUSES OF THERMAL POLLUTION:
• Industry (nuclear power plants, paper
mills)
• Urban Development (storm water runoff,
construction, soil erosion)
8. Temperature affects the oxygen-
carrying capacity of water.
Rapid temperature change and
temperature extremes can stress
aquatic organisms.
As the water warms, the
amount of dissolved
oxygen decreases.
14 Dissolved Oxygen (ppm)
12
10
8
6
4
____________________________________
Winter Summer
10. DISSOLVED OXYGEN (DO)
TO INCREASE DO:
• Much of DO comes from atmosphere
• Some of DO comes from photosynthesis
TO DECREASE DO:
• Add pollution
• Add organic waste
11. ORGANIC WASTE = LOW DO
• Organic waste = parts of once living things
EXAMPLES OF ORGANIC WASTE:
Sewage
Farm runoff
Discharge from food processing plants
12. HOW RAW SEWAGE LOWERS
DO
RAW SEWAGE GOES INTO WATER:
1. Decomposers chow down
2. Decomposers take up oxygen
3. Decomposers reproduce, taking up more
oxygen
4. No more oxygen for other animals
5. Nothing left but decomposer & sewage-
filled water.
16. Water Quality – pH level
- pH stands for the potential of Hydrogen in
water.
- Here’s the pH scale:
17. pH
• pH = measure of concentration of
hydrogen ions in a substance
• Tells whether substance is:
ACID
BASE
NEUTRAL
18. pH
Measured on scale from 0 to 14
0 = highly acidic (HCl)
7 = neutral (pure water)
14 = highly basic (bleach)
Seawater pH ranges from 7.5 – 8.5
Average pH of ocean water = 7.8
pH of natural water = 6.5 – 8.5
Optimal range for life = 6.5 – 8.2
22. ALKALINITY
Alkalinity refers to the water’s
ability to neutralize acids.
Alkalinity is
produced by
minerals such as
limestone.
Limestone is a type of ocean
sediment composed of calcium
carbonate.
23. Limestone bedrock areas often
have caves and sinkholes, known
as Karst.
Water with low
alkalinity is
usually
acidic.
24. Ammonia
Ammonia is produced by the
decay of organic matter and
animal waste.
Ammonia is toxic to most
aquatic life, especially at high
pH.
Bacteria readily convert
ammonia to nitrate.
(a plant nutrient)
26. pH
SOURCES OF LOW pH IN WATER:
• Acid rain is cause of acid in
thousands of lakes
• Burning fossil fuels has increased
acid rain
EFFECTS OF LOW pH IN WATER:
• Low pH directly kills fish
• pH < 5, most fish eggs die
27. Water Quality – Phosphates and Nitrates
- Runoff, fertilizer, eutrophication...
28. NITROGEN
• Living organisms need nitrogen to
make proteins
• Nitrates (NO3) & Nitrites (NO2) are
compounds made of nitrogen &
oxygen
• Some nitrogen in water is good
• The wrong amount is bad
29. NITROGEN
SOURCES OF NITROGEN IN WATER:
Human & animal waste
fertilizer
EFFECTS OF TOO MUCH NITROGEN:
Lowers dissolved oxygen (DO).
30. NITROGEN – EUTROPHICATION
Q: How does Nitrogen reduce the amount of DO?
A: Eutrophication
• Nitrogen feeds algae (green stuff)
• Algae grows & grows
• Algae blocks sunlight
• Underwater plants die
• Algae die and decompose
• The decomposition takes up oxygen
• No DO for organisms, so they die
33. PHOSPHATES
• Phosphorus is an element like hydrogen
or oxygen
• Phosphorus combines with other things to
make phosphates
• Essential for living things
• Usually present in very small amounts
• Too much is bad
41. TOTAL SUSPENDED SOLIDS
(TSS)
TSS is the measure of the
sediment suspended in the
water.
TSS is related to turbidity.
Water with high TSS usually has
high Total Dissolved Solids (TDS)
as well.
42. A secchi disk is one type of
instrument used to measure
turbidity.
44. TURBIDITY
• Measures clearness of
water
• Murky water = greater
turbidity
• Caused by solids
blocking sunlight
• Measured using a
Secchi disk or turbidity
meter
47. BIO-INDICATORS
• Bio-indicators = organisms that help
determine health of water.
• Presence or absence tells something
about the water.
• Not always an accurate way to measure
water quality.
• Accurate in telling environmental stress
50. Levels: Bio-indicators
High level of variety: healthy water source
Small level of variety: poor water source (indicator of
high levels of pollution)
51. Causes: Bio-indicators
Causes of changes in bio-
indicators:
Pollution that results in
changes in pH,
temperature, dissolved
oxygen, or nitrate levels
52. Results: Bio-indicators
Results of few varieties of bio-indicators present: the
lack of a large number of different varieties of bio-
indicators is indicative of pollution
55. TOXIC CHEMICALS
Toxic chemicals usually come
from industry and energy
production.
The effects are often not known
until years after they have entered
the environment.
56. Toxic chemicals include
heavy metals (lead,
mercury), organic
compounds (DDT, PCB),
inorganic substances
(arsenic) and others.