SlideShare a Scribd company logo
1 of 49
How important is the “social” in
social networking? A perceived
value empirical investigation
Mihail Cocosila
Faculty of Business, Athabasca University, Athabasca, Canada,
and
Andy Igonor
JR Shaw School of Business, Northern Alberta Institute of
Technology,
Edmonton, Canada
Abstract
Purpose – The purpose of this paper is to report on a value-
based empirical investigation of the
adoption of Twitter social networking application. The
unprecedented popularity of social networking
applications in a short time period warrants exploring theory-
based reasons of their success.
Design/methodology/approach – A cross-sectional survey-based
study to elicit user views on
Twitter was conducted with participants recruited through the
web site of a North-American university.
Findings – All facets of perceived value considered in the study
(utilitarian, hedonic and social) had
a significant and relatively strong influence on consumer intent
to use Twitter. Quite surprisingly for a
social networking application, though, the social value facet had
comparatively the weakest contribution
in the use equation.
Research limitations/implications – User value perception might
have been influenced by the
features of the actual social networking application under
scrutiny (i.e. Twitter in this case).
Practical implications – To maximize the chances of success of
new social networking applications,
developers and marketers of these media should focus on the
hedonic and utilitarian sides of their
perceived value.
Social implications – Additional efforts are necessary to better
understand the reasons and factors
leading to a comparatively lower social value perception of a
social networking application, compared
to its hedonic and utilitarian values.
Originality/value – Overall, the study opens the door for
investigating user perceptions on popular
social networking applications in an effort to understand the
unparalleled success of these services in a
short time period.
Keywords Perceptions, Social media, Technology adoption,
Social networking, Perceived value,
Twitter, User satisfaction
Paper type Research paper
1. Introduction
Social networking applications recorded an unprecedented
success in just few of the
recent years. For instance, people in the USA have been
spending 22 per cent of
the time they are online on social media sites while nine million
users in Australia have
been spending almost nine hours per month, on average, using
top social media
applications (Wikipedia, 2012). Despite these astonishing
figures, the social networking
domain is still little understood. Definitions and borders of the
social networking (also
called social media) phenomenon are still under debate.
However, scholars seem to
agree that content generated by users is the key feature of any
social networking
application. For instance, some conceptualization attempts
define social media as “a
group of Internet-based applications that build on the
ideological and technological
Information Technology & People
Vol. 28 No. 2, 2015
pp. 366-382
© Emerald Group Publishing Limited
0959-3845
DOI 10.1108/ITP-03-2014-0055
Received 19 March 2014
Revised 19 August 2014
6 October 2014
Accepted 30 October 2014
The current issue and full text archive of this journal is
available on Emerald Insight at:
www.emeraldinsight.com/0959-3845.htm
This research was supported by a grant from Athabasca
University.
366
ITP
28,2
foundations of Web 2.0, and that allow the creation and
exchange of User Generated
Content” (Kaplan and Haenlein, 2010).
The exponential growth of the number of users and of the
frequency of use of these
applications together with the still not enough understood
influence on various
domains of human interaction (Gruzd et al., 2012; Shneiderman
et al., 2011) attracted a
justified interest from both the business community and the
academia. While business
decision makers are exploring ways to turn this phenomenon
into profits, academia
is seeking to investigate through theory-based approaches the
reasons for this
tremendous success (Abedniya and Mahmouei, 2010; Culnan et
al., 2010; Spaulding,
2010; Zhao and Lu, 2012).
As it is well-known from information systems (IS) research that
user perceptions are,
further than business or technical aspects, the key factor
determining the success or
failure of any new information technology (IT) application
(Venkatesh et al., 2002), an
interesting topic of research is to look at social networking
applications from a
technology acceptance point of view in order to understand their
social penetration.
Out of several possibilities of theoretical investigation
examined by previous research
(Al-Debei et al., 2013; Gruzd et al., 2012; Hargittai, 2007;
Sinclaire and Vogus, 2011;
Turel and Serenko, 2012; Xu et al., 2012), applying perceived
value models seems to be
particularly interesting since individuals are presumably using
an IT application only
if this has value for them. Perceived value concept is, thus,
broader than business
value that captures measurable benefits mainly (Culnan et al.,
2010). Furthermore, value
perception allows a more granular investigation as it captures
and ranks individuals’
views from several perspectives. For these reasons perceived
value approach has been
used in IS research as a possible way to understand the adoption
of other new (but fast
becoming widely popular) IT artifacts like cell phone value-
added services (Turel et al.,
2007, 2010).
The research reported here focuses on one of the most popular
and frequently used social
networking applications, Twitter, available at Twitter.com, in
an effort to understand its
user success through a theoretical lens. An empirical research
investigating the role of a
multi-sided perception of Twitter’s value in the use of this
application was conducted with
participants familiar with Twitter that were recruited through
the web site of a university in
North America. This paper reports on that research as follows:
next two sections describe
the theoretical background and the proposed research model.
Following that, research
methodology and main results are presented. A discussion
section concludes the paper.
2. Theoretical background
Investigating factors of adoption of new information
technologies or applications has been
a traditional area of research in IS. In addition to the popular
models and theories
validated in various studies (for a detailed review, see
Venkatesh et al., 2002 study), a
relatively newer approach has been to examine the adoption of
an IT from a value
perspective. This path was adapted from other disciplines like
consumer behaviour or
economics where value is used to explain why people buy some
things or opt to make
some expenses (Turel et al., 2010). Value is considered to
source from the actual interaction
with (or expected use of) a product or service and to reflect an
overall perception upon
their importance for an individual. Thus, following a rationale
borrowed from consumer
behaviour, value is captured as a perceived value concept
through individual views on the
difference between “what is received and what is given”
(Zeithaml, 1988).
Although value in marketing was traditionally associated with
the perception of the
utility of a product or service, more recent research using
perceived value in other
367
A perceived
value
empirical
investigation
disciplines, including IS, acknowledged this construct to be
multi-sided (Lee et al., 2002;
Turel et al., 2007, 2010). Although the multi-dimensionality
seems to better capture the
complexity of the concept, there are no unanimous opinions on
the actual facets of
perceived value. A review of literature stemming from
consumer behaviour research
shows some of the most popular components of perceived value
of an object or service
to be the following (Bolton and Drew, 1991; Kim et al., 2007;
Sweeney and Soutar, 2001;
Sheth et al., 1991):
• functional or utilitarian (i.e. perception of utility associated
with the use);
• emotional or hedonic (i.e. state of mood associated with the
use);
• monetary or value-for-money (i.e. utility compared to the cost
usage involves);
and
• social (i.e. self-perception of social status associated with the
use).
Due to its complexity and multi-sided approach, perceived value
is a possible lens to
investigate the adoption of social networking applications that
became overwhelmingly
popular in recent years. Twitter micro-blogging service,
allowing users to post 140-
character long messages on their daily activities or opinions
(Zhao and Rosson, 2009), is a
typical example of success and, hence, an interesting avenue
worth researching. Since its
launch in 2006 this service grew exponentially thus reaching in
early 2011 about 130
million postings (or “tweets”) per day and even 3,000 per
second during major events
worldwide (Wakefield, 2011).
Among various attempts to understand the success of this social
media platform
from various angles, it would be interesting to investigate the
role of the value users
perceive in Twitter on their adoption intention as it is well -
known in IS research that
user perceptions are a key ingredient of the adoption equation.
The use of a multi-sided
value approach would allow also seeing whether social reasons
are the main motivator
of social media use, as opinions expressed on the internet often
assume. Therefore, this
study proposes the following research question:
RQ1. What is the order of importance of the key facets of
perceived value that
influence the adoption of Twitter social networking application?
3. Research model
To investigate the perceived value of Twitter, this study
proposes a multi-faceted
perceived value construct sourcing from consumer behaviour
and IS research. This
multi-dimensional value perception should have a positive
influence on the intention to
use the social medium since people would use a service if they
perceive it as valuable
for various reasons (Ho and Ko, 2008). Taking into the account
of the above, the
following hypothesis is proposed:
H1. The overall perceived value of Twitter social networking
application will have a
positive effect on the behavioural intention to use this
application.
A consistent body of research identified three facets of
perceived value, as discussed in
the section above: utilitarian, hedonic and social (Brown and
Venkatesh, 2005; Kim and
Han, 2009; Kim et al., 2005). Some studies also include the
monetary side borrowed from
consumer behaviour as a distinct facet (Turel et al., 2010) or as
a component of the
utilitarian side (Rintamäki et al., 2006). As the use of social
media, including Twitter,
does generally not imply a fee or monetary expense, this
research will, hence, consider
368
ITP
28,2
only the utilitarian, hedonic and social sides of perceived value
as being significant.
Therefore, users would perceive a value in this social media
application if using it is
observed to help accomplish some utility needs, to be a source
of entertainment, and to
meet social goals. To measure these aspects, following the
example of similar work
(Turel et al., 2007, 2010), perceived value is conceptualized as
a second-order construct
with three facets. Accordingly, the following hypotheses are
formulated:
H2-1. The utilitarian dimension of perceived value of Twitter
social networking
application will have a positive effect on the overall perceived
value of
this application.
H2-2. The hedonic dimension of perceived value of Twitter
social networking
application will have a positive effect on the overall perceived
value of
this application.
H2-3. The social dimension of perceived value of Twitter social
networking
application will have a positive effect on the overall perceived
value of
this application.
As virtually all discussions in the media presume with
consistency that the success of
social networking applications reside mostly in their social
implications, both in an
individual and business context (Lorenzo-Romero et al., 2011),
social facet of the
perceived value is expected to be predominant in the adoption
equation. Accordingly,
in the attempt to identify at a granular level the key social
aspects in the adoption
equation, similar to previous research (Kwon and Wen, 2010),
this research looks with
magnifying lenses at the social dimension of perceived value.
Previous research
indicated enhancement of status (i.e. impression the individuals
give to others) (Brown
and Venkatesh, 2005; Rintamäki et al., 2006) and of self-esteem
(i.e. one’s concept of self)
(Rintamäki et al., 2006) as possible factors influencing
perceived social value. These are
conceptualized in the present study as image, that is an
adaptation from Venkatesh and
Davis (2000) and expresses individuals’ perception of their
status in the social network.
Another social aspect of using the IT put in light by previous
research is group
integration (i.e. socialization by belonging to groups) (Lee et
al., 2002). Theoretical
reasoning shows this feeling is captured partially through image
and partially through
perceived social presence. This latter is defined as individuals’
ability “to project
themselves socially and affectively into a community” of users
(Rourke et al., 1999), was
taken into account in earlier IS research on traditional media
(Yoo and Alavi, 2001) and
is thought to be important for social media (Xu et al., 2012).
It is believed that the above two factors would capture the
enhancement of status
sourcing from the individual perspective of the social
environment. In addition to the
above, to complete the picture, we suggest that two other
factors may determine
perceived social value by capturing the enhancement of self-
concept because of the
influence of the social environment on an individual: critical
mass and social norm.
Perceived critical mass, understood as a minimum level of users
adopting an IT
innovation after which “its further rate of adoption becomes
self-sustaining” (Van Slyke
et al., 2007), was shown to be an important factor of the
adoption of the new IT (Hsu and
Lu, 2004; Kumar and Benbasat, 2006). Since perceived critical
mass depends on the
number of users already using the system (hence this is an
indicator of the social
“success” of a system), it is considered as an antecedent of the
perceived social value.
Social norm (or subjective norm) is the social influence
regarding the use of a new
system. This represents “the degree to which an individual
perceives that important
369
A perceived
value
empirical
investigation
others believe he or she should use the new system” (Venkatesh
et al., 2003) and is an
essential side of the social aspects of using a new IT (Dickinger
et al., 2008). Taking into
the account all of the above, the following hypotheses are
formulated:
H3-1. Image of users of Twitter social networking application
will have a positive
effect on the social dimension of the overall perceived value of
this application.
H3-2. Perceived social presence of users of Twitter social
networking application
will have a positive effect on the social dimension of the overall
perceived
value of this application.
H3-3. Perceived critical mass of users of Twitter social
networking application will
have a positive effect on the social dimension of the overall
perceived value of
this application.
H3-4. Social norm exerted on users of Twitter social networking
application will
have a positive effect on the social dimension of the overall
perceived value of
this application.
The theoretical model and associated hypotheses are captured in
Figure 1.
4. Methodology
Model and hypotheses were tested through a cross-sectional
experiment comprising an
online survey. To ensure reliable psychometric properties,
survey questions measuring
the items of the latent variables were adapted from measures
previously validated in
consumer behaviour and IS research, as reported in top
publications (Cyr et al., 2009;
Kim and Han, 2009; Turel et al., 2007; Van Slyke et al., 2007;
Venkatesh and Davis,
2000). Survey measures and their related constructs are
presented in the Appendix.
Perceived
Overall
Value
Behavioral
Intention
Utilitarian
Value
Hedonic
Value
Social
Value
Image
Social
Presence
Social
Norm
Second Order
H2 -1
H2 -2
H2 -3
H3 -1 H3 -2 H3 -3 H3 -4
H1
Critical
Mass
Figure 1.
Theoretical model
and hypotheses
370
ITP
28,2
Participants were recruited through announcements posted on
the main web page of
the Faculty of Business of a North-American university.
Including conditions required
interested participants to be at least 18 years old and be familiar
with Twitter without
necessarily having an account with this service. Participation
was anonymous and
respondents were not compensated for completing the survey.
The survey was offered online to all individuals who self-
reported meeting the
including conditions and were willing to participate. As the
research targeted a dynamic
IT domain, in order to ensure homogeneity of the data collected
the survey instrument
were available online for three months in the first half of the
year 2012. This survey was
part of a larger data collection process conducted in the same
setting.
5. Main findings
A total of 134 valid responses were recorded at the end of the
three-month data
collection. A demographic analysis indicated that respondents
were 39.0 years old on
average, 60.8 per cent female and 39.2 per cent male.
Participants reported having an
average experience with Twitter of 1.6 years and checking the
service 20.1 times a
week, on average. A per cent of 61.2 of the respondents
reported having a Twitter
account, 28.4 per cent not having an account, while the rest of
10.4 per cent preferred
to not answer this question. Participants having an account
reported posting 10.2
messages per week, on average. They were following (i.e.
subscribing to the posts of)
84.8 accounts and were having 82.7 followers, on average. All
134 participant valid
responses were subjected to the data analysis.
Data collected were first subjected to a test for non-response
bias. Following the
example of previous research, this test was performed by
comparing the key
demographics of early to those of late responders (Dimoka et
al., 2012; Sun et al., 2009).
Averages for age, gender, Twitter experience and activity did
not significantly differ
between the two groups and, therefore, non-response bias was
not considered an issue.
A second step in the assessment of the quality of the data
collected were to test on the
existence of common method variance (CMV). Tests to,
possibly, identify CMV appeared
necessary since all variables in the model were measured
through self-reported data
collected in the same one-step survey (Sharma et al., 2009). A
Harman’s one-factor test was
conducted following Podsakoff et al. (2003). All measured
items of the theoretical model
were subjected to an exploratory factor analysis with no rotation
in SPSS. The solution
produced four factors with eigenvalues larger than 1.0, with the
smallest one being 1.183.
These four factors accounted for 76 per cent of the variance,
with the first factor alone
explaining 57 per cent, hence variables in the model load on
more than one factor. A second
test to detect possible CMV was conducted according to Pavlou
et al. (2007). Thus, a visual
inspection of the correlations of the model variables indicated
the highest value to be 0.84
(Table IV), hence below the threshold of 0.90. Results of these
two tests allow some
confidence that there is no systematic CMV bias in the data
(Turel and Serenko, 2012).
Main data analysis were done with partial least squares (PLS)
modelling method as this is
suitable for small sample size exploratory models (Bontis,
1998), including those containing
formative indicators (Thomas et al., 2005). Perceived overall
value was measured as
second-order latent variable using a repeated indicators
approach (Lohmoller, 1989).
5.1 Measurement model evaluation
Evaluation of the measurement model was done with SmartPLS
(Ringle et al., 2005).
A first run of the software indicated the necessity to eliminate
two items (pertaining to
utilitarian value and social value, respectively) out of the total
of 29 of the entire
371
A perceived
value
empirical
investigation
model due to poor item-to-construct loading values. After re-
running the program, all
reflective constructs for both samples displayed composite
reliability and Cronbach’s α
values above 0.7 and average variance extracted (AVE) values
above 0.5, as indicated
in Table I. All first-order factor loadings were above 0.7, all
items were significant at a
level better than 0.05 (since t-valueW1.96), and all item errors
were generally small, as
Table II shows. Thus, based on the results captured in Tables I
and II, the measurement
Construct Composite reliability Cronbach’s α AVE
Behavioural intention 0.992 0.984 0.984
Perceived critical mass 0.921 0.884 0.744
Hedonic value 0.965 0.954 0.845
Image 0.919 0.868 0.791
Perceived social presence 0.939 0.918 0.754
Social value 0.966 0.947 0.904
Social norm 0.965 0.928 0.933
Utilitarian value 0.979 0.968 0.939
Table I.
Reliability measures
for first-order
constructs
Component Factor loading SE t-Statistic
BI1←behavioural intention 0.992 0.004 239.790
BI2←behavioural intention 0.992 0.005 218.917
HV1←hedonic value 0.935 0.014 65.185
HV2←hedonic value 0.934 0.018 52.779
HV3←hedonic value 0.854 0.049 17.494
HV4←hedonic value 0.937 0.016 59.081
HV5←hedonic value 0.935 0.016 58.848
I1←image 0.901 0.023 40.036
I2←Image 0.920 0.019 48.708
I3←image 0.845 0.064 13.130
PCM1←perceived critical mass 0.877 0.029 30.815
PCM2←perceived critical mass 0.926 0.022 41.786
PCM3←perceived critical mass 0.791 0.058 13.730
PCM4←perceived critical mass 0.850 0.047 18.192
PSP1←perceived social presence 0.904 0.025 35.654
PSP2←perceived social presence 0.825 0.071 11.677
PSP3←perceived social presence 0.830 0.048 17.403
PSP4←perceived social presence 0.912 0.018 50.444
PSP5←perceived social presence 0.868 0.038 23.069
SN1←social norm 0.969 0.008 118.585
SN2←social norm 0.962 0.013 74.850
SV1←social value 0.931 0.022 41.677
SV2←social value 0.963 0.012 78.133
SV4←social value 0.958 0.012 79.605
UV2←utilitarian value 0.975 0.009 109.164
UV3←utilitarian value 0.980 0.005 180.789
UV4←utilitarian value 0.952 0.014 68.311
Notes: PSP, perceived social presence; SN, social norm; I,
image; PCM, perceived critical mass;
UV, utilitarian value; HV, hedonic value; SV, social value; BI,
behavioral intention. 1-5, item number
Table II.
Item loading and
significance levels
for first-order
constructs
372
ITP
28,2
model was considered to have appropriate reliability and
convergent validity (Bontis,
2004; Fornell and Larcker, 1981; Jarvenpaa et al., 2004).
The following test consisted of examining the matrix of
loadings and cross-loadings
for first-order constructs produced by SmartPLS. As this matrix
shows (Table III), the
measurement model has appropriate discriminant validity
because items load more on
the latent variables they pertain to than on the other constructs
(Gefen and Straub,
2005). This conclusion is reinforced by a visual inspection of
the matrix in Table IV that
displays the square root of AVEs for all first-order constructs
on the diagonal and the
construct correlations off diagonal. Since diagonal numbers are
larger than all off
diagonal numbers on the respective rows and columns, the
condition for appropriate
discriminant validity is met (Gefen and Straub, 2005).
To test for possible multicollinearity problems, a variance
inflation factor (VIF) was
calculated for all relevant constructs by regressing each
independent variable on the
remaining antecedents of an endogenous variable. Since the
VIFs for the four
antecedents of social value were below 2.5 and those for the
perceived overall value
components did not exceed 4.5, hence below the threshold value
of 5 (Hair et al., 2009),
multicollinearity is not considered an issue for the measurement
model. Confidence
in appropriate discriminant validity is further increased by all
AVE values being
above 0.5 (Table I) and all inter-construct correlations being
below 0.9 (Table IV)
(Pavlou et al., 2007).
Behavioural
intention
Perceived
critical mass
Hedonic
value Image
Perceived
social presence
Social
value
Social
norm
Utilitarian
value
BI1 0.992 0.589 0.845 0.539 0.572 0.642 0.480 0.788
BI2 0.992 0.563 0.828 0.507 0.550 0.612 0.441 0.774
HV1 0.806 0.635 0.935 0.538 0.637 0.608 0.496 0.846
HV2 0.807 0.592 0.934 0.557 0.618 0.655 0.551 0.828
HV3 0.717 0.507 0.854 0.391 0.490 0.534 0.283 0.735
HV4 0.793 0.581 0.937 0.565 0.527 0.739 0.537 0.729
HV5 0.749 0.534 0.935 0.468 0.517 0.673 0.475 0.677
I1 0.417 0.567 0.479 0.901 0.524 0.730 0.660 0.530
I2 0.570 0.577 0.506 0.920 0.625 0.697 0.645 0.561
I3 0.417 0.541 0.490 0.845 0.505 0.549 0.518 0.466
PCM1 0.419 0.877 0.459 0.572 0.622 0.546 0.439 0.526
PCM2 0.498 0.926 0.559 0.515 0.601 0.488 0.380 0.586
PCM3 0.693 0.791 0.647 0.545 0.568 0.514 0.424 0.661
PCM4 0.381 0.850 0.471 0.538 0.503 0.444 0.467 0.456
PSP1 0.599 0.630 0.581 0.540 0.904 0.542 0.488 0.643
PSP2 0.418 0.501 0.423 0.427 0.825 0.421 0.301 0.519
PSP3 0.532 0.560 0.579 0.468 0.830 0.492 0.378 0.592
PSP4 0.454 0.610 0.534 0.629 0.912 0.617 0.534 0.554
PSP5 0.453 0.592 0.513 0.602 0.868 0.519 0.491 0.574
SN1 0.449 0.497 0.506 0.673 0.518 0.647 0.969 0.455
SN2 0.449 0.460 0.484 0.659 0.473 0.584 0.962 0.477
SV1 0.548 0.535 0.654 0.705 0.571 0.931 0.598 0.504
SV2 0.630 0.588 0.665 0.730 0.596 0.963 0.639 0.577
SV4 0.624 0.535 0.676 0.701 0.553 0.958 0.584 0.582
UV2 0.777 0.606 0.786 0.561 0.625 0.549 0.477 0.975
UV3 0.754 0.635 0.794 0.563 0.632 0.547 0.453 0.980
UV4 0.758 0.648 0.833 0.581 0.670 0.599 0.471 0.952
Table III.
Loadings and
cross-loadings for
first-order constructs
373
A perceived
value
empirical
investigation
5.2 Structural model evaluation
As the measurement model evaluation indicated appropriate
reliability and construct
(i.e. convergent and discriminant) validity levels for all first-
order constructs, evaluation
of the structural model came next. Results of this evaluation are
depicted in Table V and
Figure 2.
Table V and Figure 2 indicate that five out of the eight
hypotheses made were
confirmed. Perceived overall value is a key antecedent of the
intention to use the
social networking application explaining 72.8 per cent of the
variance of the latter.
All three facets of perceived value are significant components
in the second-order
construct (at a level p-valueo0.001) with moderately high values
of the path
coefficients: between 0.26 and 0.51. Analysis of the total
effects of first-order
constructs on the behavioural intention provided by SmartPLS
and captured in
Table VI confirms that hedonic value is the most important
value facet in the
adoption equation: its total effect coefficient is 0.438 compared
with 0.275 for
the utilitarian value and 0.226 for the social value.
All demographic characteristics collected about the sample
respondents were tested
as possible control variables by assessing their path coefficients
to the endogenous
variables of the model. Each variable was added to the model
and SmartPLS was rerun
every time. No changes in the measurement model were noticed.
Structural changes
were noticed in only two situations:
(1) having a Twitter account had a path coefficient of 0.106
(significant at the 0.01
level) to the behavioural intention and increased the R2 of this
latter from 0.728
to 0.739; and
BI PCM HV I PSP SV SN UV
BI 0.992
PCM 0.581 0.863
HV 0.843 0.621 0.919
I 0.528 0.631 0.551 0.889
PSP 0.566 0.669 0.608 0.621 0.868
SV 0.632 0.582 0.700 0.749 0.603 0.951
SN 0.464 0.496 0.513 0.690 0.514 0.639 0.966
UV 0.788 0.650 0.831 0.587 0.663 0.584 0.482 0.969
Notes: PSP, perceived social presence; SN, social norm; I,
image; PCM, perceived critical mass;
UV, utilitarian value; HV, hedonic value; SV, social value; BI,
behavioural Intention
Table IV.
Square-root AVEs
and correlation
coefficients for first-
order constructs
Hypothesis Path Path coefficient SE t-Statistic p-Value
H1 Perceived value→behavioural intention 0.853 0.036 23.761
o0.001
H2-1 Utilitarian value→perceived value 0.322 0.014 23.016
o0.001
H2-2 Hedonic value→perceived value 0.513 0.017 30.757
o0.001
H2-3 Social value→perceived value 0.264 0.014 19.119 o0.001
H3-1 Image→social value 0.460 0.134 3.420 o0.001
H3-2 Perceived social presence→social value 0.157 0.118 1.335
0.184
H3-3 Perceived critical mass→social value 0.089 0.109 0.816
0.416
H3-4 Social norm→social value 0.197 0.124 1.583 0.116
Table V.
Path coefficients,
standard errors and
significance levels
374
ITP
28,2
(2) the frequency of checking Twitter had a path coefficient of
0.180 (significant
at the 0.05 level) to the perceived social value and increased the
R2 of this latter
from 0.617 to 0.647.
To further investigate the possible influence of not having a
Twitter account,
responses from this category of participants were removed from
the initial sample
and the entire analysis described above was repeated for the
resulting sample of
96 participants. Following that, a path-by-path comparison was
done by evaluating
a t-statistic of the absolute difference between the
corresponding path coefficients in
the two cases – i.e., full sample and reduced sample (Ahuja and
Thatcher, 2005;
Chin, 2000):
t ¼ ðPath1�Path2Þ=½Spooled � sqrt ð1=N1þ1=N2Þ�
Perceived
Overall
Value
Behavioral
Intention
Utilitarian
Value
Hedonic
Value
Social
Value
Image
Social
Presence
Social
Norm
Second Order
0.322***
0.513***
0.264***
R2=0.617
R2=0.728
0.460*** 0.157 0.089 0.197
0.853***
Critical
Mass
Note: Significant level: *** = 0.001
Figure 2.
Results of structural
evaluation
Antecedent construct Total effect coefficient SE t-Statistic p-
Value
Utilitarian value 0.275 0.015 18.027 o0.001
Hedonic value 0.438 0.021 21.174 o0.001
Social value 0.226 0.014 15.825 o0.001
Image 0.104 0.032 3.283 o0.001
Perceived social presence 0.036 0.026 1.346 0.181
Perceived critical mass 0.020 0.025 0.805 0.422
Social norm 0.044 0.028 1.606 0.111
Table VI.
Total effects of first-
order constructs on
behavioural intention
375
A perceived
value
empirical
investigation
where Path1 and Path2 are the corresponding path coefficients
in the two analyses
and N1 and N2 are the respective sample sizes.
Spooled is the pooled estimator for the variance assessed with
the formula:
Spooled ¼ sqrtf square of N1�1ð Þ= N1þN2�2ð Þ
� �
� square ofSe1
þ½square of ðN2�1Þ=ðN1þN2�2Þ� � square ofSe2g
where Se1 and Se2 are the standard errors of the path
coefficients in the two analyses.
Results depicted in Table VII do not show any statistically
significant difference between
the model run with the full sample and that with the Twitter
account holders’ sample.
All other demographic factors (age, gender, experience with the
application, number
of messages posted per week and number of accounts followed
or of followers) did not
have an influence over the model as possible control variables.
Small increases in R2 of
the endogenous constructs were noticed but no significant paths
to these constructs
were recorded.
6. Discussion and conclusions
The objective of this paper has been to propose a value-based
theoretical model to
explain the adoption of Twitter, a very popular social
networking application. A model
based on consumer behaviour and IS literature findings as well
as on theoretical
reasoning was built and tested empirically with 134 North-
American respondents
recruited online.
The research question asked was: What is the order of
importance of the key facets
of perceived value that influence the adoption of Twitter social
networking application?
Similar to previous research, perceived value was considered as
a second-order
construct with three salient facets: utilitarian, hedonic and
social. As in previous
research, all facets were found to have a significant and
relatively strong influence
(Rintamäki et al., 2006; Turel et al., 2007). However, as a
surprise for a social media
application, though, the social side had comparatively the
weakest contribution to
the overall perceived value (path coefficient of 0.26). Hedonic
value was by far the
strongest component of the overall value (path coefficient of
0.51), followed by
the utilitarian side (path coefficient of 0.32). This shows that
people see enjoyment-
type value followed by the utilitarian perception as the most
important factors that
would make them use the social media platform and this also
confirms findings of
Hypothesis Path
Full
sample
path
coefficient
Account
holders’
sample
path
coefficient
Path
coefficient
absolute
difference
p-Value
of the
difference
H1 Perceived value→behavioral intention 0.853 0.823 0.030
0.95
H2-1 Utilitarian value→perceived value 0.322 0.341 0.019 0.56
H2-2 Hedonic value→perceived value 0.513 0.528 0.015 0.88
H2-3 Social value→perceived value 0.264 0.253 0.011 0.59
H3-1 Image→social value 0.460 0.432 0.028 0.94
H3-2 Perceived social presence→social value 0.157 0.145 0.012
0.62
H3-3 Perceived critical mass→social value 0.089 0.101 0.012
0.96
H3-4 Social norm→social value 0.197 0.207 0.010 0.40
Table VII.
Model comparison
between full sample
(134 Respondents)
and twitter account
holders’ sample (96
respondents)
376
ITP
28,2
previous research on the significance of these factors (Han and
Windsor, 2011; Kim
et al., 2011; Lin and Lu, 2011; Turel and Serenko, 2012). Only
lastly users see this
application as a valuable social tool. Overall, seeing value in
Twitter is by itself a
sufficiently strong reason for adoption (R2 ¼ 0.728).
Of the hypothesized antecedents of the social side of the value,
only the perception of
enhancement of social status (conceptualized as image) proved
to be significant and
moderately strong (path coefficient of 0.46). Hence, people
would see improving their
image as the only reason of using Twitter from a social point of
view and this is
confirming previous research on social networking (Kim et al.,
2011). The study did not
show a significant effect of the influence from significant others
(captured as social
norm), of perceived social presence (of their peers) or of
critical mass (of users).
A possible explanation of these findings is that Twitter, despite
its relative newness,
already reached maturity in terms of social penetration due to
an exponential increase
of the adoption rate, so the user popularity and online
activeness are not an issue.
Therefore, when considering social reasons for using Twitter,
people are looking only
at improving the social status among their peers.
6.1 Contributions to research
This study proposed a comprehensive theoretical model of the
adoption of a popular
social networking application (Twitter). The model relies on a
multi-sided perceived
value concept adapted from consumer behaviour research.
Further, as a significant
theoretical contribution, for the in-depth investigation of the
social reasons to adopt a
social networking application, the study integrated theoretically
four antecedents of the
social dimension of the perceived value: image, perceived social
presence, perceived
critical mass and social norm. We found that five of the eight
hypotheses proposed
were supported at the statistical level of 0.001 or better and the
corresponding path
coefficients were moderately high. Of the four antecedents of
the social value hypothesized,
only image was statistically significant but, nonetheless, it
explained a moderately high
per cent of the variance of social value: 61.7 per cent. Overall,
since the majority of the
hypotheses were supported and R2 values of the endogenous
variables were relatively
high for the IS domain research (e.g. 72.8 per cent for the
behavioral intention), the
theoretical model could be termed as appropriate (Bontis et al.,
2000). Therefore, the model
proposed by this study is suitable in reflecting viewpoints on
adopting Twitter social
networking application from a user value perspective.
6.2 Contributions to practice
Our results indicated that, surprisingly, the social dimension of
the value perception of
this popular social media application is, comparatively, the
weakest reason for its
adoption, following the perception of enjoyment and utility
values. Therefore, individuals
and businesses seeking to use Twitter for social networking
should have enjoyment and
utility of their posts as primary objectives in order to be
effective in broadcasting their
messages to a large number of users. Despite its relatively
weaker contribution, social
value is a significant contributor to use intent and should not be
neglected. Perception
of Twitter’s social value is significantly enhanced by a bi -
directional image construct
capturing both status (through impression individuals think they
make on others) and
self-esteem (through concept of self). Therefore, individuals
and businesses using such a
social networking application should consider the image they
are promoting through the
network on one side and, also, that other contributors to the
network are acknowledging
the importance of their image too.
377
A perceived
value
empirical
investigation
6.3 Limitations and future research
This study involved also limitations, as virtually any empirical
research on IT adoption.
Respondents self-selected after seeing the invitation to
participation posted on a faculty’s
web site. The perceived value may be also influenced by the
features of that social
networking application (i.e. Twitter in this case). As the
experiment was limited in time to
three months, the sample size was moderately low but,
nonetheless, 20 per cent more than
the minimum sample size required by PLS methodology
(Jarvenpaa and Todd, 1996).
Since the recruitment process was not controlled, the valid
sample resulted as being
slightly biased towards female respondents (60.8 per cent
female and 39.2 per cent male).
However, gender was not found to have a significant influence
in the theoretical model at
a statistical level of 0.05 or better when tested as a potential
control variable. As in
virtually any empirical research, there is also the question of
the generalizability of the
findings. Since the research was open online to anyone meeting
the including
conditions, without being restricted to a location or category of
users of the IT, it is
believed the results are applicable to any individual 18 years or
older and familiar
with Twitter. Overall, these limitations are not uncommon to IS
research and were
considered acceptable for an incipient study in a new direction.
Structural tests also revealed the influence of some control
variables. Thus, it
appears that having an account and checking Twitter more often
make people see more
value in Twitter and want to continue using this networking
application. This may
open the door for interesting questions on the value users would
see over time or over
the increased frequency of use of the social networking. Future
research should look in
more detail at whether the more use would still mean the better
value. That research
should also confirm whether the social side is indeed the least
important part of the
value perceived in a social networking platform (compared to
enjoyment and utility)
while trying to enrich the picture with antecedents of the
utilitarian and hedonic facets.
Overall, this study attempted to conduct a scientific
investigation on the user reasons
to adopt a popular social networking application, Twitter, based
on perceived value
theory. It opened the door for investigating the same application
in other research contexts
or other popular social networking applications from the user
perspective in an effort to
understand the unprecedented success of these services in just a
few years’ time.
References
Abedniy, A.A. and Mahmouei, S.S. (2010), “The impact of
social networking websites to facilitate
the effectiveness of viral marketing”, International Journal of
Advanced Computer Science
and Applications, Vol. 1 No. 6, pp. 139-146.
Ahuja, M.K. and Thatcher, J.B. (2005), “Moving beyond
intentions and toward the theory of
trying: effects of work environment and gender on post-
adoption information technology
use”, MIS Quarterly, Vol. 29 No. 3, pp. 427-459.
Al-Debei, M.M., Al-Lozi, E. and Papazafeiropoulou, A. (2013),
“Why people keep coming back to
facebook: explaining and predicting continuance participation
from an extended theory of
planned behaviour perspective”, Decision Support Systems,
Vol. 55 No. 1, pp. 43-54.
Bolton, R.N. and Drew, J.H. (1991), “A multistage model of
customers’ assessments of service
quality and value”, Journal of Consumer Research, Vol. 17 No.
4, pp. 375-384.
Bontis, N. (1998), “Intellectual capital: an exploratory study
that develops measures and models”,
Management Decision, Vol. 36 No. 2, pp. 63-76.
Bontis, N. (2004), “National intellectual capital index: a United
Nations initiative for the Arab
region”, Journal of Intellectual Capital, Vol. 5 No. 1, pp. 13-39.
378
ITP
28,2
Bontis, N., Keow, W.C.C. and Richardson, S. (2000),
“Intellectual capital and business performance
in Malaysian industries”, Journal of Intellectual Capital, Vol. 1
No. 1, pp. 85-100.
Brown, S.A. and Venkatesh, V. (2005), “Model of adoption of
technology in households: a baseline
model test and extension incorporating household life cycle”,
MIS Quarterly, Vol. 29 No. 3,
pp. 399-426.
Chin, W.W. (2000), “Frequently asked questions – partial least
squares & PLS-graph”, The
University of Houston, Houston, TX, available at: http://disc-
nt.cba.uh.edu/chin/plsfaq/
plsfaq.htm (accessed 8 July 2014).
Culnan, M.J., McHugh, P.J. and Zubillaga, J.I. (2010), “How
large US companies can use twitter and
other social media to gain business value”, MIS Quarterly
Executive, Vol. 9 No. 4, pp. 243-259.
Cyr, D., Head, M., Larios, H. and Pan, B. (2009), “Exploring
human images in website design:
a multi-method approach”, MIS Quarterly, Vol. 33 No. 3, pp.
539-566.
Dickinger, A., Arami, M. and Meyer, D. (2008), “The role of
perceived enjoyment and social norm
in the adoption of technology with network externalities”,
European Journal of Information
Systems, Vol. 17 No. 1, pp. 4-11.
Dimoka, A., Hong, Y. and Pavlou, P.A. (2012), “On product
uncertainty in online markets: theory
and evidence”, MIS Quarterly, Vol. 36 No. 2, pp. 395-A15.
Fornell, C. and Larcker D.F. (1981), “Evaluating structural
equation models with unobservable
variables and measurement error”, Journal of Marketing
Research, Vol. 18 No. 1, pp. 39-50.
Gefen, D. and Straub, D. (2005), “A practical guide to factorial
validity using PLS-Graph: tutorial
and annotated example”, Communications of the Association for
Information Systems,
Vol. 16 No. 1, pp. 91-109.
Gruzd, A., Staves, K. and Wilk, A. (2012), “Connected
scholars: examining the role of social media
in research practices of faculty using the UTAUT model”,
Computers in Human Behavior,
Vol. 28 No. 6, pp. 2340-2350.
Hair, J.F., Black, W.C., Babin, B.J. and Anderson, R.E. (2009),
Multivariate Data Analysis, Prentice
Hall, Upper Saddle River, NJ.
Han, B. and Windsor, J. (2011), “User’s willingness to pay on
social network sites”, The Journal of
Computer Information Systems, Vol. 51 No. 4, pp. 31-40.
Hargittai, E. (2007), “Whose space? Differences among users
and non-users of social network
sites”, Journal of Computer-Mediated Communication, Vol. 13
No. 1, pp. 276-297.
Ho, S.H. and Ko, Y.Y. (2008), “Effects of self-service
technology on customer value and customer
readiness: the case of Internet banking”, Internet Research, Vol.
18 No. 4, pp. 427-446.
Hsu, C.L. and. Lu, H.P. (2004), “Why do people play on-line
games? An extended TAM with social
influences and flow experience”, Information & Management,
Vol. 41 No. 7, pp. 853-868.
Jarvenpaa, S.L. and Todd, P.A. (1996), “Consumer reactions to
electronic shopping on the world
Wide Web”, International Journal of Electronic Commerce, Vol.
1 No. 2, pp. 59-88.
Jarvenpaa, S.L., Shaw, T.R. and Staples, D.S. (2004), “Toward
contextualized theories of trust:
the role of trust in global virtual teams”, Information Systems
Research, Vol. 15 No. 3,
pp. 250-267.
Kaplan, A.M. and Haenlein, M. (2010), “Users of the world,
unite! The challenges and
opportunities of social media”, Business Horizons, Vol. 53 No.
1, pp. 59-68.
Kim, B. and Han, I. (2009), “What drives the adoption of
mobile data services? An approach from
a value perspective”, Journal of Information Technology, Vol.
24 No. 1, pp. 35-45.
Kim, H.W., Chan, H.C. and Gupta, S. (2007), “Value-based
adoption of mobile internet: an
empirical investigation”, Decision Support Systems, Vol. 43
No. 1, pp. 111-126.
379
A perceived
value
empirical
investigation
http://disc-
nt.cba.uh.edu/chin/plsfaq/plsfaq.
htm
http://disc-
nt.cba.uh.edu/chin/plsfaq/plsfaq.
htm
Kim, H.W., Gupta, S. and Koh, J. (2011), “Investigating the
intention to purchase digital items in
social networking communities: a customer value perspective”,
Information & Management,
Vol. 48 No. 230, pp. 228-234.
Kim, S.S., Malhotra, N.K. and Narasimhan, S. (2005), “Two
competing perspectives on automatic
use: a theoretical and empirical comparison”, Information
Systems Research, Vol. 16 No. 4,
pp. 418-432.
Kumar, N. and Benbasat, I. (2006), “The influence of
recommendations and consumer reviews on
evaluations of websites”, Information Systems Research, Vol. 7
No. 4, pp. 425-439.
Kwon, O. and Wen, Y. (2010), “An empirical study of the
factors affecting social network service
use”, Computers in Human Behavior, Vol. 26 No. 2, pp. 254-
263.
Lee, Y., Kim, J., Lee, I. and Kim, H. (2002), “A cross-cultural
study on the value structure of mobile
internet usage: comparison between Korea and Japan”, Journal
of Electronic Commerce
Research, Vol. 3 No. 4, pp. 227-239.
Lin, K.Y. and Lu, H.P. (2011), “Why people use social
networking sites: an empirical study
integrating network externalities and motivation theory”,
Computers in Human Behavior,
Vol. 27 No. 3, pp. 1152-1161.
Lohmoller, J.B. (1989), Latent Variable Path Modelling with
Partial Least Squares, Physica-Verlag,
Heidelberg.
Lorenzo-Romero, C., Constantinides, E. and Alarcón-Del-Amo,
M.C. (2011), “Consumer adoption of
social networking sites: implications for theory and practice”,
Journal of Research in
Interactive Marketing, Vol. 5 Nos 2/3, pp. 170-188.
Pavlou, P.A., Liang, H. and Xue, Y. (2007), “Understanding and
mitigating uncertainty in online
exchange relationships: a principal-agent perspective”, MIS
Quarterly, Vol. 31 No. 1,
pp. 105-136.
Podsakoff, P.M., Mackenzie, S.B., Lee, J.Y. and Podsakoff,
N.P. (2003), “Common method biases in
behavioral research: a critical review of the literature and
recommended remedies”, Journal
of Applied Psychology, Vol. 88 No. 5, pp. 879-903.
Ringle, C., Wende, M.S. and Will, S. (2005), “SmartPLS 2.0
(M3) beta”, available at: www.smartpls.de
(accessed 8 October 2013).
Rintamäki, T., Kanto, A. and Spence, M.T. (2006),
“Decomposing the value of department store
shopping into utilitarian, hedonic, and social dimensions”,
International Journal of Retail
and Distribution Management, Vol. 34 No. 1, pp. 6-24.
Rourke, I., Anderson, T., Garrison, D.R. and Archer, W. (1999),
“Assessing social presence in
asynchronous, text-based computer conferencing”, Journal of
Distance Education, Vol. 14
No. 3, pp. 51-70.
Sharma, R., Yetton, P. and Crawford, J. (2009), “Estimating the
effect of common method variance:
the method-method pair technique with an illustration from
TAM research”, MIS
Quarterly, Vol. 33 No. 3, pp. 473-490.
Sheth, J.D., Newman, B.I. and Gross, B.I. (1991), Consumption
Values and Market Choice, South
Western Publishing, Cincinnati, OH.
Shneiderman, B., Preece, J. and Pirolli, P. (2011), “Realizing
the value of social media requires
innovative computing research”, Communications of the ACM,
Vol. 54 No. 9, pp. 34-37.
Sinclaire, J.K. and Vogus, C.E. (2011), “Adoption of social
networking sites: an exploratory
adaptive structuration perspective for global organizations”,
Information Technology and
Management, Vol. 12 No. 4, pp. 293-314.
Spaulding, T.J. (2010), “How can virtual communities create
value for business?”, Electronic
Commerce Research and Applications, Vol. 9 No. 1, pp. 38-49.
380
ITP
28,2
www.smartpls.de
Sun, Y., Bhattacherjee, A. and Ma, Q. (2009), “Extending
technology usage to work settings: the
role of perceived work compatibility in ERP implementation”,
Information and
Management, Vol. 46 No. 6, pp. 351-356.
Sweeney, J. and Soutar, G.N. (2001), “Consumer perceived
value: the development of a multiple
item scale”, Journal of Retailing, Vol. 77 No. 2, pp. 203-220.
Thomas, R.D., Lu, I.R.R. and Cedzynski, M. (2005), “Partial
least squares: a critical review and a
potential alternative”, Proceedings of Administrative Sciences
Association of Canada
(ASAC) Conference, Toronto, 28-31 May.
Turel, O. and Serenko, A. (2012), “The benefits and dangers of
enjoyment with social networking
websites”, European Journal of Information Systems, Vol. 21
No. 5, pp. 512-528.
Turel, O., Serenko, A. and Bontis, N. (2007), “User acceptance
of wireless short messaging services:
deconstructing perceived value”, Information and Management,
Vol. 44 No. 1, pp. 63-73.
Turel, O., Serenko, A. and Bontis, N. (2010), “User acceptance
of hedonic digital artifacts: a theory of
consumption values perspective”, Information and Management,
Vol. 47 No. 1, pp. 53-59.
Van Slyke, C., Ilie, V., Lou, H. and Stafford, T. (2007),
“Perceived critical mass and the adoption
of a communication technology”, European Journal of
Information Systems, Vol. 16 No. 3,
pp. 270-283.
Venkatesh, V. and Davis, F. (2000), “A theoretical extension of
the technology acceptance model:
four longitudinal field studies”, Management Science, Vol. 46
No. 2, pp. 186-204.
Venkatesh, V., Morris, M.G., Davis, G.B. and Davis, F.D.
(2003), “User acceptance of information
technology: toward a unified view”, MIS Quarterly, Vol. 27 No.
3, pp. 425-478.
Venkatesh, V., Speier, C. and Morris, M.G. (2002), “User
acceptance enablers in individual decision
making about technology: toward an integrated model”,
Decision Sciences, Vol. 33 No. 2,
pp. 297-316.
Wakefield, J. (2011), “Twitter dismisses $10bn Google deal and
talks up mobile”, available at:
www.bbc.co.uk/news/technology-12462653 (accessed 15 May
2011).
Wikipedia (2012), “Social media”, availabe at:
http://en.wikipedia.org/wiki/Social_media (accessed
26 November 2012).
Xu, C., Ryan, S., Prybutok, V. and Wen, C. (2012), “It is not
for fun: an examination of social
network site usage”, Information & Management, Vol. 49 No. 5,
pp. 210-217.
Yoo, Y. and Alavi, M. (2001), “Media and group cohesion:
relative influences on social presence,
task participation and group consensus”, MIS Quarterly, Vol. 25
No. 3, pp. 371-390.
Zeithaml, V.A. (1988), “Consumer perceptions of price, quality
and value: a means-end model and
synthesis of evidence”, Journal of Marketing, Vol. 52 No. 3, pp.
2-22.
Zhao, D. and Rosson, M.B. (2009), “How and why people
twitter: the role that microblogging
plays in informal communication at work”, GROUP’09
Conference, Sanibel Island, FL,
10-13 May.
Zhao, L. and Lu, Y. (2012), “Enhancing perceived interactivity
through network externalities: an
empirical study on micro-blogging service satisfaction and
continuance intention”, Decision
Support Systems, Vol. 53 No. 4, pp. 825-834.
Appendix. Survey questions for each theoretical model
construct
Perceived social presence
There is a sense of human contact in using Twitter.
There is a sense of personalness in using Twitter.
There is a sense of sociability in using Twitter.
There is a sense of human warmth in using Twitter.
There is a sense of human sensitivity in using Twitter.
381
A perceived
value
empirical
investigation
www.bbc.co.uk/news/technology-12462653
http://en.wikipedia.org/wiki&#x
0002F;Social_media
Social norm
People who influence my behavior think that I should use
Twitter.
People who are important to me think that I should use Twitter.
Image
People among my peers who use Twitter have more prestige
than those who do not use it.
People among my peers who use Twitter have a high profile.
Using Twitter is a status symbol among my peers.
Perceived critical mass
Many people I communicate with use Twitter.
The people I communicate with will continue to use Twitter in
the future.
The people I communicate with using Twitter will continue to
use Twitter in the future.
Of the people I communicate with regularly, many use Twitter.
Utilitarian value
As it is free, the use of Twitter offers a good value for the
money.
Compared to the effort I need to put in, the use of Twitter is
beneficial to me.
Compared to the time I need to spend, the use of Twitter is
worthwhile to me.
Overall, the use of Twitter is delivering me good value.
Hedonic value
Twitter is a social media that I enjoy.
Twitter is a social media that makes me want to use it.
Twitter is a social media that I feel relaxed about using.
The use of Twitter makes me feel good.
The use of Twitter gives me pleasure.
The use of Twitter helps me feel acceptable.
Social value
The use of Twitter improves the way I am perceived.
The fact I use Twitter makes a good impression on other people.
The use of Twitter gives me social approval.
Behavioural intention
Assuming I have access to Twitter, I intend to use it in the
future.
Given that I have access to Twitter, I predict that I would use it
in the future.
About the authors
Dr Mihail Cocosila is an Associate Professor, in Management
Science and e-Commerce, in the
Faculty of Business of Athabasca University. His research
interests include information technology
adoption and use, topics in information systems, human-
computer interaction, mobile and wireless
services and health informatics. His recent journal publications
include Communications of the
ACM, Communications of the AIS, Canadian Journal of
Administrative Sciences, Journal of Medical
Internet Research and Electronic Markets – The International
Journal on Networked Business.
Dr Mihail Cocosila is the corresponding author and can be
contacted at: [email protected]
Dr Andy Igonor currently Chairs the Bachelor of Business
Administration program at the
Northern Alberta Institute of Technology, Edmonton Canada.
His research interests include
information technology strategy and capability development in
SMEs, information security and
privacy.
For instructions on how to order reprints of this article, please
visit our website:
www.emeraldgrouppublishing.com/licensing/reprints.htm
Or contact us for further details: [email protected]
382
ITP
28,2
mailto:[email protected]Outline placeholderAppendix.Survey
questions for each theoretical model construct

More Related Content

Similar to How important is the social” insocial networking A perceiv

Application For Sentiment And Demographic Analysis Processes On Social Media
Application For Sentiment And Demographic Analysis Processes On Social MediaApplication For Sentiment And Demographic Analysis Processes On Social Media
Application For Sentiment And Demographic Analysis Processes On Social MediaWhitney Anderson
 
TheimpactofeWOM-IR1820083229-247.pdf
TheimpactofeWOM-IR1820083229-247.pdfTheimpactofeWOM-IR1820083229-247.pdf
TheimpactofeWOM-IR1820083229-247.pdfDHRUVINKUMARCHAUHAN
 
Preliminary Research on Adoption and Diffusion Model of SMEs E-Learning in Th...
Preliminary Research on Adoption and Diffusion Model of SMEs E-Learning in Th...Preliminary Research on Adoption and Diffusion Model of SMEs E-Learning in Th...
Preliminary Research on Adoption and Diffusion Model of SMEs E-Learning in Th...www.nbtc.go.th
 
Researching Social Media – Big Data and Social Media Analysis
Researching Social Media – Big Data and Social Media AnalysisResearching Social Media – Big Data and Social Media Analysis
Researching Social Media – Big Data and Social Media AnalysisFarida Vis
 
FACTORS AFFECTING KNOWLEDGE SHARING USING VIRTUAL PLATFORMS – A VALIDATION OF...
FACTORS AFFECTING KNOWLEDGE SHARING USING VIRTUAL PLATFORMS – A VALIDATION OF...FACTORS AFFECTING KNOWLEDGE SHARING USING VIRTUAL PLATFORMS – A VALIDATION OF...
FACTORS AFFECTING KNOWLEDGE SHARING USING VIRTUAL PLATFORMS – A VALIDATION OF...ijmpict
 
Tfsc disc 2014 si proposal (30 june2014)
Tfsc disc 2014 si proposal (30 june2014)Tfsc disc 2014 si proposal (30 june2014)
Tfsc disc 2014 si proposal (30 june2014)Han Woo PARK
 
Survey of data mining techniques for social
Survey of data mining techniques for socialSurvey of data mining techniques for social
Survey of data mining techniques for socialFiras Husseini
 
IRJET - Socirank Identifying and Ranking Prevalent News Topics using Social M...
IRJET - Socirank Identifying and Ranking Prevalent News Topics using Social M...IRJET - Socirank Identifying and Ranking Prevalent News Topics using Social M...
IRJET - Socirank Identifying and Ranking Prevalent News Topics using Social M...IRJET Journal
 
Irjet v4 i73A Survey on Student’s Academic Experiences using Social Media Data53
Irjet v4 i73A Survey on Student’s Academic Experiences using Social Media Data53Irjet v4 i73A Survey on Student’s Academic Experiences using Social Media Data53
Irjet v4 i73A Survey on Student’s Academic Experiences using Social Media Data53IRJET Journal
 
Experiments on Crowdsourcing Policy Assessment - Oxford IPP 2014
Experiments on Crowdsourcing Policy Assessment - Oxford IPP 2014Experiments on Crowdsourcing Policy Assessment - Oxford IPP 2014
Experiments on Crowdsourcing Policy Assessment - Oxford IPP 2014Araz Taeihagh
 
Digital Transformation in Higher Education – New Cohorts, New Requirements?. ...
Digital Transformation in Higher Education – New Cohorts, New Requirements?. ...Digital Transformation in Higher Education – New Cohorts, New Requirements?. ...
Digital Transformation in Higher Education – New Cohorts, New Requirements?. ...eraser Juan José Calderón
 
Literature review on the impact of public access to information and communica...
Literature review on the impact of public access to information and communica...Literature review on the impact of public access to information and communica...
Literature review on the impact of public access to information and communica...Dr Lendy Spires
 
SOCIAL MEDIA ANALYSIS ON SUPPLY CHAIN MANAGEMENT IN FOOD INDUSTRY
SOCIAL MEDIA ANALYSIS ON SUPPLY CHAIN MANAGEMENT IN FOOD INDUSTRYSOCIAL MEDIA ANALYSIS ON SUPPLY CHAIN MANAGEMENT IN FOOD INDUSTRY
SOCIAL MEDIA ANALYSIS ON SUPPLY CHAIN MANAGEMENT IN FOOD INDUSTRYKaustubh Nale
 
Getting Successful Universal Ehr Is Not Just Technology...
Getting Successful Universal Ehr Is Not Just Technology...Getting Successful Universal Ehr Is Not Just Technology...
Getting Successful Universal Ehr Is Not Just Technology...Jessica Tanner
 
2011 02-11 (uam) emadrid tmiilumaki tut estudio aprendizaje apoyado en redes ...
2011 02-11 (uam) emadrid tmiilumaki tut estudio aprendizaje apoyado en redes ...2011 02-11 (uam) emadrid tmiilumaki tut estudio aprendizaje apoyado en redes ...
2011 02-11 (uam) emadrid tmiilumaki tut estudio aprendizaje apoyado en redes ...eMadrid network
 

Similar to How important is the social” insocial networking A perceiv (20)

Application For Sentiment And Demographic Analysis Processes On Social Media
Application For Sentiment And Demographic Analysis Processes On Social MediaApplication For Sentiment And Demographic Analysis Processes On Social Media
Application For Sentiment And Demographic Analysis Processes On Social Media
 
TheimpactofeWOM-IR1820083229-247.pdf
TheimpactofeWOM-IR1820083229-247.pdfTheimpactofeWOM-IR1820083229-247.pdf
TheimpactofeWOM-IR1820083229-247.pdf
 
Preliminary Research on Adoption and Diffusion Model of SMEs E-Learning in Th...
Preliminary Research on Adoption and Diffusion Model of SMEs E-Learning in Th...Preliminary Research on Adoption and Diffusion Model of SMEs E-Learning in Th...
Preliminary Research on Adoption and Diffusion Model of SMEs E-Learning in Th...
 
Researching Social Media – Big Data and Social Media Analysis
Researching Social Media – Big Data and Social Media AnalysisResearching Social Media – Big Data and Social Media Analysis
Researching Social Media – Big Data and Social Media Analysis
 
Sub1557
Sub1557Sub1557
Sub1557
 
chapter 2 by YAN LIU
chapter 2 by YAN LIUchapter 2 by YAN LIU
chapter 2 by YAN LIU
 
F017433947
F017433947F017433947
F017433947
 
FACTORS AFFECTING KNOWLEDGE SHARING USING VIRTUAL PLATFORMS – A VALIDATION OF...
FACTORS AFFECTING KNOWLEDGE SHARING USING VIRTUAL PLATFORMS – A VALIDATION OF...FACTORS AFFECTING KNOWLEDGE SHARING USING VIRTUAL PLATFORMS – A VALIDATION OF...
FACTORS AFFECTING KNOWLEDGE SHARING USING VIRTUAL PLATFORMS – A VALIDATION OF...
 
Tfsc disc 2014 si proposal (30 june2014)
Tfsc disc 2014 si proposal (30 june2014)Tfsc disc 2014 si proposal (30 june2014)
Tfsc disc 2014 si proposal (30 june2014)
 
Survey of data mining techniques for social
Survey of data mining techniques for socialSurvey of data mining techniques for social
Survey of data mining techniques for social
 
IRJET - Socirank Identifying and Ranking Prevalent News Topics using Social M...
IRJET - Socirank Identifying and Ranking Prevalent News Topics using Social M...IRJET - Socirank Identifying and Ranking Prevalent News Topics using Social M...
IRJET - Socirank Identifying and Ranking Prevalent News Topics using Social M...
 
Irjet v4 i73A Survey on Student’s Academic Experiences using Social Media Data53
Irjet v4 i73A Survey on Student’s Academic Experiences using Social Media Data53Irjet v4 i73A Survey on Student’s Academic Experiences using Social Media Data53
Irjet v4 i73A Survey on Student’s Academic Experiences using Social Media Data53
 
Experiments on Crowdsourcing Policy Assessment - Oxford IPP 2014
Experiments on Crowdsourcing Policy Assessment - Oxford IPP 2014Experiments on Crowdsourcing Policy Assessment - Oxford IPP 2014
Experiments on Crowdsourcing Policy Assessment - Oxford IPP 2014
 
Digital Transformation in Higher Education – New Cohorts, New Requirements?. ...
Digital Transformation in Higher Education – New Cohorts, New Requirements?. ...Digital Transformation in Higher Education – New Cohorts, New Requirements?. ...
Digital Transformation in Higher Education – New Cohorts, New Requirements?. ...
 
Literature review on the impact of public access to information and communica...
Literature review on the impact of public access to information and communica...Literature review on the impact of public access to information and communica...
Literature review on the impact of public access to information and communica...
 
Literature review on the impact of public access to information and communica...
Literature review on the impact of public access to information and communica...Literature review on the impact of public access to information and communica...
Literature review on the impact of public access to information and communica...
 
SOCIAL MEDIA ANALYSIS ON SUPPLY CHAIN MANAGEMENT IN FOOD INDUSTRY
SOCIAL MEDIA ANALYSIS ON SUPPLY CHAIN MANAGEMENT IN FOOD INDUSTRYSOCIAL MEDIA ANALYSIS ON SUPPLY CHAIN MANAGEMENT IN FOOD INDUSTRY
SOCIAL MEDIA ANALYSIS ON SUPPLY CHAIN MANAGEMENT IN FOOD INDUSTRY
 
Getting Successful Universal Ehr Is Not Just Technology...
Getting Successful Universal Ehr Is Not Just Technology...Getting Successful Universal Ehr Is Not Just Technology...
Getting Successful Universal Ehr Is Not Just Technology...
 
2011 02-11 (uam) emadrid tmiilumaki tut estudio aprendizaje apoyado en redes ...
2011 02-11 (uam) emadrid tmiilumaki tut estudio aprendizaje apoyado en redes ...2011 02-11 (uam) emadrid tmiilumaki tut estudio aprendizaje apoyado en redes ...
2011 02-11 (uam) emadrid tmiilumaki tut estudio aprendizaje apoyado en redes ...
 
s00146-014-0549-4.pdf
s00146-014-0549-4.pdfs00146-014-0549-4.pdf
s00146-014-0549-4.pdf
 

More from LizbethQuinonez813

In this module, we examined crimes against persons, crimes against p.docx
In this module, we examined crimes against persons, crimes against p.docxIn this module, we examined crimes against persons, crimes against p.docx
In this module, we examined crimes against persons, crimes against p.docxLizbethQuinonez813
 
In this module, we explore how sexual identity impacts the nature of.docx
In this module, we explore how sexual identity impacts the nature of.docxIn this module, we explore how sexual identity impacts the nature of.docx
In this module, we explore how sexual identity impacts the nature of.docxLizbethQuinonez813
 
In this module, we have studied Cultural Imperialism and Americaniza.docx
In this module, we have studied Cultural Imperialism and Americaniza.docxIn this module, we have studied Cultural Imperialism and Americaniza.docx
In this module, we have studied Cultural Imperialism and Americaniza.docxLizbethQuinonez813
 
In this Reflection Activity, you will be asked to think and write ab.docx
In this Reflection Activity, you will be asked to think and write ab.docxIn this Reflection Activity, you will be asked to think and write ab.docx
In this Reflection Activity, you will be asked to think and write ab.docxLizbethQuinonez813
 
In this lab, you will observe the time progression of industrializat.docx
In this lab, you will observe the time progression of industrializat.docxIn this lab, you will observe the time progression of industrializat.docx
In this lab, you will observe the time progression of industrializat.docxLizbethQuinonez813
 
In this module we have discussed an organizations design and how it.docx
In this module we have discussed an organizations design and how it.docxIn this module we have discussed an organizations design and how it.docx
In this module we have discussed an organizations design and how it.docxLizbethQuinonez813
 
In this lab, you will gather data about CO2 emissions using the .docx
In this lab, you will gather data about CO2 emissions using the .docxIn this lab, you will gather data about CO2 emissions using the .docx
In this lab, you will gather data about CO2 emissions using the .docxLizbethQuinonez813
 
In this five-page essay, your task is to consider how Enlightenment .docx
In this five-page essay, your task is to consider how Enlightenment .docxIn this five-page essay, your task is to consider how Enlightenment .docx
In this five-page essay, your task is to consider how Enlightenment .docxLizbethQuinonez813
 
In this reflection, introduce your professor to your project. Speak .docx
In this reflection, introduce your professor to your project. Speak .docxIn this reflection, introduce your professor to your project. Speak .docx
In this reflection, introduce your professor to your project. Speak .docxLizbethQuinonez813
 
In this discussion, please address the followingDiscuss how oft.docx
In this discussion, please address the followingDiscuss how oft.docxIn this discussion, please address the followingDiscuss how oft.docx
In this discussion, please address the followingDiscuss how oft.docxLizbethQuinonez813
 
In this course, we have introduced and assessed many noteworthy figu.docx
In this course, we have introduced and assessed many noteworthy figu.docxIn this course, we have introduced and assessed many noteworthy figu.docx
In this course, we have introduced and assessed many noteworthy figu.docxLizbethQuinonez813
 
In this Assignment, you will focus on Adaptive Leadership from a.docx
In this Assignment, you will focus on Adaptive Leadership from a.docxIn this Assignment, you will focus on Adaptive Leadership from a.docx
In this Assignment, you will focus on Adaptive Leadership from a.docxLizbethQuinonez813
 
Inferential AnalysisChapter 20NUR 6812Nursing Research
Inferential AnalysisChapter 20NUR 6812Nursing ResearchInferential AnalysisChapter 20NUR 6812Nursing Research
Inferential AnalysisChapter 20NUR 6812Nursing ResearchLizbethQuinonez813
 
Industry CompetitionChapter Outline3-1 Industry Life Cyc
Industry CompetitionChapter Outline3-1 Industry Life CycIndustry CompetitionChapter Outline3-1 Industry Life Cyc
Industry CompetitionChapter Outline3-1 Industry Life CycLizbethQuinonez813
 
Infancy to Early Childhood Case AnalysisPart IFor this di
Infancy to Early Childhood Case AnalysisPart IFor this diInfancy to Early Childhood Case AnalysisPart IFor this di
Infancy to Early Childhood Case AnalysisPart IFor this diLizbethQuinonez813
 
Infectious DiseasesNameCourseInstructorDateIntrodu
Infectious DiseasesNameCourseInstructorDateIntroduInfectious DiseasesNameCourseInstructorDateIntrodu
Infectious DiseasesNameCourseInstructorDateIntroduLizbethQuinonez813
 
Individual Focused Learning for Better Memory Retention Through
Individual Focused Learning for Better Memory Retention Through Individual Focused Learning for Better Memory Retention Through
Individual Focused Learning for Better Memory Retention Through LizbethQuinonez813
 
Infectious diseases projectThis project is PowerPoint, or a pa
Infectious diseases projectThis project is PowerPoint, or a paInfectious diseases projectThis project is PowerPoint, or a pa
Infectious diseases projectThis project is PowerPoint, or a paLizbethQuinonez813
 
Individual Project You are a business analyst in a publicly-tr
Individual Project You are a business analyst in a publicly-trIndividual Project You are a business analyst in a publicly-tr
Individual Project You are a business analyst in a publicly-trLizbethQuinonez813
 
Individual DifferencesSelf-Awareness and Working wit
Individual DifferencesSelf-Awareness and Working witIndividual DifferencesSelf-Awareness and Working wit
Individual DifferencesSelf-Awareness and Working witLizbethQuinonez813
 

More from LizbethQuinonez813 (20)

In this module, we examined crimes against persons, crimes against p.docx
In this module, we examined crimes against persons, crimes against p.docxIn this module, we examined crimes against persons, crimes against p.docx
In this module, we examined crimes against persons, crimes against p.docx
 
In this module, we explore how sexual identity impacts the nature of.docx
In this module, we explore how sexual identity impacts the nature of.docxIn this module, we explore how sexual identity impacts the nature of.docx
In this module, we explore how sexual identity impacts the nature of.docx
 
In this module, we have studied Cultural Imperialism and Americaniza.docx
In this module, we have studied Cultural Imperialism and Americaniza.docxIn this module, we have studied Cultural Imperialism and Americaniza.docx
In this module, we have studied Cultural Imperialism and Americaniza.docx
 
In this Reflection Activity, you will be asked to think and write ab.docx
In this Reflection Activity, you will be asked to think and write ab.docxIn this Reflection Activity, you will be asked to think and write ab.docx
In this Reflection Activity, you will be asked to think and write ab.docx
 
In this lab, you will observe the time progression of industrializat.docx
In this lab, you will observe the time progression of industrializat.docxIn this lab, you will observe the time progression of industrializat.docx
In this lab, you will observe the time progression of industrializat.docx
 
In this module we have discussed an organizations design and how it.docx
In this module we have discussed an organizations design and how it.docxIn this module we have discussed an organizations design and how it.docx
In this module we have discussed an organizations design and how it.docx
 
In this lab, you will gather data about CO2 emissions using the .docx
In this lab, you will gather data about CO2 emissions using the .docxIn this lab, you will gather data about CO2 emissions using the .docx
In this lab, you will gather data about CO2 emissions using the .docx
 
In this five-page essay, your task is to consider how Enlightenment .docx
In this five-page essay, your task is to consider how Enlightenment .docxIn this five-page essay, your task is to consider how Enlightenment .docx
In this five-page essay, your task is to consider how Enlightenment .docx
 
In this reflection, introduce your professor to your project. Speak .docx
In this reflection, introduce your professor to your project. Speak .docxIn this reflection, introduce your professor to your project. Speak .docx
In this reflection, introduce your professor to your project. Speak .docx
 
In this discussion, please address the followingDiscuss how oft.docx
In this discussion, please address the followingDiscuss how oft.docxIn this discussion, please address the followingDiscuss how oft.docx
In this discussion, please address the followingDiscuss how oft.docx
 
In this course, we have introduced and assessed many noteworthy figu.docx
In this course, we have introduced and assessed many noteworthy figu.docxIn this course, we have introduced and assessed many noteworthy figu.docx
In this course, we have introduced and assessed many noteworthy figu.docx
 
In this Assignment, you will focus on Adaptive Leadership from a.docx
In this Assignment, you will focus on Adaptive Leadership from a.docxIn this Assignment, you will focus on Adaptive Leadership from a.docx
In this Assignment, you will focus on Adaptive Leadership from a.docx
 
Inferential AnalysisChapter 20NUR 6812Nursing Research
Inferential AnalysisChapter 20NUR 6812Nursing ResearchInferential AnalysisChapter 20NUR 6812Nursing Research
Inferential AnalysisChapter 20NUR 6812Nursing Research
 
Industry CompetitionChapter Outline3-1 Industry Life Cyc
Industry CompetitionChapter Outline3-1 Industry Life CycIndustry CompetitionChapter Outline3-1 Industry Life Cyc
Industry CompetitionChapter Outline3-1 Industry Life Cyc
 
Infancy to Early Childhood Case AnalysisPart IFor this di
Infancy to Early Childhood Case AnalysisPart IFor this diInfancy to Early Childhood Case AnalysisPart IFor this di
Infancy to Early Childhood Case AnalysisPart IFor this di
 
Infectious DiseasesNameCourseInstructorDateIntrodu
Infectious DiseasesNameCourseInstructorDateIntroduInfectious DiseasesNameCourseInstructorDateIntrodu
Infectious DiseasesNameCourseInstructorDateIntrodu
 
Individual Focused Learning for Better Memory Retention Through
Individual Focused Learning for Better Memory Retention Through Individual Focused Learning for Better Memory Retention Through
Individual Focused Learning for Better Memory Retention Through
 
Infectious diseases projectThis project is PowerPoint, or a pa
Infectious diseases projectThis project is PowerPoint, or a paInfectious diseases projectThis project is PowerPoint, or a pa
Infectious diseases projectThis project is PowerPoint, or a pa
 
Individual Project You are a business analyst in a publicly-tr
Individual Project You are a business analyst in a publicly-trIndividual Project You are a business analyst in a publicly-tr
Individual Project You are a business analyst in a publicly-tr
 
Individual DifferencesSelf-Awareness and Working wit
Individual DifferencesSelf-Awareness and Working witIndividual DifferencesSelf-Awareness and Working wit
Individual DifferencesSelf-Awareness and Working wit
 

Recently uploaded

Introduction to AI in Higher Education_draft.pptx
Introduction to AI in Higher Education_draft.pptxIntroduction to AI in Higher Education_draft.pptx
Introduction to AI in Higher Education_draft.pptxpboyjonauth
 
Call Girls in Dwarka Mor Delhi Contact Us 9654467111
Call Girls in Dwarka Mor Delhi Contact Us 9654467111Call Girls in Dwarka Mor Delhi Contact Us 9654467111
Call Girls in Dwarka Mor Delhi Contact Us 9654467111Sapana Sha
 
How to Make a Pirate ship Primary Education.pptx
How to Make a Pirate ship Primary Education.pptxHow to Make a Pirate ship Primary Education.pptx
How to Make a Pirate ship Primary Education.pptxmanuelaromero2013
 
internship ppt on smartinternz platform as salesforce developer
internship ppt on smartinternz platform as salesforce developerinternship ppt on smartinternz platform as salesforce developer
internship ppt on smartinternz platform as salesforce developerunnathinaik
 
Blooming Together_ Growing a Community Garden Worksheet.docx
Blooming Together_ Growing a Community Garden Worksheet.docxBlooming Together_ Growing a Community Garden Worksheet.docx
Blooming Together_ Growing a Community Garden Worksheet.docxUnboundStockton
 
_Math 4-Q4 Week 5.pptx Steps in Collecting Data
_Math 4-Q4 Week 5.pptx Steps in Collecting Data_Math 4-Q4 Week 5.pptx Steps in Collecting Data
_Math 4-Q4 Week 5.pptx Steps in Collecting DataJhengPantaleon
 
Biting mechanism of poisonous snakes.pdf
Biting mechanism of poisonous snakes.pdfBiting mechanism of poisonous snakes.pdf
Biting mechanism of poisonous snakes.pdfadityarao40181
 
Painted Grey Ware.pptx, PGW Culture of India
Painted Grey Ware.pptx, PGW Culture of IndiaPainted Grey Ware.pptx, PGW Culture of India
Painted Grey Ware.pptx, PGW Culture of IndiaVirag Sontakke
 
Mastering the Unannounced Regulatory Inspection
Mastering the Unannounced Regulatory InspectionMastering the Unannounced Regulatory Inspection
Mastering the Unannounced Regulatory InspectionSafetyChain Software
 
भारत-रोम व्यापार.pptx, Indo-Roman Trade,
भारत-रोम व्यापार.pptx, Indo-Roman Trade,भारत-रोम व्यापार.pptx, Indo-Roman Trade,
भारत-रोम व्यापार.pptx, Indo-Roman Trade,Virag Sontakke
 
ENGLISH5 QUARTER4 MODULE1 WEEK1-3 How Visual and Multimedia Elements.pptx
ENGLISH5 QUARTER4 MODULE1 WEEK1-3 How Visual and Multimedia Elements.pptxENGLISH5 QUARTER4 MODULE1 WEEK1-3 How Visual and Multimedia Elements.pptx
ENGLISH5 QUARTER4 MODULE1 WEEK1-3 How Visual and Multimedia Elements.pptxAnaBeatriceAblay2
 
Paris 2024 Olympic Geographies - an activity
Paris 2024 Olympic Geographies - an activityParis 2024 Olympic Geographies - an activity
Paris 2024 Olympic Geographies - an activityGeoBlogs
 
Hybridoma Technology ( Production , Purification , and Application )
Hybridoma Technology  ( Production , Purification , and Application  ) Hybridoma Technology  ( Production , Purification , and Application  )
Hybridoma Technology ( Production , Purification , and Application ) Sakshi Ghasle
 
Crayon Activity Handout For the Crayon A
Crayon Activity Handout For the Crayon ACrayon Activity Handout For the Crayon A
Crayon Activity Handout For the Crayon AUnboundStockton
 
History Class XII Ch. 3 Kinship, Caste and Class (1).pptx
History Class XII Ch. 3 Kinship, Caste and Class (1).pptxHistory Class XII Ch. 3 Kinship, Caste and Class (1).pptx
History Class XII Ch. 3 Kinship, Caste and Class (1).pptxsocialsciencegdgrohi
 
Organic Name Reactions for the students and aspirants of Chemistry12th.pptx
Organic Name Reactions  for the students and aspirants of Chemistry12th.pptxOrganic Name Reactions  for the students and aspirants of Chemistry12th.pptx
Organic Name Reactions for the students and aspirants of Chemistry12th.pptxVS Mahajan Coaching Centre
 
The Most Excellent Way | 1 Corinthians 13
The Most Excellent Way | 1 Corinthians 13The Most Excellent Way | 1 Corinthians 13
The Most Excellent Way | 1 Corinthians 13Steve Thomason
 
Proudly South Africa powerpoint Thorisha.pptx
Proudly South Africa powerpoint Thorisha.pptxProudly South Africa powerpoint Thorisha.pptx
Proudly South Africa powerpoint Thorisha.pptxthorishapillay1
 
Final demo Grade 9 for demo Plan dessert.pptx
Final demo Grade 9 for demo Plan dessert.pptxFinal demo Grade 9 for demo Plan dessert.pptx
Final demo Grade 9 for demo Plan dessert.pptxAvyJaneVismanos
 

Recently uploaded (20)

Introduction to AI in Higher Education_draft.pptx
Introduction to AI in Higher Education_draft.pptxIntroduction to AI in Higher Education_draft.pptx
Introduction to AI in Higher Education_draft.pptx
 
Call Girls in Dwarka Mor Delhi Contact Us 9654467111
Call Girls in Dwarka Mor Delhi Contact Us 9654467111Call Girls in Dwarka Mor Delhi Contact Us 9654467111
Call Girls in Dwarka Mor Delhi Contact Us 9654467111
 
How to Make a Pirate ship Primary Education.pptx
How to Make a Pirate ship Primary Education.pptxHow to Make a Pirate ship Primary Education.pptx
How to Make a Pirate ship Primary Education.pptx
 
internship ppt on smartinternz platform as salesforce developer
internship ppt on smartinternz platform as salesforce developerinternship ppt on smartinternz platform as salesforce developer
internship ppt on smartinternz platform as salesforce developer
 
Blooming Together_ Growing a Community Garden Worksheet.docx
Blooming Together_ Growing a Community Garden Worksheet.docxBlooming Together_ Growing a Community Garden Worksheet.docx
Blooming Together_ Growing a Community Garden Worksheet.docx
 
_Math 4-Q4 Week 5.pptx Steps in Collecting Data
_Math 4-Q4 Week 5.pptx Steps in Collecting Data_Math 4-Q4 Week 5.pptx Steps in Collecting Data
_Math 4-Q4 Week 5.pptx Steps in Collecting Data
 
Biting mechanism of poisonous snakes.pdf
Biting mechanism of poisonous snakes.pdfBiting mechanism of poisonous snakes.pdf
Biting mechanism of poisonous snakes.pdf
 
Painted Grey Ware.pptx, PGW Culture of India
Painted Grey Ware.pptx, PGW Culture of IndiaPainted Grey Ware.pptx, PGW Culture of India
Painted Grey Ware.pptx, PGW Culture of India
 
TataKelola dan KamSiber Kecerdasan Buatan v022.pdf
TataKelola dan KamSiber Kecerdasan Buatan v022.pdfTataKelola dan KamSiber Kecerdasan Buatan v022.pdf
TataKelola dan KamSiber Kecerdasan Buatan v022.pdf
 
Mastering the Unannounced Regulatory Inspection
Mastering the Unannounced Regulatory InspectionMastering the Unannounced Regulatory Inspection
Mastering the Unannounced Regulatory Inspection
 
भारत-रोम व्यापार.pptx, Indo-Roman Trade,
भारत-रोम व्यापार.pptx, Indo-Roman Trade,भारत-रोम व्यापार.pptx, Indo-Roman Trade,
भारत-रोम व्यापार.pptx, Indo-Roman Trade,
 
ENGLISH5 QUARTER4 MODULE1 WEEK1-3 How Visual and Multimedia Elements.pptx
ENGLISH5 QUARTER4 MODULE1 WEEK1-3 How Visual and Multimedia Elements.pptxENGLISH5 QUARTER4 MODULE1 WEEK1-3 How Visual and Multimedia Elements.pptx
ENGLISH5 QUARTER4 MODULE1 WEEK1-3 How Visual and Multimedia Elements.pptx
 
Paris 2024 Olympic Geographies - an activity
Paris 2024 Olympic Geographies - an activityParis 2024 Olympic Geographies - an activity
Paris 2024 Olympic Geographies - an activity
 
Hybridoma Technology ( Production , Purification , and Application )
Hybridoma Technology  ( Production , Purification , and Application  ) Hybridoma Technology  ( Production , Purification , and Application  )
Hybridoma Technology ( Production , Purification , and Application )
 
Crayon Activity Handout For the Crayon A
Crayon Activity Handout For the Crayon ACrayon Activity Handout For the Crayon A
Crayon Activity Handout For the Crayon A
 
History Class XII Ch. 3 Kinship, Caste and Class (1).pptx
History Class XII Ch. 3 Kinship, Caste and Class (1).pptxHistory Class XII Ch. 3 Kinship, Caste and Class (1).pptx
History Class XII Ch. 3 Kinship, Caste and Class (1).pptx
 
Organic Name Reactions for the students and aspirants of Chemistry12th.pptx
Organic Name Reactions  for the students and aspirants of Chemistry12th.pptxOrganic Name Reactions  for the students and aspirants of Chemistry12th.pptx
Organic Name Reactions for the students and aspirants of Chemistry12th.pptx
 
The Most Excellent Way | 1 Corinthians 13
The Most Excellent Way | 1 Corinthians 13The Most Excellent Way | 1 Corinthians 13
The Most Excellent Way | 1 Corinthians 13
 
Proudly South Africa powerpoint Thorisha.pptx
Proudly South Africa powerpoint Thorisha.pptxProudly South Africa powerpoint Thorisha.pptx
Proudly South Africa powerpoint Thorisha.pptx
 
Final demo Grade 9 for demo Plan dessert.pptx
Final demo Grade 9 for demo Plan dessert.pptxFinal demo Grade 9 for demo Plan dessert.pptx
Final demo Grade 9 for demo Plan dessert.pptx
 

How important is the social” insocial networking A perceiv

  • 1. How important is the “social” in social networking? A perceived value empirical investigation Mihail Cocosila Faculty of Business, Athabasca University, Athabasca, Canada, and Andy Igonor JR Shaw School of Business, Northern Alberta Institute of Technology, Edmonton, Canada Abstract Purpose – The purpose of this paper is to report on a value- based empirical investigation of the adoption of Twitter social networking application. The unprecedented popularity of social networking applications in a short time period warrants exploring theory- based reasons of their success. Design/methodology/approach – A cross-sectional survey-based study to elicit user views on Twitter was conducted with participants recruited through the web site of a North-American university. Findings – All facets of perceived value considered in the study (utilitarian, hedonic and social) had a significant and relatively strong influence on consumer intent to use Twitter. Quite surprisingly for a social networking application, though, the social value facet had comparatively the weakest contribution in the use equation.
  • 2. Research limitations/implications – User value perception might have been influenced by the features of the actual social networking application under scrutiny (i.e. Twitter in this case). Practical implications – To maximize the chances of success of new social networking applications, developers and marketers of these media should focus on the hedonic and utilitarian sides of their perceived value. Social implications – Additional efforts are necessary to better understand the reasons and factors leading to a comparatively lower social value perception of a social networking application, compared to its hedonic and utilitarian values. Originality/value – Overall, the study opens the door for investigating user perceptions on popular social networking applications in an effort to understand the unparalleled success of these services in a short time period. Keywords Perceptions, Social media, Technology adoption, Social networking, Perceived value, Twitter, User satisfaction Paper type Research paper 1. Introduction Social networking applications recorded an unprecedented success in just few of the recent years. For instance, people in the USA have been spending 22 per cent of the time they are online on social media sites while nine million users in Australia have been spending almost nine hours per month, on average, using top social media applications (Wikipedia, 2012). Despite these astonishing figures, the social networking domain is still little understood. Definitions and borders of the
  • 3. social networking (also called social media) phenomenon are still under debate. However, scholars seem to agree that content generated by users is the key feature of any social networking application. For instance, some conceptualization attempts define social media as “a group of Internet-based applications that build on the ideological and technological Information Technology & People Vol. 28 No. 2, 2015 pp. 366-382 © Emerald Group Publishing Limited 0959-3845 DOI 10.1108/ITP-03-2014-0055 Received 19 March 2014 Revised 19 August 2014 6 October 2014 Accepted 30 October 2014 The current issue and full text archive of this journal is available on Emerald Insight at: www.emeraldinsight.com/0959-3845.htm This research was supported by a grant from Athabasca University. 366 ITP 28,2
  • 4. foundations of Web 2.0, and that allow the creation and exchange of User Generated Content” (Kaplan and Haenlein, 2010). The exponential growth of the number of users and of the frequency of use of these applications together with the still not enough understood influence on various domains of human interaction (Gruzd et al., 2012; Shneiderman et al., 2011) attracted a justified interest from both the business community and the academia. While business decision makers are exploring ways to turn this phenomenon into profits, academia is seeking to investigate through theory-based approaches the reasons for this tremendous success (Abedniya and Mahmouei, 2010; Culnan et al., 2010; Spaulding, 2010; Zhao and Lu, 2012). As it is well-known from information systems (IS) research that user perceptions are, further than business or technical aspects, the key factor determining the success or failure of any new information technology (IT) application (Venkatesh et al., 2002), an interesting topic of research is to look at social networking applications from a technology acceptance point of view in order to understand their social penetration. Out of several possibilities of theoretical investigation examined by previous research (Al-Debei et al., 2013; Gruzd et al., 2012; Hargittai, 2007; Sinclaire and Vogus, 2011; Turel and Serenko, 2012; Xu et al., 2012), applying perceived value models seems to be
  • 5. particularly interesting since individuals are presumably using an IT application only if this has value for them. Perceived value concept is, thus, broader than business value that captures measurable benefits mainly (Culnan et al., 2010). Furthermore, value perception allows a more granular investigation as it captures and ranks individuals’ views from several perspectives. For these reasons perceived value approach has been used in IS research as a possible way to understand the adoption of other new (but fast becoming widely popular) IT artifacts like cell phone value- added services (Turel et al., 2007, 2010). The research reported here focuses on one of the most popular and frequently used social networking applications, Twitter, available at Twitter.com, in an effort to understand its user success through a theoretical lens. An empirical research investigating the role of a multi-sided perception of Twitter’s value in the use of this application was conducted with participants familiar with Twitter that were recruited through the web site of a university in North America. This paper reports on that research as follows: next two sections describe the theoretical background and the proposed research model. Following that, research methodology and main results are presented. A discussion section concludes the paper. 2. Theoretical background Investigating factors of adoption of new information technologies or applications has been
  • 6. a traditional area of research in IS. In addition to the popular models and theories validated in various studies (for a detailed review, see Venkatesh et al., 2002 study), a relatively newer approach has been to examine the adoption of an IT from a value perspective. This path was adapted from other disciplines like consumer behaviour or economics where value is used to explain why people buy some things or opt to make some expenses (Turel et al., 2010). Value is considered to source from the actual interaction with (or expected use of) a product or service and to reflect an overall perception upon their importance for an individual. Thus, following a rationale borrowed from consumer behaviour, value is captured as a perceived value concept through individual views on the difference between “what is received and what is given” (Zeithaml, 1988). Although value in marketing was traditionally associated with the perception of the utility of a product or service, more recent research using perceived value in other 367 A perceived value empirical investigation
  • 7. disciplines, including IS, acknowledged this construct to be multi-sided (Lee et al., 2002; Turel et al., 2007, 2010). Although the multi-dimensionality seems to better capture the complexity of the concept, there are no unanimous opinions on the actual facets of perceived value. A review of literature stemming from consumer behaviour research shows some of the most popular components of perceived value of an object or service to be the following (Bolton and Drew, 1991; Kim et al., 2007; Sweeney and Soutar, 2001; Sheth et al., 1991): • functional or utilitarian (i.e. perception of utility associated with the use); • emotional or hedonic (i.e. state of mood associated with the use); • monetary or value-for-money (i.e. utility compared to the cost usage involves); and • social (i.e. self-perception of social status associated with the use). Due to its complexity and multi-sided approach, perceived value is a possible lens to investigate the adoption of social networking applications that became overwhelmingly popular in recent years. Twitter micro-blogging service, allowing users to post 140- character long messages on their daily activities or opinions (Zhao and Rosson, 2009), is a typical example of success and, hence, an interesting avenue worth researching. Since its launch in 2006 this service grew exponentially thus reaching in
  • 8. early 2011 about 130 million postings (or “tweets”) per day and even 3,000 per second during major events worldwide (Wakefield, 2011). Among various attempts to understand the success of this social media platform from various angles, it would be interesting to investigate the role of the value users perceive in Twitter on their adoption intention as it is well - known in IS research that user perceptions are a key ingredient of the adoption equation. The use of a multi-sided value approach would allow also seeing whether social reasons are the main motivator of social media use, as opinions expressed on the internet often assume. Therefore, this study proposes the following research question: RQ1. What is the order of importance of the key facets of perceived value that influence the adoption of Twitter social networking application? 3. Research model To investigate the perceived value of Twitter, this study proposes a multi-faceted perceived value construct sourcing from consumer behaviour and IS research. This multi-dimensional value perception should have a positive influence on the intention to use the social medium since people would use a service if they perceive it as valuable for various reasons (Ho and Ko, 2008). Taking into the account of the above, the following hypothesis is proposed:
  • 9. H1. The overall perceived value of Twitter social networking application will have a positive effect on the behavioural intention to use this application. A consistent body of research identified three facets of perceived value, as discussed in the section above: utilitarian, hedonic and social (Brown and Venkatesh, 2005; Kim and Han, 2009; Kim et al., 2005). Some studies also include the monetary side borrowed from consumer behaviour as a distinct facet (Turel et al., 2010) or as a component of the utilitarian side (Rintamäki et al., 2006). As the use of social media, including Twitter, does generally not imply a fee or monetary expense, this research will, hence, consider 368 ITP 28,2 only the utilitarian, hedonic and social sides of perceived value as being significant. Therefore, users would perceive a value in this social media application if using it is observed to help accomplish some utility needs, to be a source of entertainment, and to meet social goals. To measure these aspects, following the example of similar work (Turel et al., 2007, 2010), perceived value is conceptualized as a second-order construct with three facets. Accordingly, the following hypotheses are
  • 10. formulated: H2-1. The utilitarian dimension of perceived value of Twitter social networking application will have a positive effect on the overall perceived value of this application. H2-2. The hedonic dimension of perceived value of Twitter social networking application will have a positive effect on the overall perceived value of this application. H2-3. The social dimension of perceived value of Twitter social networking application will have a positive effect on the overall perceived value of this application. As virtually all discussions in the media presume with consistency that the success of social networking applications reside mostly in their social implications, both in an individual and business context (Lorenzo-Romero et al., 2011), social facet of the perceived value is expected to be predominant in the adoption equation. Accordingly, in the attempt to identify at a granular level the key social aspects in the adoption equation, similar to previous research (Kwon and Wen, 2010), this research looks with magnifying lenses at the social dimension of perceived value. Previous research indicated enhancement of status (i.e. impression the individuals give to others) (Brown
  • 11. and Venkatesh, 2005; Rintamäki et al., 2006) and of self-esteem (i.e. one’s concept of self) (Rintamäki et al., 2006) as possible factors influencing perceived social value. These are conceptualized in the present study as image, that is an adaptation from Venkatesh and Davis (2000) and expresses individuals’ perception of their status in the social network. Another social aspect of using the IT put in light by previous research is group integration (i.e. socialization by belonging to groups) (Lee et al., 2002). Theoretical reasoning shows this feeling is captured partially through image and partially through perceived social presence. This latter is defined as individuals’ ability “to project themselves socially and affectively into a community” of users (Rourke et al., 1999), was taken into account in earlier IS research on traditional media (Yoo and Alavi, 2001) and is thought to be important for social media (Xu et al., 2012). It is believed that the above two factors would capture the enhancement of status sourcing from the individual perspective of the social environment. In addition to the above, to complete the picture, we suggest that two other factors may determine perceived social value by capturing the enhancement of self- concept because of the influence of the social environment on an individual: critical mass and social norm. Perceived critical mass, understood as a minimum level of users adopting an IT innovation after which “its further rate of adoption becomes
  • 12. self-sustaining” (Van Slyke et al., 2007), was shown to be an important factor of the adoption of the new IT (Hsu and Lu, 2004; Kumar and Benbasat, 2006). Since perceived critical mass depends on the number of users already using the system (hence this is an indicator of the social “success” of a system), it is considered as an antecedent of the perceived social value. Social norm (or subjective norm) is the social influence regarding the use of a new system. This represents “the degree to which an individual perceives that important 369 A perceived value empirical investigation others believe he or she should use the new system” (Venkatesh et al., 2003) and is an essential side of the social aspects of using a new IT (Dickinger et al., 2008). Taking into the account all of the above, the following hypotheses are formulated: H3-1. Image of users of Twitter social networking application will have a positive effect on the social dimension of the overall perceived value of this application.
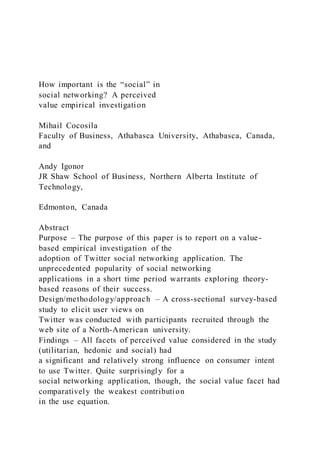
  • 13. H3-2. Perceived social presence of users of Twitter social networking application will have a positive effect on the social dimension of the overall perceived value of this application. H3-3. Perceived critical mass of users of Twitter social networking application will have a positive effect on the social dimension of the overall perceived value of this application. H3-4. Social norm exerted on users of Twitter social networking application will have a positive effect on the social dimension of the overall perceived value of this application. The theoretical model and associated hypotheses are captured in Figure 1. 4. Methodology Model and hypotheses were tested through a cross-sectional experiment comprising an online survey. To ensure reliable psychometric properties, survey questions measuring the items of the latent variables were adapted from measures previously validated in consumer behaviour and IS research, as reported in top publications (Cyr et al., 2009; Kim and Han, 2009; Turel et al., 2007; Van Slyke et al., 2007; Venkatesh and Davis, 2000). Survey measures and their related constructs are presented in the Appendix. Perceived
  • 15. Figure 1. Theoretical model and hypotheses 370 ITP 28,2 Participants were recruited through announcements posted on the main web page of the Faculty of Business of a North-American university. Including conditions required interested participants to be at least 18 years old and be familiar with Twitter without necessarily having an account with this service. Participation was anonymous and respondents were not compensated for completing the survey. The survey was offered online to all individuals who self- reported meeting the including conditions and were willing to participate. As the research targeted a dynamic IT domain, in order to ensure homogeneity of the data collected the survey instrument were available online for three months in the first half of the year 2012. This survey was part of a larger data collection process conducted in the same setting. 5. Main findings A total of 134 valid responses were recorded at the end of the three-month data
  • 16. collection. A demographic analysis indicated that respondents were 39.0 years old on average, 60.8 per cent female and 39.2 per cent male. Participants reported having an average experience with Twitter of 1.6 years and checking the service 20.1 times a week, on average. A per cent of 61.2 of the respondents reported having a Twitter account, 28.4 per cent not having an account, while the rest of 10.4 per cent preferred to not answer this question. Participants having an account reported posting 10.2 messages per week, on average. They were following (i.e. subscribing to the posts of) 84.8 accounts and were having 82.7 followers, on average. All 134 participant valid responses were subjected to the data analysis. Data collected were first subjected to a test for non-response bias. Following the example of previous research, this test was performed by comparing the key demographics of early to those of late responders (Dimoka et al., 2012; Sun et al., 2009). Averages for age, gender, Twitter experience and activity did not significantly differ between the two groups and, therefore, non-response bias was not considered an issue. A second step in the assessment of the quality of the data collected were to test on the existence of common method variance (CMV). Tests to, possibly, identify CMV appeared necessary since all variables in the model were measured through self-reported data collected in the same one-step survey (Sharma et al., 2009). A
  • 17. Harman’s one-factor test was conducted following Podsakoff et al. (2003). All measured items of the theoretical model were subjected to an exploratory factor analysis with no rotation in SPSS. The solution produced four factors with eigenvalues larger than 1.0, with the smallest one being 1.183. These four factors accounted for 76 per cent of the variance, with the first factor alone explaining 57 per cent, hence variables in the model load on more than one factor. A second test to detect possible CMV was conducted according to Pavlou et al. (2007). Thus, a visual inspection of the correlations of the model variables indicated the highest value to be 0.84 (Table IV), hence below the threshold of 0.90. Results of these two tests allow some confidence that there is no systematic CMV bias in the data (Turel and Serenko, 2012). Main data analysis were done with partial least squares (PLS) modelling method as this is suitable for small sample size exploratory models (Bontis, 1998), including those containing formative indicators (Thomas et al., 2005). Perceived overall value was measured as second-order latent variable using a repeated indicators approach (Lohmoller, 1989). 5.1 Measurement model evaluation Evaluation of the measurement model was done with SmartPLS (Ringle et al., 2005). A first run of the software indicated the necessity to eliminate two items (pertaining to utilitarian value and social value, respectively) out of the total of 29 of the entire
  • 18. 371 A perceived value empirical investigation model due to poor item-to-construct loading values. After re- running the program, all reflective constructs for both samples displayed composite reliability and Cronbach’s α values above 0.7 and average variance extracted (AVE) values above 0.5, as indicated in Table I. All first-order factor loadings were above 0.7, all items were significant at a level better than 0.05 (since t-valueW1.96), and all item errors were generally small, as Table II shows. Thus, based on the results captured in Tables I and II, the measurement Construct Composite reliability Cronbach’s α AVE Behavioural intention 0.992 0.984 0.984 Perceived critical mass 0.921 0.884 0.744 Hedonic value 0.965 0.954 0.845 Image 0.919 0.868 0.791 Perceived social presence 0.939 0.918 0.754 Social value 0.966 0.947 0.904 Social norm 0.965 0.928 0.933 Utilitarian value 0.979 0.968 0.939 Table I.
  • 19. Reliability measures for first-order constructs Component Factor loading SE t-Statistic BI1←behavioural intention 0.992 0.004 239.790 BI2←behavioural intention 0.992 0.005 218.917 HV1←hedonic value 0.935 0.014 65.185 HV2←hedonic value 0.934 0.018 52.779 HV3←hedonic value 0.854 0.049 17.494 HV4←hedonic value 0.937 0.016 59.081 HV5←hedonic value 0.935 0.016 58.848 I1←image 0.901 0.023 40.036 I2←Image 0.920 0.019 48.708 I3←image 0.845 0.064 13.130 PCM1←perceived critical mass 0.877 0.029 30.815 PCM2←perceived critical mass 0.926 0.022 41.786 PCM3←perceived critical mass 0.791 0.058 13.730 PCM4←perceived critical mass 0.850 0.047 18.192 PSP1←perceived social presence 0.904 0.025 35.654 PSP2←perceived social presence 0.825 0.071 11.677 PSP3←perceived social presence 0.830 0.048 17.403 PSP4←perceived social presence 0.912 0.018 50.444 PSP5←perceived social presence 0.868 0.038 23.069 SN1←social norm 0.969 0.008 118.585 SN2←social norm 0.962 0.013 74.850 SV1←social value 0.931 0.022 41.677 SV2←social value 0.963 0.012 78.133 SV4←social value 0.958 0.012 79.605 UV2←utilitarian value 0.975 0.009 109.164 UV3←utilitarian value 0.980 0.005 180.789 UV4←utilitarian value 0.952 0.014 68.311 Notes: PSP, perceived social presence; SN, social norm; I, image; PCM, perceived critical mass; UV, utilitarian value; HV, hedonic value; SV, social value; BI,
  • 20. behavioral intention. 1-5, item number Table II. Item loading and significance levels for first-order constructs 372 ITP 28,2 model was considered to have appropriate reliability and convergent validity (Bontis, 2004; Fornell and Larcker, 1981; Jarvenpaa et al., 2004). The following test consisted of examining the matrix of loadings and cross-loadings for first-order constructs produced by SmartPLS. As this matrix shows (Table III), the measurement model has appropriate discriminant validity because items load more on the latent variables they pertain to than on the other constructs (Gefen and Straub, 2005). This conclusion is reinforced by a visual inspection of the matrix in Table IV that displays the square root of AVEs for all first-order constructs on the diagonal and the construct correlations off diagonal. Since diagonal numbers are larger than all off diagonal numbers on the respective rows and columns, the condition for appropriate discriminant validity is met (Gefen and Straub, 2005).
  • 21. To test for possible multicollinearity problems, a variance inflation factor (VIF) was calculated for all relevant constructs by regressing each independent variable on the remaining antecedents of an endogenous variable. Since the VIFs for the four antecedents of social value were below 2.5 and those for the perceived overall value components did not exceed 4.5, hence below the threshold value of 5 (Hair et al., 2009), multicollinearity is not considered an issue for the measurement model. Confidence in appropriate discriminant validity is further increased by all AVE values being above 0.5 (Table I) and all inter-construct correlations being below 0.9 (Table IV) (Pavlou et al., 2007). Behavioural intention Perceived critical mass Hedonic value Image Perceived social presence Social value Social norm
  • 22. Utilitarian value BI1 0.992 0.589 0.845 0.539 0.572 0.642 0.480 0.788 BI2 0.992 0.563 0.828 0.507 0.550 0.612 0.441 0.774 HV1 0.806 0.635 0.935 0.538 0.637 0.608 0.496 0.846 HV2 0.807 0.592 0.934 0.557 0.618 0.655 0.551 0.828 HV3 0.717 0.507 0.854 0.391 0.490 0.534 0.283 0.735 HV4 0.793 0.581 0.937 0.565 0.527 0.739 0.537 0.729 HV5 0.749 0.534 0.935 0.468 0.517 0.673 0.475 0.677 I1 0.417 0.567 0.479 0.901 0.524 0.730 0.660 0.530 I2 0.570 0.577 0.506 0.920 0.625 0.697 0.645 0.561 I3 0.417 0.541 0.490 0.845 0.505 0.549 0.518 0.466 PCM1 0.419 0.877 0.459 0.572 0.622 0.546 0.439 0.526 PCM2 0.498 0.926 0.559 0.515 0.601 0.488 0.380 0.586 PCM3 0.693 0.791 0.647 0.545 0.568 0.514 0.424 0.661 PCM4 0.381 0.850 0.471 0.538 0.503 0.444 0.467 0.456 PSP1 0.599 0.630 0.581 0.540 0.904 0.542 0.488 0.643 PSP2 0.418 0.501 0.423 0.427 0.825 0.421 0.301 0.519 PSP3 0.532 0.560 0.579 0.468 0.830 0.492 0.378 0.592 PSP4 0.454 0.610 0.534 0.629 0.912 0.617 0.534 0.554 PSP5 0.453 0.592 0.513 0.602 0.868 0.519 0.491 0.574 SN1 0.449 0.497 0.506 0.673 0.518 0.647 0.969 0.455 SN2 0.449 0.460 0.484 0.659 0.473 0.584 0.962 0.477 SV1 0.548 0.535 0.654 0.705 0.571 0.931 0.598 0.504 SV2 0.630 0.588 0.665 0.730 0.596 0.963 0.639 0.577 SV4 0.624 0.535 0.676 0.701 0.553 0.958 0.584 0.582 UV2 0.777 0.606 0.786 0.561 0.625 0.549 0.477 0.975 UV3 0.754 0.635 0.794 0.563 0.632 0.547 0.453 0.980 UV4 0.758 0.648 0.833 0.581 0.670 0.599 0.471 0.952 Table III. Loadings and cross-loadings for
  • 23. first-order constructs 373 A perceived value empirical investigation 5.2 Structural model evaluation As the measurement model evaluation indicated appropriate reliability and construct (i.e. convergent and discriminant) validity levels for all first- order constructs, evaluation of the structural model came next. Results of this evaluation are depicted in Table V and Figure 2. Table V and Figure 2 indicate that five out of the eight hypotheses made were confirmed. Perceived overall value is a key antecedent of the intention to use the social networking application explaining 72.8 per cent of the variance of the latter. All three facets of perceived value are significant components in the second-order construct (at a level p-valueo0.001) with moderately high values of the path coefficients: between 0.26 and 0.51. Analysis of the total effects of first-order constructs on the behavioural intention provided by SmartPLS and captured in Table VI confirms that hedonic value is the most important
  • 24. value facet in the adoption equation: its total effect coefficient is 0.438 compared with 0.275 for the utilitarian value and 0.226 for the social value. All demographic characteristics collected about the sample respondents were tested as possible control variables by assessing their path coefficients to the endogenous variables of the model. Each variable was added to the model and SmartPLS was rerun every time. No changes in the measurement model were noticed. Structural changes were noticed in only two situations: (1) having a Twitter account had a path coefficient of 0.106 (significant at the 0.01 level) to the behavioural intention and increased the R2 of this latter from 0.728 to 0.739; and BI PCM HV I PSP SV SN UV BI 0.992 PCM 0.581 0.863 HV 0.843 0.621 0.919 I 0.528 0.631 0.551 0.889 PSP 0.566 0.669 0.608 0.621 0.868 SV 0.632 0.582 0.700 0.749 0.603 0.951 SN 0.464 0.496 0.513 0.690 0.514 0.639 0.966 UV 0.788 0.650 0.831 0.587 0.663 0.584 0.482 0.969 Notes: PSP, perceived social presence; SN, social norm; I, image; PCM, perceived critical mass; UV, utilitarian value; HV, hedonic value; SV, social value; BI, behavioural Intention
  • 25. Table IV. Square-root AVEs and correlation coefficients for first- order constructs Hypothesis Path Path coefficient SE t-Statistic p-Value H1 Perceived value→behavioural intention 0.853 0.036 23.761 o0.001 H2-1 Utilitarian value→perceived value 0.322 0.014 23.016 o0.001 H2-2 Hedonic value→perceived value 0.513 0.017 30.757 o0.001 H2-3 Social value→perceived value 0.264 0.014 19.119 o0.001 H3-1 Image→social value 0.460 0.134 3.420 o0.001 H3-2 Perceived social presence→social value 0.157 0.118 1.335 0.184 H3-3 Perceived critical mass→social value 0.089 0.109 0.816 0.416 H3-4 Social norm→social value 0.197 0.124 1.583 0.116 Table V. Path coefficients, standard errors and significance levels 374 ITP 28,2 (2) the frequency of checking Twitter had a path coefficient of 0.180 (significant
  • 26. at the 0.05 level) to the perceived social value and increased the R2 of this latter from 0.617 to 0.647. To further investigate the possible influence of not having a Twitter account, responses from this category of participants were removed from the initial sample and the entire analysis described above was repeated for the resulting sample of 96 participants. Following that, a path-by-path comparison was done by evaluating a t-statistic of the absolute difference between the corresponding path coefficients in the two cases – i.e., full sample and reduced sample (Ahuja and Thatcher, 2005; Chin, 2000): t ¼ ðPath1�Path2Þ=½Spooled � sqrt ð1=N1þ1=N2Þ� Perceived Overall Value Behavioral Intention Utilitarian Value Hedonic Value Social Value
  • 27. Image Social Presence Social Norm Second Order 0.322*** 0.513*** 0.264*** R2=0.617 R2=0.728 0.460*** 0.157 0.089 0.197 0.853*** Critical Mass Note: Significant level: *** = 0.001 Figure 2. Results of structural evaluation Antecedent construct Total effect coefficient SE t-Statistic p- Value
  • 28. Utilitarian value 0.275 0.015 18.027 o0.001 Hedonic value 0.438 0.021 21.174 o0.001 Social value 0.226 0.014 15.825 o0.001 Image 0.104 0.032 3.283 o0.001 Perceived social presence 0.036 0.026 1.346 0.181 Perceived critical mass 0.020 0.025 0.805 0.422 Social norm 0.044 0.028 1.606 0.111 Table VI. Total effects of first- order constructs on behavioural intention 375 A perceived value empirical investigation where Path1 and Path2 are the corresponding path coefficients in the two analyses and N1 and N2 are the respective sample sizes. Spooled is the pooled estimator for the variance assessed with the formula: Spooled ¼ sqrtf square of N1�1ð Þ= N1þN2�2ð Þ � � � square ofSe1 þ½square of ðN2�1Þ=ðN1þN2�2Þ� � square ofSe2g
  • 29. where Se1 and Se2 are the standard errors of the path coefficients in the two analyses. Results depicted in Table VII do not show any statistically significant difference between the model run with the full sample and that with the Twitter account holders’ sample. All other demographic factors (age, gender, experience with the application, number of messages posted per week and number of accounts followed or of followers) did not have an influence over the model as possible control variables. Small increases in R2 of the endogenous constructs were noticed but no significant paths to these constructs were recorded. 6. Discussion and conclusions The objective of this paper has been to propose a value-based theoretical model to explain the adoption of Twitter, a very popular social networking application. A model based on consumer behaviour and IS literature findings as well as on theoretical reasoning was built and tested empirically with 134 North- American respondents recruited online. The research question asked was: What is the order of importance of the key facets of perceived value that influence the adoption of Twitter social networking application? Similar to previous research, perceived value was considered as a second-order
  • 30. construct with three salient facets: utilitarian, hedonic and social. As in previous research, all facets were found to have a significant and relatively strong influence (Rintamäki et al., 2006; Turel et al., 2007). However, as a surprise for a social media application, though, the social side had comparatively the weakest contribution to the overall perceived value (path coefficient of 0.26). Hedonic value was by far the strongest component of the overall value (path coefficient of 0.51), followed by the utilitarian side (path coefficient of 0.32). This shows that people see enjoyment- type value followed by the utilitarian perception as the most important factors that would make them use the social media platform and this also confirms findings of Hypothesis Path Full sample path coefficient Account holders’ sample path coefficient Path coefficient
  • 31. absolute difference p-Value of the difference H1 Perceived value→behavioral intention 0.853 0.823 0.030 0.95 H2-1 Utilitarian value→perceived value 0.322 0.341 0.019 0.56 H2-2 Hedonic value→perceived value 0.513 0.528 0.015 0.88 H2-3 Social value→perceived value 0.264 0.253 0.011 0.59 H3-1 Image→social value 0.460 0.432 0.028 0.94 H3-2 Perceived social presence→social value 0.157 0.145 0.012 0.62 H3-3 Perceived critical mass→social value 0.089 0.101 0.012 0.96 H3-4 Social norm→social value 0.197 0.207 0.010 0.40 Table VII. Model comparison between full sample (134 Respondents) and twitter account holders’ sample (96 respondents) 376 ITP 28,2 previous research on the significance of these factors (Han and
  • 32. Windsor, 2011; Kim et al., 2011; Lin and Lu, 2011; Turel and Serenko, 2012). Only lastly users see this application as a valuable social tool. Overall, seeing value in Twitter is by itself a sufficiently strong reason for adoption (R2 ¼ 0.728). Of the hypothesized antecedents of the social side of the value, only the perception of enhancement of social status (conceptualized as image) proved to be significant and moderately strong (path coefficient of 0.46). Hence, people would see improving their image as the only reason of using Twitter from a social point of view and this is confirming previous research on social networking (Kim et al., 2011). The study did not show a significant effect of the influence from significant others (captured as social norm), of perceived social presence (of their peers) or of critical mass (of users). A possible explanation of these findings is that Twitter, despite its relative newness, already reached maturity in terms of social penetration due to an exponential increase of the adoption rate, so the user popularity and online activeness are not an issue. Therefore, when considering social reasons for using Twitter, people are looking only at improving the social status among their peers. 6.1 Contributions to research This study proposed a comprehensive theoretical model of the adoption of a popular social networking application (Twitter). The model relies on a multi-sided perceived
  • 33. value concept adapted from consumer behaviour research. Further, as a significant theoretical contribution, for the in-depth investigation of the social reasons to adopt a social networking application, the study integrated theoretically four antecedents of the social dimension of the perceived value: image, perceived social presence, perceived critical mass and social norm. We found that five of the eight hypotheses proposed were supported at the statistical level of 0.001 or better and the corresponding path coefficients were moderately high. Of the four antecedents of the social value hypothesized, only image was statistically significant but, nonetheless, it explained a moderately high per cent of the variance of social value: 61.7 per cent. Overall, since the majority of the hypotheses were supported and R2 values of the endogenous variables were relatively high for the IS domain research (e.g. 72.8 per cent for the behavioral intention), the theoretical model could be termed as appropriate (Bontis et al., 2000). Therefore, the model proposed by this study is suitable in reflecting viewpoints on adopting Twitter social networking application from a user value perspective. 6.2 Contributions to practice Our results indicated that, surprisingly, the social dimension of the value perception of this popular social media application is, comparatively, the weakest reason for its adoption, following the perception of enjoyment and utility values. Therefore, individuals and businesses seeking to use Twitter for social networking
  • 34. should have enjoyment and utility of their posts as primary objectives in order to be effective in broadcasting their messages to a large number of users. Despite its relatively weaker contribution, social value is a significant contributor to use intent and should not be neglected. Perception of Twitter’s social value is significantly enhanced by a bi - directional image construct capturing both status (through impression individuals think they make on others) and self-esteem (through concept of self). Therefore, individuals and businesses using such a social networking application should consider the image they are promoting through the network on one side and, also, that other contributors to the network are acknowledging the importance of their image too. 377 A perceived value empirical investigation 6.3 Limitations and future research This study involved also limitations, as virtually any empirical research on IT adoption. Respondents self-selected after seeing the invitation to participation posted on a faculty’s web site. The perceived value may be also influenced by the features of that social
  • 35. networking application (i.e. Twitter in this case). As the experiment was limited in time to three months, the sample size was moderately low but, nonetheless, 20 per cent more than the minimum sample size required by PLS methodology (Jarvenpaa and Todd, 1996). Since the recruitment process was not controlled, the valid sample resulted as being slightly biased towards female respondents (60.8 per cent female and 39.2 per cent male). However, gender was not found to have a significant influence in the theoretical model at a statistical level of 0.05 or better when tested as a potential control variable. As in virtually any empirical research, there is also the question of the generalizability of the findings. Since the research was open online to anyone meeting the including conditions, without being restricted to a location or category of users of the IT, it is believed the results are applicable to any individual 18 years or older and familiar with Twitter. Overall, these limitations are not uncommon to IS research and were considered acceptable for an incipient study in a new direction. Structural tests also revealed the influence of some control variables. Thus, it appears that having an account and checking Twitter more often make people see more value in Twitter and want to continue using this networking application. This may open the door for interesting questions on the value users would see over time or over the increased frequency of use of the social networking. Future research should look in
  • 36. more detail at whether the more use would still mean the better value. That research should also confirm whether the social side is indeed the least important part of the value perceived in a social networking platform (compared to enjoyment and utility) while trying to enrich the picture with antecedents of the utilitarian and hedonic facets. Overall, this study attempted to conduct a scientific investigation on the user reasons to adopt a popular social networking application, Twitter, based on perceived value theory. It opened the door for investigating the same application in other research contexts or other popular social networking applications from the user perspective in an effort to understand the unprecedented success of these services in just a few years’ time. References Abedniy, A.A. and Mahmouei, S.S. (2010), “The impact of social networking websites to facilitate the effectiveness of viral marketing”, International Journal of Advanced Computer Science and Applications, Vol. 1 No. 6, pp. 139-146. Ahuja, M.K. and Thatcher, J.B. (2005), “Moving beyond intentions and toward the theory of trying: effects of work environment and gender on post- adoption information technology use”, MIS Quarterly, Vol. 29 No. 3, pp. 427-459. Al-Debei, M.M., Al-Lozi, E. and Papazafeiropoulou, A. (2013), “Why people keep coming back to
  • 37. facebook: explaining and predicting continuance participation from an extended theory of planned behaviour perspective”, Decision Support Systems, Vol. 55 No. 1, pp. 43-54. Bolton, R.N. and Drew, J.H. (1991), “A multistage model of customers’ assessments of service quality and value”, Journal of Consumer Research, Vol. 17 No. 4, pp. 375-384. Bontis, N. (1998), “Intellectual capital: an exploratory study that develops measures and models”, Management Decision, Vol. 36 No. 2, pp. 63-76. Bontis, N. (2004), “National intellectual capital index: a United Nations initiative for the Arab region”, Journal of Intellectual Capital, Vol. 5 No. 1, pp. 13-39. 378 ITP 28,2 Bontis, N., Keow, W.C.C. and Richardson, S. (2000), “Intellectual capital and business performance in Malaysian industries”, Journal of Intellectual Capital, Vol. 1 No. 1, pp. 85-100. Brown, S.A. and Venkatesh, V. (2005), “Model of adoption of technology in households: a baseline model test and extension incorporating household life cycle”, MIS Quarterly, Vol. 29 No. 3, pp. 399-426.
  • 38. Chin, W.W. (2000), “Frequently asked questions – partial least squares & PLS-graph”, The University of Houston, Houston, TX, available at: http://disc- nt.cba.uh.edu/chin/plsfaq/ plsfaq.htm (accessed 8 July 2014). Culnan, M.J., McHugh, P.J. and Zubillaga, J.I. (2010), “How large US companies can use twitter and other social media to gain business value”, MIS Quarterly Executive, Vol. 9 No. 4, pp. 243-259. Cyr, D., Head, M., Larios, H. and Pan, B. (2009), “Exploring human images in website design: a multi-method approach”, MIS Quarterly, Vol. 33 No. 3, pp. 539-566. Dickinger, A., Arami, M. and Meyer, D. (2008), “The role of perceived enjoyment and social norm in the adoption of technology with network externalities”, European Journal of Information Systems, Vol. 17 No. 1, pp. 4-11. Dimoka, A., Hong, Y. and Pavlou, P.A. (2012), “On product uncertainty in online markets: theory and evidence”, MIS Quarterly, Vol. 36 No. 2, pp. 395-A15. Fornell, C. and Larcker D.F. (1981), “Evaluating structural equation models with unobservable variables and measurement error”, Journal of Marketing Research, Vol. 18 No. 1, pp. 39-50. Gefen, D. and Straub, D. (2005), “A practical guide to factorial validity using PLS-Graph: tutorial and annotated example”, Communications of the Association for Information Systems, Vol. 16 No. 1, pp. 91-109.
  • 39. Gruzd, A., Staves, K. and Wilk, A. (2012), “Connected scholars: examining the role of social media in research practices of faculty using the UTAUT model”, Computers in Human Behavior, Vol. 28 No. 6, pp. 2340-2350. Hair, J.F., Black, W.C., Babin, B.J. and Anderson, R.E. (2009), Multivariate Data Analysis, Prentice Hall, Upper Saddle River, NJ. Han, B. and Windsor, J. (2011), “User’s willingness to pay on social network sites”, The Journal of Computer Information Systems, Vol. 51 No. 4, pp. 31-40. Hargittai, E. (2007), “Whose space? Differences among users and non-users of social network sites”, Journal of Computer-Mediated Communication, Vol. 13 No. 1, pp. 276-297. Ho, S.H. and Ko, Y.Y. (2008), “Effects of self-service technology on customer value and customer readiness: the case of Internet banking”, Internet Research, Vol. 18 No. 4, pp. 427-446. Hsu, C.L. and. Lu, H.P. (2004), “Why do people play on-line games? An extended TAM with social influences and flow experience”, Information & Management, Vol. 41 No. 7, pp. 853-868. Jarvenpaa, S.L. and Todd, P.A. (1996), “Consumer reactions to electronic shopping on the world Wide Web”, International Journal of Electronic Commerce, Vol. 1 No. 2, pp. 59-88. Jarvenpaa, S.L., Shaw, T.R. and Staples, D.S. (2004), “Toward
  • 40. contextualized theories of trust: the role of trust in global virtual teams”, Information Systems Research, Vol. 15 No. 3, pp. 250-267. Kaplan, A.M. and Haenlein, M. (2010), “Users of the world, unite! The challenges and opportunities of social media”, Business Horizons, Vol. 53 No. 1, pp. 59-68. Kim, B. and Han, I. (2009), “What drives the adoption of mobile data services? An approach from a value perspective”, Journal of Information Technology, Vol. 24 No. 1, pp. 35-45. Kim, H.W., Chan, H.C. and Gupta, S. (2007), “Value-based adoption of mobile internet: an empirical investigation”, Decision Support Systems, Vol. 43 No. 1, pp. 111-126. 379 A perceived value empirical investigation http://disc- nt.cba.uh.edu/chin/plsfaq/plsfaq. htm http://disc- nt.cba.uh.edu/chin/plsfaq/plsfaq. htm
  • 41. Kim, H.W., Gupta, S. and Koh, J. (2011), “Investigating the intention to purchase digital items in social networking communities: a customer value perspective”, Information & Management, Vol. 48 No. 230, pp. 228-234. Kim, S.S., Malhotra, N.K. and Narasimhan, S. (2005), “Two competing perspectives on automatic use: a theoretical and empirical comparison”, Information Systems Research, Vol. 16 No. 4, pp. 418-432. Kumar, N. and Benbasat, I. (2006), “The influence of recommendations and consumer reviews on evaluations of websites”, Information Systems Research, Vol. 7 No. 4, pp. 425-439. Kwon, O. and Wen, Y. (2010), “An empirical study of the factors affecting social network service use”, Computers in Human Behavior, Vol. 26 No. 2, pp. 254- 263. Lee, Y., Kim, J., Lee, I. and Kim, H. (2002), “A cross-cultural study on the value structure of mobile internet usage: comparison between Korea and Japan”, Journal of Electronic Commerce Research, Vol. 3 No. 4, pp. 227-239. Lin, K.Y. and Lu, H.P. (2011), “Why people use social networking sites: an empirical study integrating network externalities and motivation theory”, Computers in Human Behavior, Vol. 27 No. 3, pp. 1152-1161. Lohmoller, J.B. (1989), Latent Variable Path Modelling with Partial Least Squares, Physica-Verlag,
  • 42. Heidelberg. Lorenzo-Romero, C., Constantinides, E. and Alarcón-Del-Amo, M.C. (2011), “Consumer adoption of social networking sites: implications for theory and practice”, Journal of Research in Interactive Marketing, Vol. 5 Nos 2/3, pp. 170-188. Pavlou, P.A., Liang, H. and Xue, Y. (2007), “Understanding and mitigating uncertainty in online exchange relationships: a principal-agent perspective”, MIS Quarterly, Vol. 31 No. 1, pp. 105-136. Podsakoff, P.M., Mackenzie, S.B., Lee, J.Y. and Podsakoff, N.P. (2003), “Common method biases in behavioral research: a critical review of the literature and recommended remedies”, Journal of Applied Psychology, Vol. 88 No. 5, pp. 879-903. Ringle, C., Wende, M.S. and Will, S. (2005), “SmartPLS 2.0 (M3) beta”, available at: www.smartpls.de (accessed 8 October 2013). Rintamäki, T., Kanto, A. and Spence, M.T. (2006), “Decomposing the value of department store shopping into utilitarian, hedonic, and social dimensions”, International Journal of Retail and Distribution Management, Vol. 34 No. 1, pp. 6-24. Rourke, I., Anderson, T., Garrison, D.R. and Archer, W. (1999), “Assessing social presence in asynchronous, text-based computer conferencing”, Journal of Distance Education, Vol. 14 No. 3, pp. 51-70.
  • 43. Sharma, R., Yetton, P. and Crawford, J. (2009), “Estimating the effect of common method variance: the method-method pair technique with an illustration from TAM research”, MIS Quarterly, Vol. 33 No. 3, pp. 473-490. Sheth, J.D., Newman, B.I. and Gross, B.I. (1991), Consumption Values and Market Choice, South Western Publishing, Cincinnati, OH. Shneiderman, B., Preece, J. and Pirolli, P. (2011), “Realizing the value of social media requires innovative computing research”, Communications of the ACM, Vol. 54 No. 9, pp. 34-37. Sinclaire, J.K. and Vogus, C.E. (2011), “Adoption of social networking sites: an exploratory adaptive structuration perspective for global organizations”, Information Technology and Management, Vol. 12 No. 4, pp. 293-314. Spaulding, T.J. (2010), “How can virtual communities create value for business?”, Electronic Commerce Research and Applications, Vol. 9 No. 1, pp. 38-49. 380 ITP 28,2 www.smartpls.de Sun, Y., Bhattacherjee, A. and Ma, Q. (2009), “Extending technology usage to work settings: the role of perceived work compatibility in ERP implementation”,
  • 44. Information and Management, Vol. 46 No. 6, pp. 351-356. Sweeney, J. and Soutar, G.N. (2001), “Consumer perceived value: the development of a multiple item scale”, Journal of Retailing, Vol. 77 No. 2, pp. 203-220. Thomas, R.D., Lu, I.R.R. and Cedzynski, M. (2005), “Partial least squares: a critical review and a potential alternative”, Proceedings of Administrative Sciences Association of Canada (ASAC) Conference, Toronto, 28-31 May. Turel, O. and Serenko, A. (2012), “The benefits and dangers of enjoyment with social networking websites”, European Journal of Information Systems, Vol. 21 No. 5, pp. 512-528. Turel, O., Serenko, A. and Bontis, N. (2007), “User acceptance of wireless short messaging services: deconstructing perceived value”, Information and Management, Vol. 44 No. 1, pp. 63-73. Turel, O., Serenko, A. and Bontis, N. (2010), “User acceptance of hedonic digital artifacts: a theory of consumption values perspective”, Information and Management, Vol. 47 No. 1, pp. 53-59. Van Slyke, C., Ilie, V., Lou, H. and Stafford, T. (2007), “Perceived critical mass and the adoption of a communication technology”, European Journal of Information Systems, Vol. 16 No. 3, pp. 270-283. Venkatesh, V. and Davis, F. (2000), “A theoretical extension of the technology acceptance model:
  • 45. four longitudinal field studies”, Management Science, Vol. 46 No. 2, pp. 186-204. Venkatesh, V., Morris, M.G., Davis, G.B. and Davis, F.D. (2003), “User acceptance of information technology: toward a unified view”, MIS Quarterly, Vol. 27 No. 3, pp. 425-478. Venkatesh, V., Speier, C. and Morris, M.G. (2002), “User acceptance enablers in individual decision making about technology: toward an integrated model”, Decision Sciences, Vol. 33 No. 2, pp. 297-316. Wakefield, J. (2011), “Twitter dismisses $10bn Google deal and talks up mobile”, available at: www.bbc.co.uk/news/technology-12462653 (accessed 15 May 2011). Wikipedia (2012), “Social media”, availabe at: http://en.wikipedia.org/wiki/Social_media (accessed 26 November 2012). Xu, C., Ryan, S., Prybutok, V. and Wen, C. (2012), “It is not for fun: an examination of social network site usage”, Information & Management, Vol. 49 No. 5, pp. 210-217. Yoo, Y. and Alavi, M. (2001), “Media and group cohesion: relative influences on social presence, task participation and group consensus”, MIS Quarterly, Vol. 25 No. 3, pp. 371-390. Zeithaml, V.A. (1988), “Consumer perceptions of price, quality and value: a means-end model and synthesis of evidence”, Journal of Marketing, Vol. 52 No. 3, pp.
  • 46. 2-22. Zhao, D. and Rosson, M.B. (2009), “How and why people twitter: the role that microblogging plays in informal communication at work”, GROUP’09 Conference, Sanibel Island, FL, 10-13 May. Zhao, L. and Lu, Y. (2012), “Enhancing perceived interactivity through network externalities: an empirical study on micro-blogging service satisfaction and continuance intention”, Decision Support Systems, Vol. 53 No. 4, pp. 825-834. Appendix. Survey questions for each theoretical model construct Perceived social presence There is a sense of human contact in using Twitter. There is a sense of personalness in using Twitter. There is a sense of sociability in using Twitter. There is a sense of human warmth in using Twitter. There is a sense of human sensitivity in using Twitter. 381 A perceived value empirical investigation www.bbc.co.uk/news/technology-12462653 http://en.wikipedia.org/wiki&#x 0002F;Social_media
  • 47. Social norm People who influence my behavior think that I should use Twitter. People who are important to me think that I should use Twitter. Image People among my peers who use Twitter have more prestige than those who do not use it. People among my peers who use Twitter have a high profile. Using Twitter is a status symbol among my peers. Perceived critical mass Many people I communicate with use Twitter. The people I communicate with will continue to use Twitter in the future. The people I communicate with using Twitter will continue to use Twitter in the future. Of the people I communicate with regularly, many use Twitter. Utilitarian value As it is free, the use of Twitter offers a good value for the money. Compared to the effort I need to put in, the use of Twitter is beneficial to me. Compared to the time I need to spend, the use of Twitter is worthwhile to me. Overall, the use of Twitter is delivering me good value. Hedonic value Twitter is a social media that I enjoy. Twitter is a social media that makes me want to use it. Twitter is a social media that I feel relaxed about using. The use of Twitter makes me feel good. The use of Twitter gives me pleasure. The use of Twitter helps me feel acceptable.
  • 48. Social value The use of Twitter improves the way I am perceived. The fact I use Twitter makes a good impression on other people. The use of Twitter gives me social approval. Behavioural intention Assuming I have access to Twitter, I intend to use it in the future. Given that I have access to Twitter, I predict that I would use it in the future. About the authors Dr Mihail Cocosila is an Associate Professor, in Management Science and e-Commerce, in the Faculty of Business of Athabasca University. His research interests include information technology adoption and use, topics in information systems, human- computer interaction, mobile and wireless services and health informatics. His recent journal publications include Communications of the ACM, Communications of the AIS, Canadian Journal of Administrative Sciences, Journal of Medical Internet Research and Electronic Markets – The International Journal on Networked Business. Dr Mihail Cocosila is the corresponding author and can be contacted at: [email protected] Dr Andy Igonor currently Chairs the Bachelor of Business Administration program at the Northern Alberta Institute of Technology, Edmonton Canada. His research interests include information technology strategy and capability development in SMEs, information security and privacy. For instructions on how to order reprints of this article, please visit our website:
  • 49. www.emeraldgrouppublishing.com/licensing/reprints.htm Or contact us for further details: [email protected] 382 ITP 28,2 mailto:[email protected]Outline placeholderAppendix.Survey questions for each theoretical model construct