1. 3 June 2013 WWW.LCC.ASIA
IMPORTANT DISCLAIMER
This report has been prepared by Lincoln Crowne & Company Pty. Limited ("LCC"). The research is based on information obtained from sources believed to be
accurate and reliable. LCC does not guarantee the accuracy, reliability, completeness or suitability of any such information and makes no warranty, guarantee or
representation, expressly or impliedly about this research. LCC accepts no obligation to correct or update the information. No opinion or recommendation is made
within this research. This report is not intended to be, nor should it be relied on, as a substitute for professional advice. This report should not be relied upon as the
sole basis for any investment decision or planning, and LCC does not accept any responsibility on this basis for actions made.
WEEKLY
Global Economy Fundamentals
Precious Metals
Last Close Price
(in USD)
Energy and Commodities
Last Close Price
(in USD)
Gold Comex ($/oz) 1393 ▼ -17% ▼ -5% ▲ 0% Crude Oil ($/barrel) 92.0 ▲ 0.9% ▼ -1.4% ▼ -2%
Silver ($/oz) 22.2 ▼ -29% ▼ -8% ▼ -1% Natural Gas ($/gallon) 4.0 ▲ 19.1% ▼ -8.0% ▼ -7%
Copper LME ($/lb) 3.38 ▼ -9% ▲ 4% ▼ 0% Coal - Central Appalachian 61.8 ▲ 0.1% ▲ 2.0% ▲ 1%
Platinum ($/oz) 1462 ▼ -4% ▼ -3% ▲ 1% Corn ($/bushel) 5.7 ▼ -17.7% ▼ -11.7% ▲ 6%
Palladium ($/oz) 751 ▲ 8% ▲ 8% ▲ 3% Wheat ($/bushel) 7.1 ▼ -8.5% ▼ -3.4% ▲ 1%
Exchange Rates Last Close Price Global Index Last Close Price
AUD/USD 0.96 ▼ -8% ▼ -8% ▼ -1% ASX 200 4926.6 ▲ 6% ▼ -5% ▼ -1%
EUR/USD 1.30 ▼ -2% ▼ -2% ▲ 0% Dow Jones Industry Average 15115.6 ▲ 14% ▲ 2% ▼ -1%
GBP/USD 1.52 ▼ -7% ▼ -3% ▲ 0% NYSE 9302.3 ▲ 10% ▲ 0% ▼ -1%
RMB/USD 0.16 ▲ 2% ▲ 0% ▼ 0% FTSE 100 6583.1 ▲ 11% ▲ 2% ▼ -1%
INR/USD 0.0177 ▼ -3% ▼ -5% ▼ -1% Shang Hai Exchange 2300.6 ▲ 2% ▲ 6% ▲ 1%
YEN/USD 0.0099 ▼ -15% ▼ -3% ▼ 0% Nikkei 225 13774.5 ▲ 30% ▲ 0% ▼ -6%
CAD/USD 0.97 ▼ -4% ▼ -3% ▼ 0% CAC 40 3948.6 ▲ 9% ▲ 2% ▼ 0%
ZAR/USD 0.10 ▼ -17% ▼ -11% ▼ -5% German DAX 8348.8 ▲ 10% ▲ 5% ▲ 1%
CHF/USD 1.04 ▼ -5% ▼ -3% ▲ 0% Hang Seng Index 22392.2 ▼ -1% ▼ -1% ▼ -1%
Week Change
Week Change4-Week ChangeYTD Change
YTD Change
YTD Change
YTD Change Week Change
Week Change
4-Week Change4-Week Change
4-Week Change
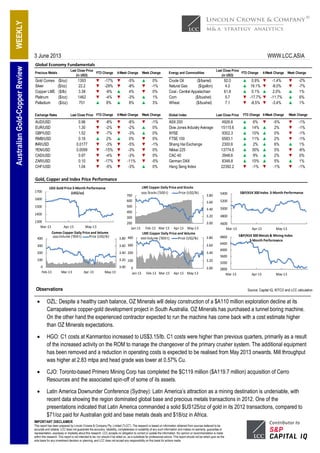
Gold, Copper and Index Price Performance
1300
1400
1500
1600
1700
Mar-13 Apr-13 May-13
USD Gold Price 3-Month Performance
(US$/oz)
2800
3200
3600
4000
4400
4800
Mar-13 Apr-13 May-13
S&P/ASX 300 Metals& Mining Index
3-Month Performance
4600
4800
5000
5200
5400
Mar-13 Apr-13 May-13
S&P/ASX 300 Index 3-Month Performance
3.00
3.20
3.40
3.60
3.80
0
100
200
300
400
Jan-13 Feb-13 Mar-13 Apr-13 May-13
LME Copper Daily Price and Volume
Volume ('000 t) Price (US$/lb)
3.00
3.20
3.40
3.60
3.80
200
300
400
500
600
700
Jan-13 Feb-13 Mar-13 Apr-13 May-13
LME Copper Daily Price and Stocks
Stocks ('000 t) Price (US$/lb)
3.00
3.20
3.40
3.60
3.80
0
100
200
300
400
Feb-13 Mar-13 Apr-13 May-13
Comex Copper Daily Price and Volume
Volume ('000 t) Price (US$/lb)
Source: Capital IQ, KITCO and LCC calculation
AustralianGold-CopperReview
OZL: Despite a healthy cash balance, OZ Minerals will delay construction of a $A110 million exploration decline at its
Carrapateena copper-gold development project in South Australia. OZ Minerals has purchased a tunnel boring machine.
On the other hand the experienced contractor expected to run the machine has come back with a cost estimate higher
than OZ Minerals expectations.
HGO: C1 costs at Kanmantoo increased to US$3.15/lb. C1 costs were higher than previous quarters, primarily as a result
of the increased activity on the ROM to manage the changeover of the primary crusher system. The additional equipment
has been removed and a reduction in operating costs is expected to be realised from May 2013 onwards. Mill throughput
was higher at 2.83 mtpa and head grade was lower at 0.57% Cu.
CJO: Toronto-based Primero Mining Corp has completed the $C119 million ($A119.7 million) acquisition of Cerro
Resources and the associated spin-off of some of its assets.
Latin America Downunder Conference (Sydney): Latin America’s attraction as a mining destination is undeniable, with
recent data showing the region dominated global base and precious metals transactions in 2012. One of the
presentations indicated that Latin America commanded a solid $US125/oz of gold in its 2012 transactions, compared to
$71/oz paid for Australian gold and base metals deals and $18/oz in Africa.
Observations
2. 3 June 2013 WWW.LCC.ASIA
IMPORTANT DISCLAIMER
This report has been prepared by Lincoln Crowne & Company Pty. Limited ("LCC"). The research is based on information obtained from sources believed to be
accurate and reliable. LCC does not guarantee the accuracy, reliability, completeness or suitability of any such information and makes no warranty, guarantee or
representation, expressly or impliedly about this research. LCC accepts no obligation to correct or update the information. No opinion or recommendation is made
within this research. This report is not intended to be, nor should it be relied on, as a substitute for professional advice. This report should not be relied upon as the
sole basis for any investment decision or planning, and LCC does not accept any responsibility on this basis for actions made.
WEEKLY
Australian Copper Watch List
Ticker Company Name
Open
Price
Close
Price
High
Price
Low
Price
Market
Cap
(A$m)
52 Week
Range
Debt
(A$m)
EV
(A$m)
C1 Costs
($/lb)
C3 Costs
($/lb)
Cash
(A$m)
Ore
Reserve
(mtCu)
ABY Aditya Birla Minerals 0.39 0.39 0.40 0.38 ▲ 0.2% 121 0 20 2.32 N/A 100 0.473
AOH Altona Mining 0.18 0.19 0.19 0.15 ▲ 9.2% 98 22 97 1.30 2.31 23 0.061
DML Discovery Metals 0.21 0.19 0.24 0.18 ▼ -12.0% 93 179 254 N/A N/A 17 0.403
HGO Hillgrove Resources 0.07 0.07 0.07 0.06 ▼ -2.9% 66 49 99 3.15 4.42 17 0.125
IVA Ivanhoe Australia 0.10 0.10 0.13 0.10 ▲ 3.3% 73 0 35 2.85 4.27 38 0.088
OZL OZ Minerals 4.10 4.05 4.11 3.83 ▲ 1.4% 1227 0 568 1.85 3.23 659 0.748
PNA PanAust 2.29 2.39 2.44 2.22 ▲ 5.4% 1450 159 1504 1.28 1.98 104 1.127
SFR Sandfire Resources 6.20 6.38 6.65 6.02 ▲ 3.1% 993 378 1261 N/A N/A 110 0.466
SRQ Straits Resources 0.02 0.01 0.02 0.01 ▼ -29.5% 15 108 67 2.37 2.38 57 0.178
TGS Tiger Resources 0.24 0.23 0.24 0.22 ▲ 4.8% 155 6 142 1.07 N/A 19 0.445
Australian Gold Watch List
Ticker Company Name
Open
Price
Close
Price
High
Price
Low
Price
Market
Cap
(A$m)
52 Week
Range
Debt
(A$m)
EV
(A$m)
C1 Costs
($/oz)
C3 Costs
($/oz)
Cash
(A$m)
Ore
Reserve
(moz)**
ANG* AngloGold Ashanti 17.10 18.88 17.57 16.84 ▼ -0.5% 7251 3368 9978 894 1147 653 75.6
ASR* Alacer Gold Corp 2.07 2.26 2.34 2.05 ▼ -1.1% 648 63 544 932 N/A 245 5.0
BEZ* Besra Gold 0.08 0.07 0.09 0.06 ▲ 26.1% 27 43 70 956 1357 4 0.1
CCU Cobar Consolidated Resources 0.13 0.13 0.14 0.13 ▲ 4.3% 31 18 39 N/A N/A 10 0.4
EVN Evolution Mining 0.79 0.81 0.84 0.75 ▼ -2.5% 570 84 605 918 1427 49 3.4
EDV* Endeavour Mining Corp 0.87 0.93 0.91 0.87 ▲ 1.1% 383 195 575 1092 N/A 82 2.6
FML Focus Minerals 0.02 0.01 0.02 0.01 ▼ -6.7% 110 11 -88 1893 N/A 208 0.5
GDO Gold One International 0.19 0.18 0.20 0.17 -- 0.0% 256 218 442 1047 1246 37 2.7
KCN Kingsgate Consolidated 1.52 1.63 1.58 1.40 ▲ 5.5% 248 173 380 1051 N/A 42 2.7
KRM Kingsrose Mining 0.42 0.32 0.45 0.37 ▼ -3.2% 94 6 94 1029 N/A 9 0.0
LSA Lachlan Star 0.18 0.20 0.19 0.13 ▼ -31.6% 20 26 43 1239 N/A 3 0.1
MML Medusa Mining 2.35 2.53 2.40 2.22 ▲ 1.0% 478 0 469 296 N/A 9 0.6
MOY Millennium Minerals 0.02 0.02 0.02 0.02 -- 0.0% 74 54 126 826 1139 3 0.7
NCM Newcrest Mining 15.00 14.51 15.18 14.28 ▲ 1.7% 11118 3203 14370 799 1086 97 85.7
NGF Norton Gold Fields 0.16 0.17 0.17 0.15 ▲ 1.6% 142 45 131 1013 1282 56 1.1
NST Northern Star Resources 0.67 0.82 0.69 0.64 ▼ -1.5% 348 12 309 646 867 51 0.3
OGC* OceanaGold Corporation 1.79 1.93 1.84 1.72 ▼ -2.1% 565 240 793 687 N/A 26 2.9
PRU Perseus Mining 1.05 1.07 1.10 0.99 ▼ -6.6% 490 0 457 1132 N/A 38 3.6
RED Red 5 0.62 0.62 0.62 0.60 -- 0.0% 84 23 92 1081 1481 15 0.7
RMS Ramelius Resources 0.20 0.17 0.21 0.19 ▼ -2.5% 57 4 18 1076 N/A 43 0.6
RRL Regis Resources 3.83 4.06 3.85 3.59 ▲ 1.7% 2005 0 1997 582 N/A 8 3.0
RSG Resolute Mining 0.73 0.79 0.77 0.69 ▼ -5.4% 521 16 460 831 N/A 16 4.4
SAR Saracen Mineral Holdings 0.15 0.15 0.16 0.14 ▲ 0.1% 86 15 92 991 N/A 7 1.1
SBM St Barbara 0.61 0.68 0.62 0.56 ▲ 0.9% 329 217 480 837 1051 66 5.7
SLR Silver Lake Resources 0.77 0.81 0.79 0.62 ▲ 9.1% 307 11 298 640 N/A 21 1.8
TAM Tanami Gold 0.09 0.08 0.10 0.08 ▼ -11.7% 47 44 87 1944 N/A 1 0.4
TBR Tribune Resources 1.36 1.33 1.36 1.35 -- 0.0% 67 14 100 N/A N/A 9 0.2
TGZ* Teranga Gold Corp 0.73 0.72 0.80 0.70 ▲ 9.3% 176 76 214 535 N/A 49 1.4
TRY Troy Resources 1.78 1.73 1.80 1.68 ▲ 2.7% 158 0 116 804 N/A 41 0.6
UML Unity Mining 0.07 0.07 0.08 0.07 ▲ 3.0% 51 2 17 922 N/A 36 0.4
**: Source: Goldnerds
435
150
181
15 3.6x
12.2x
1.8x
2.2x
2.2x
1202
272
127
126
32
655
N/M
EV/EBITDA
EV/Reserve
($/oz)
5.3x
1.9x
Weekly
Change
132
109
123 7.2x
17 5.1x
18 N/M
34 1.8x
N/M
29 N/M
72
Weekly
Change
EV/EBITDA
EV/Ore
Reserve
(¢/lb)
2 0.4x
36 4.6x
67 5.0x
NM
315
826
186
168
117
4.1x
639
90
177
222
-172
165
143
9.8x
2.6x
2.8x
N/M
2.2x
4.2x
*: These are not primarily listed on ASX, prices, market cap and multiples are based on their primarily listed market quote.
41.2x
1.5x
0.9x
1.2x
N/M
7.6x
N/M
7.9x
1.7x
4.9x
4.6x
45 1.7x
0.5x
5.3x
104
84
84
166
216
3.8x
N/M
AustralianGold-CopperReview