

Recommended
Recommended
More Related Content
What's hot
What's hot (19)
Viewers also liked
Viewers also liked (19)
Similar to Solder joint-fatigue-dfr
Similar to Solder joint-fatigue-dfr (20)
More from Lemon Lee
Recently uploaded
Recently uploaded (20)
Solder joint-fatigue-dfr
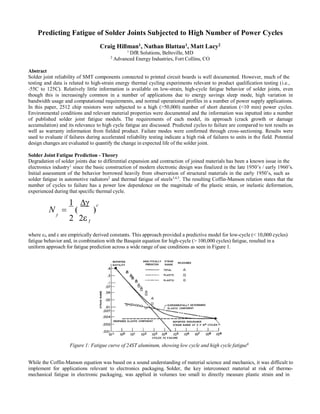
- 1. f Predicting Fatigue of Solder Joints Subjected to High Number of Power Cycles Craig Hillman1, Nathan Blattau1, Matt Lacy2 1 DfR Solutions, Beltsville, MD 2 Advanced Energy Industries, Fort Collins, CO Abstract Solder joint reliability of SMT components connected to printed circuit boards is well documented. However, much of the testing and data is related to high-strain energy thermal cycling experiments relevant to product qualification testing (i.e., -55C to 125C). Relatively little information is available on low-strain, high-cycle fatigue behavior of solder joints, even though this is increasingly common in a number of applications due to energy savings sleep mode, high variation in bandwidth usage and computational requirements, and normal operational profiles in a number of power supply applications. In this paper, 2512 chip resistors were subjected to a high (>50,000) number of short duration (<10 min) power cycles. Environmental conditions and relevant material properties were documented and the information was inputted into a number of published solder joint fatigue models. The requirements of each model, its approach (crack growth or damage accumulation) and its relevance to high cycle fatigue are discussed. Predicted cycles to failure are compared to test results as well as warranty information from fielded product. Failure modes were confirmed through cross-sectioning. Results were used to evaluate if failures during accelerated reliability testing indicate a high risk of failures to units in the field. Potential design changes are evaluated to quantify the change in expected life of the solder joint. Solder Joint Fatigue Prediction - Theory Degradation of solder joints due to differential expansion and contraction of joined materials has been a known issue in the electronics industry1 since the basic construction of modern electronic design was finalized in the late 1950’s / early 1960’s. Initial assessment of the behavior borrowed heavily from observation of structural materials in the early 1950’s, such as solder fatigue in automotive radiators2 and thermal fatigue of steels3,4,5 . The resulting Coffin-Manson relation states that the number of cycles to failure has a power law dependence on the magnitude of the plastic strain, or inelastic deformation, experienced during that specific thermal cycle. 1 c N ( )f 2 2 where f, and c are empirically derived constants. This approach provided a predictive model for low-cycle (< 10,000 cycles) fatigue behavior and, in combination with the Basquin equation for high-cycle (> 100,000 cycles) fatigue, resulted in a uniform approach for fatigue prediction across a wide range of use conditions as seen in Figure 1. Figure 1: Fatigue curve of 24ST aluminum, showing low cycle and high cycle fatigue6 While the Coffin-Manson equation was based on a sound understanding of material science and mechanics, it was difficult to implement for applications relevant to electronics packaging. Solder, the key interconnect material at risk of thermo- mechanical fatigue in electronic packaging, was applied in volumes too small to directly measure plastic strain and in
- 2. geometries too complicated to solve through simple mechanics models (Coffin and Manson’s original papers used flat plate geometries as an example). Norris and Landzberg7 attempted to address these deficiencies by proposing that plastic strain dominated thermo-mechanical fatigue of eutectic SnPb alloy, the primary solder of choice in electronic packaging at that time. In ignoring the influence of elastic strain, Norris-Landzberg were able to draw a direct relationship between change in temperature and plastic strain. To account for the influence of creep-driven plasticity, a mechanism of less concern for high temperature steels, Norris- Landzberg added additional correction factors based on cyclic frequency (which is directly related to dwell times) and maximumtemperature. This approach to predicting solder joint lifetime under thermal cycling was widely embraced by the electronics community, to the extent that the Norris-Landzberg equation is the only technique referenced in the relevant JEDEC qualification documents, JESD478 and JESD949 . The Norris-Landzberg equation, while eminently practical, has several key limitations. The most critical is the inability to make a fatigue prediction without test data. This effectively eliminates the use of Norris-Landzberg from any design activities. The equation is also based on the assumption that creep behavior is driven exclusively by temperature and time, whereas there is a critical applied stress element. Depending upon the packaging architecture, the change in applied stress at different thermal cycles could have a more substantive effect then identified through frequency and temperature, possibly changing rate constants depending on the solder joint configuration and overall packaging architecture10 . Finally, the equation is dependent upon the plastic strain being driven by the same mechanism in both environments. As demonstrated by deformation maps (Figure 2), different atomic-level mechanisms can be triggered to induce plasticity and creep behaviors depending on the specific combination of temperature and applied stress. The limitation of this approach has been made most obvious by the inability to develop a Norris-Landzberg equivalent for Pb-free solders (SAC305)11,12 . Figure 2: A representative schematic of a deformation map showing the various mechanisms that can induce damage during cyclic fatigue Further improvement to the prediction of solder fatigue was provided by Engelmaier13 , who returned back to the principles of Coffin Manson, but used solid mechanics models more relevant to the solder joint geometry and low-cycle fatigue data for SnPb solder14 . To determine the plastic strain, or strain range, Engelmaier assumed that the in-plane (shear) steady-state strains dominated low-cycle fatigue behavior. This allowed for the use of a distance-to-neutral model, where
- 3. with C being a geometry-dependent constant (1/2 for leadless ceramic chip carriers), LD is the diagonal distance from the neutral point (assumes a square/rectangle shape), is the difference in thermal expansion between the die/component and substrate/printed board, and T is the thermal cycle. Engelmaier then derived f and c through curve fitting of the Wild data, with f = 0.325 and c = (-0.442) – (6x10⁻⁴ Ts) + (1.74x10⁻² )[ln (1+f)] where Ts is the average temperature during the thermal cycle and f is the frequency of the thermal cycle. In some respects, the Engelmaier model was even more successful than the Norris-Landzberg. Like Norris-Landzberg, the inputs required to use the Engelmaier model was available to the practicing engineer. It was also widely adopted in the industry, primarily through IPC SM-78515 . The Engelmaier model overcame some of the limitations of the Norris-Landzberg model, including a strong link to the original Coffin-Manson methodology, ability to predict fatigue performance without testing, consideration of the package geometry, and a basis on experimental fatigue results. The Engelmaier approach, while superior to previous attempts to predict low-cycle solder fatigue both in accuracy and practicality, had some limitations. One of the flaws of the Engelmaier approach lies with the Wild data that is the basis of its fatigue exponent. Wild performed isothermal mechanical fatigue experiments at 25C and 100C at between 4 and 300 cycles per hour. These temperature ranges are above room temperature and therefore provide limited insight into fatigue behavior at colder temperatures where creep-based mechanisms are reduced and plasticity-driven mechanisms play a larger role in fatigue behavior. The cyclic frequency is higher than most thermal cycling test conditions, which are typically one (1) to two 21 per hour, and far higher than field conditions, which can require several hours to go through a thermal cycle. This has the effect of minimizing the time-dependency of creep mechanisms and the resulting damage evolution. This tendency to overestimate and underestimate creep effects may have contributed to the accuracy of the predictions. An additional challenge to both Coffin-Manson and the derived Engelmaier model was their assumption that the plastic strain was constant over the entire temperature cycle. Work by Hall16 measured a hysteresis loop, where the stress-strain relationship could vary dramatically as the solder joint was exposed to a range of temperatures (see Figure 3). It is important to note that the nominal shape of hysteresis loops can be more uniform, depending upon the applied stress, temperature, and dwell time. The cycle measured by Hall induced failure in less than 500 cycles, which is typically too low to be accurately predicted through analytical means). Figure 3: Hysteresis loop of a leadless ceramic chip carrier solder joint during thermal cycling between -25°C and 125°C16 (obtainedthroughhttp://www.msed.nist.gov/solder/clech/Sn-Pb_Creep.htm) Additional experiments also demonstrated a more consistent correlation between strain energy and cycles to failure with fewer dependencies on geometry or load orientation17 . These observed behaviors necessitated a move to a strain energy based prediction scheme. Blattau18 introduced a modification of the Engelmaier model that replaced strain range with strain energy. To compute strain energy, Blattau used a foundation stiffness model to calculate the force being applied to the solder joint based on displacement equations, where
- 4. where LD is the diagonal length (distance to neutral point), E is the elastic modulus, A is the area, h is the thickness, G is the shear modulus, a is the edge length of the bond pad, 1 refers to the component, 2 refers to the board, s refers to the solder joint, c refers to the bond pad, and b refers to the board. The shear stress can then be computed by dividing the force by the effective solder joint area. Once the strain range and the shear stress are computed, the strain energy is calculated assuming a hysteresis loop that is roughly equilateral in shape (Figure 4) Figure 4: Representative schematic of a solder joint hysteresis loop19 The relationship between cycles to failure and strain energy is then determined based on work performed by Syed20 , who demonstrated a power law correlation between strain energy and cycles to failure with an exponent of -1. The foundation of this behavior is based on first principles of secondary creep behavior. The Blattau approach, which combines the first-order equations derived from the original Coffin-Manson equation with the observed dependence on strain energy, has been validated for both chip components and ball grid array packaging technology (see Figure 5). Figure 5 Solder Joint Prediction – Validation (Power Cycling) Almost all solder prediction models go through a validation process where predictions are compared to experimental results. These validation processes can be a direct comparison of measured time to failure to theoretical predictions or the experimental results can be correlated to normalized parameters relevant to the model algorithm. Most validation activities attempt to provide a correlation over three orders of magnitude, typically between 100 to 10,000 cycles.
- 5. Isothermal testing tends to be the dominant vehicle for validation studies. A study by the University of Maryland determined that over 82% of the test conditions reported in the IEEE literature were isothermal thermal cycles21 . This is true even though one of the initial concerns regarding solder joint fatigue was the performance of devices subjected to power cycling. The majority of publications on solder fatigue under power cycling focus on the die attach structure common within high power insulated gate bipolar transistors (IGBT)22,23 . This specific structure does not necessarily lend itself to common surface mount (SMT) solder joints due to the highly constrained layer architecture and the inability to directly monitor or define die attach failure. The limited studies on power cycling of standard surface mount devices have primarily focused on correlation to isothermal cycling or shock. An earlier paper by Popps et. al.24 showed a 50% increase in lifetime with power cycling, even though the power cycle had a longer dwell time (15 minutes vs. 5 minutes) and a faster ramp rate (60C/min vs. 20C/min). A similar increase in number of cycles to failure was predicted and observed by Li et. al.25 ; they assigned this difference in behavior to the large thermal gradient across the ball grid array package, which effectively increased the CTE of the BGA under the die shadow while limiting the degree of expansion over the diagonal length. The limiting factor of these papers and other investigations on power cycling of SMT packages is that the time is typically less than 10,000 cycles. While this cycle count could be considered as the outer bound of low cycle fatigue (others believe plastic strain is dominant out to 100,000 cycles), it fails to consider that an increasing number of applications are expected to have tens of thousands of power cycles in the actual field application. Enterprise applications are increasingly powering down, either to sleep mode or turned off, to save energy. To conserve battery charge, consumer mobile devices (smart phones, tablets, and laptops) can experience between 10 to 50 power cycles per day for three (3) to five (5) years, which can result in a total of 15,000 to 90,000 power cycles over its lifetime. A similar environmental profile is starting to ramp up in automotive applications, where start-stop technology can introduce a power down 12 times for every four (4) miles driven. With the average urban driving of 25 miles per day, this works out to 250,000 cycles over ten (10) years. The purpose of this paper is to provide a better understanding of the relevance of standard strain energy based models for low cycle fatigue of solder joints in predicting the behavior of standard SMT packages subjected to a very high number of power cycles. ExperimentalProcedure A RF power supply was subjected to an accelerated life test (ALT). The test conditions for these units are shown below • Coolant Temperature: • Inlet Air Temperature: 50°C / Inlet Water Temperature: 45°C • Output Power Cycling: • RF ON: 4 min / RF OFF: 1min • Output Load: • Two Months at 50 Ohms • Four Months at 31.3 +j34.3 (complex load) Three units failed during ALT. Circuit troubleshooting identified the failure sites as 2512 resistors in the gate drive circuit. The last failure initiated after 53,215 Output ON events. Visual examination of the 2515 SMT resistors in the RF Gate Drive circuit revealed problems with solder joint cracking (see Figure 6). Figure 6: Optical image of failed solder joints at R4 and R5
- 6. To obtain a better understanding of the extent of solder joint cracking, all eight resistors in the RF Gate Drive circuit were cross-sectioned and the cross-sectional views are shown in order from R2 thru R9 in Figure 7. Based on the crack propagation path and the phase coarsening observed around the crack path, it was concluded that the solder joint cracking was due to low cycle fatigue. A diagram from a typical solder fatigue26 is shown in Figure 8 with the cross-section of the failed R5 solder joint. Based on the schematic, the R5 solder joint crack followed a “typical” path starting from the inner end (heel) and propagating until failure occurred. Figure 7: Cross section views of R2 (top) to R9 (bottom). “Heatsink” end is on the Left.
- 7. R2 R3 R4 R5 R6 R7 R8 R9 Inlet Air Exhaus t Air Temperature(C) Figure 8: Typical failure diagram from Lui et. al. and a cross-section of failed R5 solder joint To better understand the drivers for solder fatigue under the 2512 resistors, T-type thermocouples were placed on the gate drive resistors (see Figure 9). The temperatures were recorded using a 343970 data logger and a graph of the resistor temperature data for multiple power cycles is shown in Figure 10 and a table of peak temperatures is displayed in Table 1. Figure 9: Thermocouple placement on Gate Drive Resistors ALT Resistor R2-R9 Temperatures during 4min ON, min OFF Power cycles 80 75 70 65 60 55 50 45 0:00:00 0:07:12 0:14:24 0:21:36 0:28:48 0:36:00 0:43:12 0:50:24 0:57:36 Time (minutes) Figure 10: Thermocouple data for Gate Drive Resistors Table 1: Table of Temperatures for Gate Drive Resistors (*temperatures seem low; possible measurement issue) Resist or 6kW Output Power 0.5kW Output Power Max Temp (° C Min Temp (°C) ΔT (°C ) Max Temp (° C Min Temp (°C) ΔT (°C )R2* 6 8. 5 5. 12. 6 5 6. 4 7. 8.8 R 3 7 3. 5 5. 18. 3 6 3. 4 8. 15. 5R 4 7 5. 5 6. 19. 9 6 4. 4 8. 16. 2R 5 7 8. 5 6. 22. 1 6 9. 4 8. 20. 3R 6 7 7. 5 6. 20. 6 6 8. 4 9. 19. 3R7* 7 3. 5 6. 16. 6 6 3. 4 9. 14. 6R 8 7 9. 5 6. 22. 7 7 1. 4 9. 22. 1
- 8. R 9 7 8. 5 6. 21. 6 7 0. 4 9. 20. 7 Correlation of Failure Behavior to Strain Energy Models The results from thermal measurements and design and material parameters were inputted into the Blattau model and compared to ALT results. The inputs used for the calculation are shown in Figure 11. The solder joint height (h) of 0.036mm was determined using a cross-section of a resistor on an unfailed board. Figure 11: Inputs for the Blattau model It can be seen that the cycles to failure prediction provided by the Blattau model (50,614 cycles) is within 5% of the observed time to failure (53,215 cycles). These results would seem to suggest that plastic strain energy is still a critical driver for solder fatigue under these conditions, even given the short dwell times (4 minutes) and high number of cycles (>50,000). Additional modeling was performed using a crack propagation proposed by Han and Song27 specifically for chip resistors, where with N = crack propagation life, a = length of crack, K3 = 0.0044 (model constant for SnPb), K4 = 1.3227 (model constant for SnPb), and ΔWave = averaged strain energy density change per thermal cycle. This equation ignores crack initiation (region 1) and assumes that the life is dominated by crack propagation (region 2). Thermal data and FEA simulation was used to determine the range of ΔWave based on the Han and Song model (see Figure 12). ΔWave was determined to be 0.020MPa for a similar operating profile (5.67 min ON, 1.33 min OFF) to the ALT application. The ALT failures occurred at 50C ambient and an output profile of 4min ON and 1 min OFF, which works out to the equivalent of 0.030MPa. Using this value of strain energy density and a critical crack length of 1mm, based on the pad length, gives the following:
- 9. Figure 12: FEA model and estimate of ΔWave Assessment of Potential Design Changes Changes to the circuit design, PCBA layout, materials or operating conditions could be used to improve the robustness of the 2512 resistor solder joints under ALT. The Blattau model, due to its higher accuracy, was used to evaluate how particular design changes would influence the expected lifetime. Table 2 below lists the proposed change and the estimated impact to the expected life compared to the baseline. Table 2: Proposed change and estimated impact to expected life compared to baseline.
- 10. Description Comment CTF Estima te Solde r Pack age Pad L x W (mm Ambi en t RF ON/OFF Time Out put PoBaseline ALT conditions 50,6 14 63Sn37 Pb 251 2 1.28 x 3.2 5 0 4min ON, 1min OFF 6k WChange to Pb- free solder Pb-free solder performs better with low strain 279,5 20 SAC30 5 251 2 1.28 x 3.2 5 0 4min ON, 1min OFF 6k W Change Resistor Package to 2010 from 2512 smaller solder joint 71,4 30 63Sn37 Pb 201 0 1.28 x 2.5 5 0 4min ON, 1min OFF 6k W Lower Ambient Temperature from 50°C to more like customer operating temperature 68,7 27 63Sn37 Pb 251 2 1.28 x 3.2 2 5 4min ON, 1min OFF 6k W Increase Pad Width from 3.2 slightly more cycles for crack to 53,6 22 63Sn37 Pb 251 2 1.28 x 3.5 5 0 4min ON, 1min OFF 6k W RF Output Power reduced from 6kW to 0.5kW shows ΔT dependence 66,2 60 63Sn37 Pb 251 2 1.28 x 3.2 5 0 4min ON, 1min OFF 0.5k W Conclusions A strain energy based first order model is capable of relatively accurate prediction out to 50,000 power cycles with dwell times less than 5 minutes. This would suggest that plastic strain and creep continue to play a critical role in solder joint fatigue even under conditions that would tend to be extended beyond typical low-cycle fatigue. References 12 WB Green, "A fatigue-free silicon device structure," American Institute of Electrical Engineers, Part I: Communication and Electronics, Transactions of the , vol.80, no.2, pp.186-192, May 1961 13 HE Pattee and RM Evans, “The Performance of Some Soft Solders at Elevated Temperatures and Pressures,” Special Technical Publication 189, ASTM, Philadelphia, PA, 1956, p. 103 14 LF Coffin, “The Problem of Thermal Stress Fatigue in Austenitic Steels,” Special Technical Publication 165, ASTM, 1954, p. 31 15 LF Coffin, “A study of the Effects of Cyclic Thermal Stresses on a Ductile Metal,” Trans. ASME, 76, 931–950 (August 1954). 16 SS Manson, “Behavior of materials under conditions of thermal stress,” Proceedings of the Heat Transfer Symposium, University of Michigan Engineering Research Institute, Ann Arbor, Mich, pp. 9-75, 1953. 17 SS Manson, “Discussion”, J. of Basic Engineering / Trans. ASME, p. 537-541, December 1962 18 Norris, K C, and A H Landzberg. “Reliability of Controlled Collapse Interconnections.” IBM Journal of Research and Development 13, no. 3 (1969): 266-271 19 JESD47I, Stress-Test-Driven Qualification of Integrated Circuits, JEDEC, July 2012 20 JESD94A, Application Specific Qualification Using Knowledge Based Test Methodology, JEDEC, July 2008 (reaffirmed September 2011) 21 Syed, A., "Limitations of Norris-Landzberg equation and application of damage accumulation based methodology for estimating acceleration factors for Pb free solders," Thermal, Mechanical & Multi-Physics Simulation, and Experiments in Microelectronics and Microsystems (EuroSimE), 2010 11th International Conference on , vol., no., pp.1,11, 26-28 April 2010 11 Hillman, C., “Assessment of Pb-Free Norris Landzberg Model to JG-PP Test Data” DfR Solutions Presentation, February 21, 2006 1 Miremadi, J., Henshall, G., Allen, A., Benedetto, E., Roesch, M., “Lead-Free Solder-Joint-Reliability Model Enhancement”, IMAPS 2009 2 W. Engelmaier, Fatigue Life of Leadless Chip Carrier Solder Joints During Power Cycling, IEEE Trans. Comp. Hybrids Manuf. Tech., vol CHMT-6, no. 3, September 1983, p. 232-237 3 R. N. Wild, “Properties of some low melt fusible solder alloys,” IBM Tech. Rep. No. 712000408, Oct. 1971 4 IPC SM-785 standard, Guidelines for Accelerated Reliability Testing of Surface Mount Solder Attachments. 5 Hall, P. M., "Strain measurements during thermal chamber cycling on leadless ceramic chip carriers soldered to printed boards", Proceedings, 34th Electronic Components Conference, New Orleans, LA, May 14-16, 1984, pp. 107-116 6 TS Park and SB Lee, Isothermal Low Cycle Fatigue Tests of Sn/3.5Ag/0.75Cu and 63Sn-37Pb Solder Joints under Mixed Mode Loading Cases, 52nd Electronic Components and Materials Conference Proceedings, 2002, p. 23p4-s23p9
- 11. 7 Blattau, N. and Hillman, C. “An Engelmaier Model for Leadless Ceramic Chip Devices with Pb-free Solder,” IPC/JEDEC Lead Free Conference, Santa Clara, CA, March 2006 19 Lead Free Solder: Mechanics and Reliability, by John Hock Lye Pang, Theory on Mechanics of Solder Materials chapter 2 20 Syed, A., “Accumulated Creep Strain and Energy Density Based Thermal Fatigue Life Prediction Models for SnAgCu Solder Joints,” ECTC 2004, pp. 737-746 - corrected (2) M. Osterman, Effect of Temperature Cycling Parameters (Dwell and Mean Temperature) on Durability of Pb-free Solders, IMAPS Winter Technical Symposium, Chesapeake Chapter, January 2010 (3) O'Keefe, M.; Vlahinos, A., "Impacts of cooling technology on solder fatigue for power modules in electric traction drive vehicles," Vehicle Power and Propulsion Conference, 2009. VPPC '09. IEEE , vol., no., pp.1182,1188, 7-10 Sept. 2009 (4) Herrmann, T.; Feller, M.; Lutz, J.; Bayerer, R.; Licht, T., "Power cycling induced failure mechanisms in solder layers," Power Electronics and Applications, 2007 European Conference on , vol., no., pp.1,7, 2-5 Sept. 2007 (5) D. E. Hodges Popp et al., “Flip chip PBGA solder joint reliability: Power cycling versus thermal cycling”, Flip Chip Technology Workshop and Exhibition, IMAPS, January 2003 (6) Jue Li; Karppinen, J.; Laurila, T.; Kivilahti, J.K., "Reliability of Lead-Free Solder Interconnections in Thermal and Power Cycling Tests," Components and Packaging Technologies, IEEE Transactions on , vol.32, no.2, pp.302,308, June 2009 (7) D.R. Liu and Yi-Hsin Pao, Fatigue-creep crack propagation path in solder joints under thermal cycling, Journal of Electronic Materials, V 26, N 9, 1997 (8) Changwoon Han and Byeongsuk Song, “Development of Life Prediction Model for Lead-free Solder at Chip Resistor,” 2006 Electronics Packaging Technology Conference.