
Recommended
Recommended
More Related Content
Similar to Part A VSM SampleNameChinue UeckerTitle Employment Lead ProcessDa.docx
Similar to Part A VSM SampleNameChinue UeckerTitle Employment Lead ProcessDa.docx (20)
More from LacieKlineeb
More from LacieKlineeb (20)
Recently uploaded
Recently uploaded (20)
Part A VSM SampleNameChinue UeckerTitle Employment Lead ProcessDa.docx
- 1. Part A VSM SampleNameChinue UeckerTitle: Employment Lead ProcessDate10/27/22Demand or Takt time:20 leads/monthCustomerTotal LT (mins) = 175Standard Work Instructions: Total PT (mins) = 491. Insert your name, title of the value stream, and demand or Takt time.Activity Ratio = Total PT/Total LT28%2. Insert the activity, role, number of staff, LT, PT, and %C&A in the process blocks. The summary timeline should auto populate. Rolled %C&A = 34%3. Verify the current state summary metrics are calculated correctly.Database* Total LT and PT are calculated by summing the LT and PT values for all processes.4. Add the current state overview, challenges, and bottleneck. Include any other relevant metrics (i.e., NPS, AHT, etc.).** Total %C&A is the Rolled %C&A, which is calculated by multiplying the %C&A for all processes.5. Review the assignment instructions once more. Check your work. Upload and submit when ready.Provide Sign- in SheetObtain Employment InterestReview Potential LeadsComplete Job Application and SubmitProvide Sign-out SheetReceptionist (2)Counselor (10)Counselor (10)Counselor (10)Receptionist (2)LT5minsLT60minsLT45minsLT60minsLT5unitsPT2minsPT1 0minsPT5minsPT30minsPT2units%C&A100%%C&A70%%C&A 70%%C&A70%%C&A100%LT:5LT:60LT:45LT:60LT:5PT:2PT: 10PT:5PT:30PT:2Overview of the ProcessThe Employment Lead Process begins with the individual entering the facility. During the pandemic, the sessions can be virtual using Zoom or Google Meet. The types of positions available depends on the interest of the individual and their employment experience. 4 career fairs are offered annually to ensure that individuals have a chance to meet prospective employers. The TAT for application review is 3-4 weeks on average for the local employers.ChallengesIdentifying interests might be cumbersome for individuals who might not be tech savvyDifficult finding jobs that match the individuals skills,
- 2. background, and ability.Unclear employer requirementsBottlenecksDelays in application submissionOutdated job leadsLack of resources available to support individuals with career enhancement (i.e., resume writing, etc.)ReferencesMartin, K. & Osterling, M. (2014). Value Stream Mapping. Part A VSM 5 blockNameTitle: Date10/27/22Demand or Takt time:CustomerTotal LT (units) = 0Standard Work Instructions: Total PT (units) = 01. Insert your name, title of the value stream, and demand or Takt time.Activity Ratio = Total PT/Total LTERROR:#DIV/0!2. Insert the activity, role, number of staff, LT, PT, and %C&A in the process blocks. The summary timeline should auto populate. Rolled %C&A = 0%3. Verify the current state summary metrics are calculated correctly.Insert Tech Source (with arrows or delete)* Total LT and PT are calculated by summing the LT and PT values for all processes.4. Add the current state overview, challenges, and bottleneck. Include any other relevant metrics (i.e., NPS, AHT, etc.).** Total %C&A is the Rolled %C&A, which is calculated by multiplying the %C&A for all processes.5. Review the assignment instructions once more. Check your work. Upload and submit when ready.Insert activityInsert activityInsert activityInsert activityInsert activityInsert role (insert # of Staff)Insert role (insert # of Staff)Insert role (insert # of Staff)Insert role (insert # of Staff)Insert role (insert # of Staff)LTunitsLTunitsLTunitsLTunitsLTunitsPTunitsPTunitsPTu nitsPTunitsPTunits%C&A%C&A%C&A%C&A%C&ALT:0LT:0 LT:0LT:0LT:0PT:0PT:0PT:0PT:0PT:0Overview of the ProcessDescribe the process hereChallengesList and briefly describe the challenges hereList and briefly describe the challenges hereList and briefly describe the challenges hereBottlenecksList and briefly describe the bottlenecks hereList and briefly describe the bottlenecks hereList and briefly describe the bottlenecks hereReferencesMartin, K. & Osterling, M. (2014). Value Stream Mapping. Part A VSM 6 blockNameTitle: Date10/27/22Demand or Takt
- 3. time:CustomerTotal LT (units) = 0Standard Work Instructions: Total PT (units) = 01. Insert your name, title of the value stream, and demand or Takt time.Activity Ratio = Total PT/Total LTERROR:#DIV/0!2. Insert the activity, role, number of staff, LT, PT, and %C&A in the process blocks. The summary timeline should autopopulate. Rolled %C&A = 0%3. Verify the current state summary metrics are calculated correctly.Insert Tech Source (with arrows or delete)* Total LT and PT are calculated by summing the LT and PT values for all processes.4. Add the current state overview, challenges, and bottleneck. Include any other relevant metrics (i.e., NPS, AHT, etc.).** Total %C&A is the Rolled %C&A, which is calculated by multiplying the %C&A for all processes.5. Review the assignment instructions once more. Check your work. Upload and submit when ready.Insert activityInsert activityInsert activityInsert activityInsert activityInsert activityInsert role (insert # of Staff)Insert role (insert # of Staff)Insert role (insert # of Staff)Insert role (insert # of Staff)Insert role (insert # of Staff)Insert role (insert # of Staff)LTunitsLTunitsLTunitsLTunitsLTunitsLTunitsPTunitsPTu nitsPTunitsPTunitsPTunitsPTunits%C&A%C&A%C&A%C&A% C&A%C&ALT:0LT:0LT:0LT:0LT:0LT:0PT:0PT:0PT:0PT:0PT: 0PT:0Overview of the ProcessDescribe the process hereChallengesList and briefly describe the challenges hereList and briefly describe the challenges hereList and briefly describe the challenges hereBottlenecksList and briefly describe the bottlenecks hereList and briefly describe the bottlenecks hereList and briefly describe the bottlenecks hereReferencesMartin, K. & Osterling, M. (2014). Value Stream Mapping. Part A VSM 7 blockNameVanessa WoodardTitle: Skyworth Design Value StreamDate10/27/22Demand or Takt time:A customer needs 6 books which will take 1230 hours to produce and deliverCustomerTotal LT (minutes) = 205Standard Work Instructions: Total PT (minutes)= 12301. Insert your name, title of the value stream, and demand or Takt time.Activity Ratio =
- 4. Total PT/Total LT600%2. Insert the activity, role, number of staff, LT, PT, and %C&A in the process blocks. The summary timeline should autopopulate. Rolled %C&A = 52%3. Verify the current state summary metrics are calculated correctly.Production Control* Total LT and PT are calculated by summing the LT and PT values for all processes.4. Add the current state overview, challenges, and bottleneck. Include any other relevant metrics (i.e., NPS, AHT, etc.).** Total %C&A is the Rolled %C&A, which is calculated by multiplying the %C&A for all processes.5. Review the assignment instructions once more. Check your work. Upload and submit when ready.Review & UpdateFirst Draft editingQC Supplier MaterialFinal ApprovalPrint ProofsProof ApprovalReceiving and ShippingReviewing and updating books needs two persons and each books requires 30 minutesFirst draft editing requires two persons each taking one hour for the draftQuanity supplied material requires one person who will consume one hour per bookFinal Approval is done by one person and will take thirty minutes per bookThe prints will have to be proof read by one person who will take ten minutes per bookthe books have to be apprived for printing purposes. It will take one person who will take five minutes per book.the books will be shipped to the client LT30minsLT60minsLT60minsLT30minsLT10minsLT5minsLT1 0minsPT180minsPT360minsPT360minsPT180minsPT60minsPT 30minsPT60mins%C&A90%%C&A90%%C&A96%%C&A70% %C&A100%%C&A95%%C&A100%LT:30LT:60LT:60LT:30LT: 10LT:5LT:10PT:180PT:360PT:360PT:180PT:60PT:30PT:60Ove rview of the ProcessJK makes an order for two hundred units of books from Skyworth Design House. These Units are sibdivided into book 1, book 2, book 3, book 4, book 5 and book 6. Skyworth design house has 25 units in store and will therefore seek the processes of SDF supplier who is the prinitng house well as the graphic designer. Skyworth will review and update each of the books which will take approximately three hours to do so. these reviews have to be drafted and will consume six
- 5. hours to do so. This will be followed by a supplier material requisition that will take six hours. Generally the whole process will take 1230 minutes which is approximately twenty one working hours. The client will get their order in the fourth dayChallengesthere may be issues in reviewing and getting the feedback to the print housethere are delays in the print house which may cause delays in the operations.a minor error in one book may cause the design house to recheck all other components. Bottlenecksthe client needs the units as fast as possibleReferencesMartin, K. & Osterling, M. (2014). Value Stream Mapping. Part B KaizenNameInstructorAssignment2Date10/27/22The potential Kaizen events are based on the value stream map created in Assignment 1. The potential Kaizen events include:Insert the potential Kaizen event hereInsert the potential Kaizen event hereInsert the potential Kaizen event hereList the chosen Kaizen event, justification, objective, and scope below.Insert text hereThe detailed agenda for the Kaizen event is listed below.List the pre-Kaizen event activities below.Insert text hereDay 1Day 2TimeSession Topic/ObjectiveLean ToolsOutput/DeliverablesRationaleTimeSession Topic/ObjectiveLean ToolsOutput/DeliverablesRationaleDay 3TimeSession Topic/ObjectiveLean ToolsOutput/DeliverablesRationaleDay 4TimeSession Topic/ObjectiveLean ToolsOutput/DeliverablesRationaleDay 5TimeSession Topic/ObjectiveLean ToolsOutput/DeliverablesRationaleProvide the explanation for the number of days, sequence for session topics, and justify the Lean tools to be used and outputs from each session below.Number of days and explanationInsert text hereSequence for Session Topics and ExplanationInsert text hereLean tools and explanationInsert text hereSession Outputs and explanationInsert text hereExplain why this detailed Kaizen agenda supports the Kaizen objective and scope below.Insert text hereReferencesMartin, K. & Osterling, M. (2014). Value Stream Mapping.
- 6. Part C Six Sigma CharterNameInstructorAssignment 3Date10/27/22Based on the value stream map from Assignment 1, the potential Six Sigma Projects include•Increase Rolled % Complete & Accurate: the Rolled % Complete and Accurate was (insert value), which indicates (review page 91 in the Value Stream Mapping book to explain what this means). •Increase Activity Ratio: the Activity Ratio was (insert value), which indicates (review page 90 in the Value Stream Mapping book to explain what this means).•Reduce Total Lead Time: the Total Lead Time was (insert value), which indicates (review page 88 in the Value Stream Mapping book to explain what this means). •Reduce Total Process Time: the Total Process Time was (insert value), which indicates (review page 90 in the Value Stream Mapping book to explain what this means).List the chosen Six Sigma project, justification, objective, and scope below.Insert text hereThe detailed Six Sigma Charter is listed below.Project NameList the project name herePROBLEM STATEMENT: (must be a specific, measurable and chronic problem or performance gap/deficiency; No blame, no causes, no Solution s in this statement):Insert text hereGOAL STATEMENT: (what level of performance is to be achieved, by when, for this project. Must be SMART: specific, measurable, attainable, relevant and time bound):Insert text herePROJECT SCOPE: (must be a manageable and doable “bite size” project, within 6 months or less):In ScopeOut of ScopeInsert text hereInsert text hereInsert text hereInsert text hereInsert text hereInsert text hereInsert text hereInsert text hereInsert text hereInsert text
- 7. hereCTQs of PROCESSES WITHIN PROJECT SCOPE: KEY METRIC: (this is the performance outcome Y to be improved by the project, stated in measurable terms, such as: delivery time in hours, % yield)CTQMeasurementKey MetricInsert text hereInsert text hereInsert text hereInsert text hereInsert text hereInsert text hereInsert text hereInsert text hereInsert text hereInsert text hereInsert text hereInsert text hereInsert text hereInsert text hereInsert text hereEXPECTED BENEFITS: (operational and financial benefits to be expected when project goal is achieved):OperationalFinancialInsert text hereInsert text hereInsert text hereInsert text hereInsert text hereInsert text hereInsert text hereInsert text hereInsert text hereInsert text hereMILESTONES FOR DMAIC OR DMADV PHASES: insert timeframesDMAICDefineMeasureAnalyzeImproveControlInsert text hereInsert text hereInsert text hereInsert text hereInsert text hereDMADVDefineMeasureAnalyzeDesignVerifyInsert text hereInsert text hereInsert text hereInsert text hereInsert text herePROJECT CHAMPION(insert the project champion name here)PROJECT LEADER(insert the project leader here)PROJECT TEAM MEMBERS(insert the project team members here)AD-HOC MEMBERS(insert the adhoc project members’ name here)APPROVED BY & DATE(insert the name and date)ReferencesMartin, K. & Osterling, M. (2014). Value Stream Mapping.
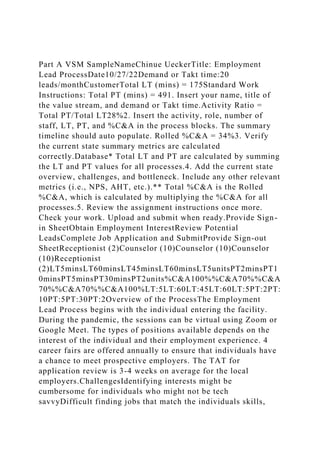
- 8. image1.tiff Part A VSM SampleNameChinue UeckerTitle: Employment Lead ProcessDate10/27/22Demand or Takt time:20 leads/monthCustomerTotal LT (mins) = 175Standard Work Instructions: Total PT (mins) = 491. Insert your name, title of the value stream, and demand or Takt time.Activity Ratio = Total PT/Total LT28%2. Insert the activity, role, number of staff, LT, PT, and %C&A in the process blocks. The summary timeline should auto populate. Rolled %C&A = 34%3. Verify the current state summary metrics are calculated correctly.Database* Total LT and PT are calculated by summing the LT and PT values for all processes.4. Add the current state overview, challenges, and bottleneck. Include any other relevant metrics (i.e., NPS, AHT, etc.).** Total %C&A is the Rolled %C&A, which is calculated by multiplying the %C&A for all processes.5. Review the assignment instructions once more. Check your work. Upload and submit when ready.Provide Sign- in SheetObtain Employment InterestReview Potential LeadsComplete Job Application and SubmitProvide Sign-out SheetReceptionist (2)Counselor (10)Counselor (10)Counselor (10)Receptionist (2)LT5minsLT60minsLT45minsLT60minsLT5unitsPT2minsPT1 0minsPT5minsPT30minsPT2units%C&A100%%C&A70%%C&A 70%%C&A70%%C&A100%LT:5LT:60LT:45LT:60LT:5PT:2PT:
- 9. 10PT:5PT:30PT:2Overview of the ProcessThe Employment Lead Process begins with the individual entering the facility. During the pandemic, the sessions can be virtual using Zoom or Google Meet. The types of positions available depends on the interest of the individual and their employment experience. 4 career fairs are offered annually to ensure that individuals have a chance to meet prospective employers. The TAT for application review is 3-4 weeks on average for the local employers.ChallengesIdentifying interests might be cumbersome for individuals who might not be tech savvyDifficult finding jobs that match the individuals skills, background, and ability.Unclear employer requirementsBottlenecksDelays in application submissionOutdated job leadsLack of resources available to support individuals with career enhancement (i.e., resume writing, etc.)ReferencesMartin, K. & Osterling, M. (2014). Value Stream Mapping. Part A VSM 5 blockNameTitle: Date10/27/22Demand or Takt time:CustomerTotal LT (units) = 0Standard Work Instructions: Total PT (units) = 01. Insert your name, title of the value stream, and demand or Takt time.Activity Ratio = Total PT/Total LTERROR:#DIV/0!2. Insert the activity, role, number of staff, LT, PT, and %C&A in the process blocks. The summary timeline should auto populate. Rolled %C&A = 0%3. Verify the current state summary metrics are calculated
- 10. correctly.Insert Tech Source (with arrows or delete)* Total LT and PT are calculated by summing the LT and PT values for all processes.4. Add the current state overview, challenges, and bottleneck. Include any other relevant metrics (i.e., NPS, AHT, etc.).** Total %C&A is the Rolled %C&A, which is calculated by multiplying the %C&A for all processes.5. Review the assignment instructions once more. Check your work. Upload and submit when ready.Insert activityInsert activityInsert activityInsert activityInsert activityInsert role (insert # of Staff)Insert role (insert # of Staff)Insert role (insert # of Staff)Insert role (insert # of Staff)Insert role (insert # of Staff)LTunitsLTunitsLTunitsLTunitsLTunitsPTunitsPTunitsPTu nitsPTunitsPTunits%C&A%C&A%C&A%C&A%C&ALT:0LT:0 LT:0LT:0LT:0PT:0PT:0PT:0PT:0PT:0Overview of the ProcessDescribe the process hereChallengesList and briefly describe the challenges hereList and briefly describe the challenges hereList and briefly describe the challenges hereBottlenecksList and briefly describe the bottlenecks hereList and briefly describe the bottlenecks hereList and briefly describe the bottlenecks hereReferencesMartin, K. & Osterling, M. (2014). Value Stream Mapping. Part A VSM 6 blockNameTitle: Date10/27/22Demand or Takt time:CustomerTotal LT (units) = 0Standard Work Instructions: Total PT (units) = 01. Insert your name, title of the value stream, and demand or Takt time.Activity Ratio = Total
- 11. PT/Total LTERROR:#DIV/0!2. Insert the activity, role, number of staff, LT, PT, and %C&A in the process blocks. The summary timeline should autopopulate. Rolled %C&A = 0%3. Verify the current state summary metrics are calculated correctly.Insert Tech Source (with arrows or delete)* Total LT and PT are calculated by summing the LT and PT values for all processes.4. Add the current state overview, challenges, and bottleneck. Include any other relevant metrics (i.e., NPS, AHT, etc.).** Total %C&A is the Rolled %C&A, which is calculated by multiplying the %C&A for all processes.5. Review the assignment instructions once more. Check your work. Upload and submit when ready.Insert activityInsert activityInsert activityInsert activityInsert activityInsert activityInsert role (insert # of Staff)Insert role (insert # of Staff)Insert role (insert # of Staff)Insert role (insert # of Staff)Insert role (insert # of Staff)Insert role (insert # of Staff)LTunitsLTunitsLTunitsLTunitsLTunitsLTunitsPTunitsPTu nitsPTunitsPTunitsPTunitsPTunits%C&A%C&A%C&A%C&A% C&A%C&ALT:0LT:0LT:0LT:0LT:0LT:0PT:0PT:0PT:0PT:0PT: 0PT:0Overview of the ProcessDescribe the process hereChallengesList and briefly describe the challenges hereList and briefly describe the challenges hereList and briefly describe the challenges hereBottlenecksList and briefly describe the bottlenecks hereList and briefly describe the bottlenecks hereList and briefly describe the bottlenecks
- 12. hereReferencesMartin, K. & Osterling, M. (2014). Value Stream Mapping. Part A VSM 7 blockNameVanessa WoodardTitle: Skyworth Design Value StreamDate10/27/22Demand or Takt time:A customer needs 6 books which will take 1230 hours to produce and deliverCustomerTotal LT (minutes) = 205Standard Work Instructions: Total PT (minutes)= 12301. Insert your name, title of the value stream, and demand or Takt time.Activity Ratio = Total PT/Total LT600%2. Insert the activity, role, number of staff, LT, PT, and %C&A in the process blocks. The summary timeline should autopopulate. Rolled %C&A = 52%3. Verify the current state summary metrics are calculated correctly.Production Control* Total LT and PT are calculated by summing the LT and PT values for all processes.4. Add the current state overview, challenges, and bottleneck. Include any other relevant metrics (i.e., NPS, AHT, etc.).** Total %C&A is the Rolled %C&A, which is calculated by multiplying the %C&A for all processes.5. Review the assignment instructions once more. Check your work. Upload and submit when ready.Review & UpdateFirst Draft editingQC Supplier MaterialFinal ApprovalPrint ProofsProof ApprovalReceiving and ShippingReviewing and updating books needs two persons and each books requires 30 minutesFirst draft editing requires two persons each taking one hour for the draftQuanity supplied material requires one person who will consume one hour per
- 13. bookFinal Approval is done by one person and will take thirty minutes per bookThe prints will have to be proof read by one person who will take ten minutes per bookthe books have to be apprived for printing purposes. It will take one person who will take five minutes per book.the books will be shipped to the client LT30minsLT60minsLT60minsLT30minsLT10minsLT5minsLT1 0minsPT180minsPT360minsPT360minsPT180minsPT60minsPT 30minsPT60mins%C&A90%%C&A90%%C&A96%%C&A70% %C&A100%%C&A95%%C&A100%LT:30LT:60LT:60LT:30LT: 10LT:5LT:10PT:180PT:360PT:360PT:180PT:60PT:30PT:60Ove rview of the ProcessJK makes an order for two hundred units of books from Skyworth Design House. These Units are sibdivided into book 1, book 2, book 3, book 4, book 5 and book 6. Skyworth design house has 25 units in store and will therefore seek the processes of SDF supplier who is the prinitng house well as the graphic designer. Skyworth will review and update each of the books which will take approximately three hours to do so. these reviews have to be drafted and will consume six hours to do so. This will be followed by a supplier material requisition that will take six hours. Generally the whole process will take 1230 minutes which is approximately twenty one working hours. The client will get their order in the fourth dayChallengesthere may be issues in reviewing and getting the feedback to the print housethere are delays in the print house
- 14. which may cause delays in the operations.a minor error in one book may cause the design house to recheck all other components. Bottlenecksthe client needs the units as fast as possibleReferencesMartin, K. & Osterling, M. (2014). Value Stream Mapping. Part B KaizenNameInstructorAssignment2Date10/27/22The potential Kaizen events are based on the value stream map created in Assignment 1. The potential Kaizen events include:Insert the potential Kaizen event hereInsert the potential Kaizen event hereInsert the potential Kaizen event hereList the chosen Kaizen event, justification, objective, and scope below.Insert text hereThe detailed agenda for the Kaizen event is listed below.List the pre-Kaizen event activities below.Insert text hereDay 1Day 2TimeSession Topic/ObjectiveLean ToolsOutput/DeliverablesRationaleTimeSession Topic/ObjectiveLean ToolsOutput/DeliverablesRationaleDay 3TimeSession Topic/ObjectiveLean ToolsOutput/DeliverablesRationaleDay 4TimeSession Topic/ObjectiveLean ToolsOutput/DeliverablesRationaleDay 5TimeSession Topic/ObjectiveLean ToolsOutput/DeliverablesRationaleProvide the explanation for the number of days, sequence for session topics, and justify the Lean tools to be used and outputs from each session below.Number of days and explanationInsert text hereSequence for Session Topics and ExplanationInsert text hereLean tools
- 15. and explanationInsert text hereSession Outputs and explanationInsert text hereExplain why this detailed Kaizen agenda supports the Kaizen objective and scope below.Insert text hereReferencesMartin, K. & Osterling, M. (2014). Value Stream Mapping. Part C Six Sigma CharterNameInstructorAssignment 3Date10/27/22Based on the value stream map from Assignment 1, the potential Six Sigma Projects include•Increase Rolled % Complete & Accurate: the Rolled % Complete and Accurate was (insert value), which indicates (review page 91 in the Value Stream Mapping book to explain what this means). •Increase Activity Ratio: the Activity Ratio was (insert value), which indicates (review page 90 in the Value Stream Mapping book to explain what this means).•Reduce Total Lead Time: the Total Lead Time was (insert value), which indicates (review page 88 in the Value Stream Mapping book to explain what this means). •Reduce Total Process Time: the Total Process Time was (insert value), which indicates (review page 90 in the Value Stream Mapping book to explain what this means).List the chosen Six Sigma project, justification, objective, and scope below.Insert text hereThe detailed Six Sigma Charter is listed below.Project NameList the project name herePROBLEM STATEMENT: (must be a specific, measurable and chronic problem or performance gap/deficiency; No blame, no causes, no