SlideShare a Scribd company logo
Abstract: The goal of this project was to create a mapped sampling area that can be used by other Geoscience research groups to carry out research at Howard Falls Land
Trust in Franklin Township, Erie County, Pennsylvania. The map divides the land within the boundaries of the land trust into patches of similar land use history so that in the
future, others can do field tests on soils and perform dendrochronology (tree rings studies to find the age of forest in different mapped patches). Orthographic
photographs, (aerial photos of the ground taken from an aircraft wing that has been corrected to remove distortions resulting from the curvature of the earth), were used
to define land use patches from 1939, 1969, 1995, and 2009 to create a final study layer using GIS (Geographic Information Systems) technology. This will allow researchers
to go into the field and use a GPS to find each patch, where they can then take samples from patches that today are classified as agriculture, forested land, or patches that
are transitional to forests. The map that I created in the GIS will produce a sampling frame for future studies, and serves as a database to store information that will be
collected by those future studies and can be visualized on the map.
Objective: to estimate the minimum age of forest on the landscape today
using a sequence of historical orthophotos.
Acknowledgements:Funding: Howard Falls Land Trust
®
0
50
100
150
200
250
1939 1969 1995 2009
ACRES
Change in Land Use by Type
Agriculture Forest Transitional Other
Map 3. 1939 Map 4. 1969
Map 5. 1995 Map 6. 2009
Land Use Type
Agriculture
Forest
Other
Transition zone
Map 2. Map of the Howard Falls Land Trust,
located in the Falls Run watershed in Erie County
Map 1. Map of Pennsylvania Counties,
Erie is highlighted in the upper left corner.
Figure 1. Change in Land Use Type over time by area.
Landscape History at Howard Falls Land
Trust in Franklin Township, Erie County,
Pennsylvania
Map 7. Minimum Forest Age
The classifications that were used to define different land use types were
forested, agriculture, transitional, and other. “Forested” is any area that
appeared to have a predominate land cover of trees. “Agriculture” is any area
that appeared to be used for the production of crops. “Transitional” is any area
that appeared to be changing from one land use type to forest. “Other” is any
area that couldn’t be categorized into any of the three previous land use types.
Map 7. (on the right) Minimum age of forested patches at the Howard Falls Land Trust. This layer was
created by using the “intersect” tool in ArcMap to overlay the 4 individual maps to the left representing
four different years. The green patches have always been forest cover and have a minimum age of 76
years, given the oldest photo used is from 1939. The blue patches represent a zone that has transitioned
to forest since 1969 has a minimum age of 46 years. The dark purple patches have transitioned to forest
over the past 20 years. The pink patches have transitioned to forest in the last 6 years. The light purple
patches have always been agriculture since 1939.
Maps 3-6. (to the left) The Howard Falls land parcel from four different years and
how each land use type changes over the represented year. The pie charts show the
percentage of land broken up into four different land use types.
Figure 1. (below) Corresponds to the maps on the left. As you can see from Maps 3-
6 and Figure 1 the forested patches have grown over the years and agriculture
patches have declined
Sources: http://www.pennpilot.psu.edu/ , http://www.pasda.psu.edu
Lisa Rayburg Department of Geoscience
Major: Environmental Studies
Minor: Geographic Information Systems

More Related Content

What's hot

What's hot (15)

2. Technical introduction to the GSOC Map
2. Technical introduction to the GSOC Map2. Technical introduction to the GSOC Map
2. Technical introduction to the GSOC Map
 
Hydrology Erosion Project
Hydrology Erosion ProjectHydrology Erosion Project
Hydrology Erosion Project
 
Chapter map
Chapter mapChapter map
Chapter map
 
7 icraf gfsm rome-mmarshall_05202015
7 icraf gfsm rome-mmarshall_052020157 icraf gfsm rome-mmarshall_05202015
7 icraf gfsm rome-mmarshall_05202015
 
Visual analysis and pattern recognition using gis and remote sensing techniqu...
Visual analysis and pattern recognition using gis and remote sensing techniqu...Visual analysis and pattern recognition using gis and remote sensing techniqu...
Visual analysis and pattern recognition using gis and remote sensing techniqu...
 
Forest soils in Japan and its state of development of soil information infras...
Forest soils in Japan and its state of development of soil information infras...Forest soils in Japan and its state of development of soil information infras...
Forest soils in Japan and its state of development of soil information infras...
 
Soil erosion assessment using RUSLE and Projection Augmented Landscape Model ...
Soil erosion assessment using RUSLE and Projection Augmented Landscape Model ...Soil erosion assessment using RUSLE and Projection Augmented Landscape Model ...
Soil erosion assessment using RUSLE and Projection Augmented Landscape Model ...
 
Landuse landcover mapping
Landuse landcover mappingLanduse landcover mapping
Landuse landcover mapping
 
Status and Priorities of Soil Management in Japan - Kazuyuki Yagi
Status and Priorities of Soil Management in Japan - Kazuyuki YagiStatus and Priorities of Soil Management in Japan - Kazuyuki Yagi
Status and Priorities of Soil Management in Japan - Kazuyuki Yagi
 
Distribution of maps
Distribution of mapsDistribution of maps
Distribution of maps
 
Themating maping
Themating mapingThemating maping
Themating maping
 
Available information about soil, current land cover / land use in Jordan by ...
Available information about soil, current land cover / land use in Jordan by ...Available information about soil, current land cover / land use in Jordan by ...
Available information about soil, current land cover / land use in Jordan by ...
 
Population Density Mapping using the Dasymetric Method
Population Density Mapping using the Dasymetric MethodPopulation Density Mapping using the Dasymetric Method
Population Density Mapping using the Dasymetric Method
 
Status of soil information in Jordan
Status of soil information in JordanStatus of soil information in Jordan
Status of soil information in Jordan
 
Japan
JapanJapan
Japan
 

Viewers also liked

02 business cycles and unemployment
 02 business cycles and unemployment 02 business cycles and unemployment
02 business cycles and unemployment
NepDevWiki
 
Business Cycle & Unemployment
Business Cycle & UnemploymentBusiness Cycle & Unemployment
Business Cycle & Unemployment
Timothy Smith
 
Economy of Oil Price
Economy of Oil PriceEconomy of Oil Price
Economy of Oil Price
Prasant Patro
 
The Business Cycle
The Business CycleThe Business Cycle
The Business Cycle
James Henry
 
Phases of business cycle
Phases of business cyclePhases of business cycle
Phases of business cycle
anurag singh
 

Viewers also liked (13)

Oil price reduction
Oil price reductionOil price reduction
Oil price reduction
 
02 business cycles and unemployment
 02 business cycles and unemployment 02 business cycles and unemployment
02 business cycles and unemployment
 
Oil
OilOil
Oil
 
Business Cycle & Unemployment
Business Cycle & UnemploymentBusiness Cycle & Unemployment
Business Cycle & Unemployment
 
Business cycles 2
Business cycles 2Business cycles 2
Business cycles 2
 
Phases of business cycle
Phases of business cyclePhases of business cycle
Phases of business cycle
 
Economy of Oil Price
Economy of Oil PriceEconomy of Oil Price
Economy of Oil Price
 
Chiến lược Marketing của Coca Cola
Chiến lược Marketing của Coca ColaChiến lược Marketing của Coca Cola
Chiến lược Marketing của Coca Cola
 
The Business Cycle
The Business CycleThe Business Cycle
The Business Cycle
 
Business cycle
Business cycleBusiness cycle
Business cycle
 
Phases of business cycle
Phases of business cyclePhases of business cycle
Phases of business cycle
 
Bài thuyết trình: Cuộc sống trong thế giới ảo
Bài thuyết trình: Cuộc sống trong thế giới ảoBài thuyết trình: Cuộc sống trong thế giới ảo
Bài thuyết trình: Cuộc sống trong thế giới ảo
 
The Business Cycle and Economic Growth
The Business Cycle and Economic GrowthThe Business Cycle and Economic Growth
The Business Cycle and Economic Growth
 

Similar to Lisas poster (6)

poster version 2
poster version 2poster version 2
poster version 2
 
Soil survey and land evaluation
Soil survey and land evaluationSoil survey and land evaluation
Soil survey and land evaluation
 
Paper - Landscape Change Over 60 Years Surrounding Cedarburg Bog
Paper - Landscape Change Over 60 Years Surrounding Cedarburg BogPaper - Landscape Change Over 60 Years Surrounding Cedarburg Bog
Paper - Landscape Change Over 60 Years Surrounding Cedarburg Bog
 
Webb et al 1978
Webb et al 1978Webb et al 1978
Webb et al 1978
 
NRSC... from the surface down
NRSC...  from the surface downNRSC...  from the surface down
NRSC... from the surface down
 
GEOG652: Digital Imaging and Processing and Analysis
GEOG652: Digital Imaging and Processing and AnalysisGEOG652: Digital Imaging and Processing and Analysis
GEOG652: Digital Imaging and Processing and Analysis
 

Lisas poster

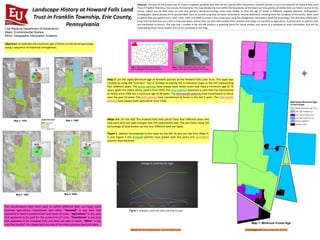
  • 1. Abstract: The goal of this project was to create a mapped sampling area that can be used by other Geoscience research groups to carry out research at Howard Falls Land Trust in Franklin Township, Erie County, Pennsylvania. The map divides the land within the boundaries of the land trust into patches of similar land use history so that in the future, others can do field tests on soils and perform dendrochronology (tree rings studies to find the age of forest in different mapped patches). Orthographic photographs, (aerial photos of the ground taken from an aircraft wing that has been corrected to remove distortions resulting from the curvature of the earth), were used to define land use patches from 1939, 1969, 1995, and 2009 to create a final study layer using GIS (Geographic Information Systems) technology. This will allow researchers to go into the field and use a GPS to find each patch, where they can then take samples from patches that today are classified as agriculture, forested land, or patches that are transitional to forests. The map that I created in the GIS will produce a sampling frame for future studies, and serves as a database to store information that will be collected by those future studies and can be visualized on the map. Objective: to estimate the minimum age of forest on the landscape today using a sequence of historical orthophotos. Acknowledgements:Funding: Howard Falls Land Trust ® 0 50 100 150 200 250 1939 1969 1995 2009 ACRES Change in Land Use by Type Agriculture Forest Transitional Other Map 3. 1939 Map 4. 1969 Map 5. 1995 Map 6. 2009 Land Use Type Agriculture Forest Other Transition zone Map 2. Map of the Howard Falls Land Trust, located in the Falls Run watershed in Erie County Map 1. Map of Pennsylvania Counties, Erie is highlighted in the upper left corner. Figure 1. Change in Land Use Type over time by area. Landscape History at Howard Falls Land Trust in Franklin Township, Erie County, Pennsylvania Map 7. Minimum Forest Age The classifications that were used to define different land use types were forested, agriculture, transitional, and other. “Forested” is any area that appeared to have a predominate land cover of trees. “Agriculture” is any area that appeared to be used for the production of crops. “Transitional” is any area that appeared to be changing from one land use type to forest. “Other” is any area that couldn’t be categorized into any of the three previous land use types. Map 7. (on the right) Minimum age of forested patches at the Howard Falls Land Trust. This layer was created by using the “intersect” tool in ArcMap to overlay the 4 individual maps to the left representing four different years. The green patches have always been forest cover and have a minimum age of 76 years, given the oldest photo used is from 1939. The blue patches represent a zone that has transitioned to forest since 1969 has a minimum age of 46 years. The dark purple patches have transitioned to forest over the past 20 years. The pink patches have transitioned to forest in the last 6 years. The light purple patches have always been agriculture since 1939. Maps 3-6. (to the left) The Howard Falls land parcel from four different years and how each land use type changes over the represented year. The pie charts show the percentage of land broken up into four different land use types. Figure 1. (below) Corresponds to the maps on the left. As you can see from Maps 3- 6 and Figure 1 the forested patches have grown over the years and agriculture patches have declined Sources: http://www.pennpilot.psu.edu/ , http://www.pasda.psu.edu Lisa Rayburg Department of Geoscience Major: Environmental Studies Minor: Geographic Information Systems