Operating Ratios asPerformanceMeasure s 11C H A P T E RTHE.docx
DST
1. Ryan Dunn
DST
Part 1
Business Overview
DST Systems, Inc. was founded in 1968 and is based in Kansas City, Missouri. They
provide technology- based information and servicing solution in the United Sates, the United
Kingdom, Canada, Australia, and internationally. They have a Financial Services segment
offering investor and asset distribution services to companies in the financial services industry.
The segment provides customers with information processing solutions, such as tracking of
purchases, redemptions, and exchanges and transfers of shares; maintaining investor
identification and ownership records; reconciling cash and share activity; processing dividends;
reporting sales; performing tax and other compliance functions; and providing information for
printing of investor trade confirmations, statements, and year-end tax forms. The company’s
Healthcare Services segment offers healthcare organizations a range of medical and pharmacy
solutions. Customer Communications segment provides a range of integrated print, mail, and
electronic solutions to companies. The company’s Investments and Other segment owns and
operates real estate properties for lease; and has investments in equity securities, private equity
investments, and other financial interests. DST Systems, Inc.
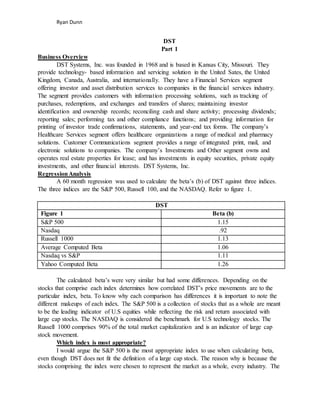
RegressionAnalysis
A 60 month regression was used to calculate the beta’s (b) of DST against three indices.
The three indices are the S&P 500, Russell 100, and the NASDAQ. Refer to figure 1.
DST
Figure 1 Beta (b)
S&P 500 1.15
Nasdaq .92
Russell 1000 1.13
Average Computed Beta 1.06
Nasdaq vs S&P 1.11
Yahoo Computed Beta 1.26
The calculated beta’s were very similar but had some differences. Depending on the
stocks that comprise each index determines how correlated DST’s price movements are to the
particular index, beta. To know why each comparison has differences it is important to note the
different makeups of each index. The S&P 500 is a collection of stocks that as a whole are meant
to be the leading indicator of U.S equities while reflecting the risk and return associated with
large cap stocks. The NASDAQ is considered the benchmark for U.S technology stocks. The
Russell 1000 comprises 90% of the total market capitalization and is an indicator of large cap
stock movement.
Which index is most appropriate?
I would argue the S&P 500 is the most appropriate index to use when calculating beta,
even though DST does not fit the definition of a large cap stock. The reason why is because the
stocks comprising the index were chosen to represent the market as a whole, every industry. The
2. Ryan Dunn
Standard & Poor’s index committee are constantly updating, replacing stocks to make the index
actively reflect the market. The reason why the Russell 1000 is not appropriate is because it is a
market capitalization weighted index comparted to a market value weighted index. The larger
stocks that comprise the Russell will move the index more than the smaller ones.
How do the calculated beta’s compare to published sources?
The Yahoo Finance computed beta for DST is 1.26 compared to 1.15. The reason why
this difference occurs is because of the time frame in our data differs from Yahoo’s. Yahoo’s
data goes back 36 months compared to 60 months. This means Yahoo’s information is more
sensitive to short term.
Compared to NASDAQ index
Higher Total Risk
Standard Deviation
DST 6.48%
NASDAQ 4.32%
Standard deviation is used to measure unsystematic risk. DST has a higher total risk as measured
by standard deviation by almost two percent. DST has more variability in returns than the total NASDAQ
which is to be suspected. The NASDAQ benefits from diversification so should have a lower standard
deviation.
Risk per Unit of Return
Coefficient of Variation
DST 406.52%
NASDAQ 303.2%
The coefficient of return is ratio of the standard deviation to the mean. It is found by dividing the
standard deviation by the expected return. Essentially it allows an investor to gauge how much risk is
being taken in comparison to the amount of return one can expect. When using the coefficient of variation
to judge risk per unit of return DST is riskier than the NASDAQ.
Systematic Risk
Beta (b)
DST 1.15
NASDAQ 1.11
Systematic risk is risk associated with the total market. An example of systematic risk is a
war because a war would impact the whole economy. Beta is the common measure used to judge
how much systematic risk a stock is exposed to. The S&P 500 would have a beta of 1. Anything
with a beta above 1 would have more risk than the market meaning it would be more sensitive to
moves in economy and anything having a beta less than 1 would less sensitive.
Compared to overall stock market
DST Nasdaq S&P500
Average Return 1.59% 1.43% 1.15%
Beta 1.15 1.11 1
Compared to the overall stock market, the NASDAQ and S&P500, DST has a higher
average return. Since DST is not diversified like the indexes in this comparison it can gain and
lose more. If it was a diversified company then it would not be able to experience such high
gains because its’ risk level would be lower. This is reflected in DST’s beta in the above table.
3. Ryan Dunn
Part Two- Financial Analysis
Balance Sheet & Income Statement
Data going back three years was used for the trend analysis for DST. Current assets and
current liabilities go up and down over the analysis. The current ratio improved indicating that
DST is in a better position to cover their short term obligations. Total liabilities and long term
debt decreased every year over the analysis. Shareholder equity increased every year over the
analysis. Looking at the decrease in liabilities and increase equity indicates the company is
shifting their capital structure towards equity financing. Increases in equity financing could cause
negative implications because it is more expensive than debt financing.
DST TREND ANALYSIS
($ Millions)
Balance Sheet Y13 Y12 Y11
1 year %
Change
2 year %
Change
CurrentAssets 702.100 1,012.300 643.600 -31% 9%
CurrentLiabilities 1072.80 1378.50 1073.70 -22% 0
CurrentRatio .79 .69 .71 14% 11%
OtherAssets 72.4 63.3 38.2 14% 90%
Total Liabilities 1906.70 2312.8 2592.90 -18% -26%
Long Term Debt 399.4 492.2 1059.50 -19% -62%
ShareholderEquity 1183.80 1079.70 820 10% 44%
Income Statement
Sales 2652.60 2576.60 2385.20 3% 11%
Cost ofGoods/Operations 2199.80 2174.60 2980.40 1% -26%
Net Income 352.6 216 404.3 63% -13%
EPS Basic from Operations 11.13 8.39 11.35 33% -2%
The income statement shows slight increases in sales every year. The cost of goods
decreases every year indicating DST is becoming more efficient, requiring less resources to
produce more sales. Net income and earnings per share go up and down and over the entire
analysis experienced decreases.
Leverage Ratios
The leverage ratios were gathered into a line graph below for easy comparison. The debt
to equity ratio is used to show what proportion of equity and debt are used to finance its’ assets.
Looking at the graph, the trend in DST’s capital structure is changing towards more equity
financing. The change in capital structure can be seen in the balance sheet as equity increases
and total liabilities decrease.
4. Ryan Dunn
The times interest earned ratio is a measure used to measure a company’s ability to meet
its debt obligations. It is calculated by dividing a company’s earnings before interest and taxes
(EBIT) and dividing it by the total interest payable on bonds and other contractual debt. DST
changed their capital structure to use more equity financing that does not require mandatory
interest payments and paid off liabilities. The result is a higher ratio than the industry average.
DST is in a better position currently than twice the industry average to meet their short term debt
obligations.
Liquidity Ratios
The liquidity ratios were gathered into a line graph below for easy comparison. The
current ratio is computed by taking current assets divided by current liabilities. It is a ratio used
to show a company’s ability to pay their short term obligations. A company unable to meet its
short term obligations would have a ratio under 1. Looking at this ratio DST seems to be in a
good place to meet its financial obligations in the short run.
0
2
4
6
8
10
12
Y13 Y12 Y11 Y10 Y09
Leverage Ratios
Debt to Total Equity
Debt to total Equity
Industry
Times Interest Earned
Times Interest Earned
Industry
5. Ryan Dunn
The cash flow per share ratio shows the after tax earnings plus depreciation, on a per
share basis. The ratio is much harder to influence with accounting changes because it measures
cash instead of other factors that can be changed around under GAAP. Earnings per share ratios
can easy be influenced which is why it was not chosen as an indicator in this ratio analysis.
Using cash flow per share DST is improving but is still lagging tremendously behind the
industry.
The fixed asset turnover is the only ratio for activity analysis in the above graph.
Operating Cycle ratios would have provided valuable information but is not applicable to DST.
The fixed asset turnover is a ratio of net sales to fixed assets. This ratio measures a company’s
ability to generate net sales from fixed asset investments. DST has about half the industry
average under this ratio.
Statement of Cash Flows
Net cash flows on average was around 350 for the valuation and would have been
trending upward if not for the loss on the sale of investments account. In the years 2013 and
2012 large losses were recorded. Net cash flow from investing activities increased the last two
years. One of the reasons was the elimination of short term investments after 2011. The main
0
2
4
6
8
10
12
14
Y13 Y12 Y11 Y10 Y09
Liquidity Ratios
Current Ratio
Current Ratio Industry
Cash Flow Per Share ($)
Cash Flow Per Share
Industry
0
2
4
6
8
10
12
Y13 Y12 Y11 Y10 Y09
Activity Ratios
Fixed Asset
Turnover
Fixed Asset
Turnover Industry
6. Ryan Dunn
cause though was because of the sale of investments in 2012 and 2013. Net cash flow from
financing activities experienced big decreases over the valuation and ended in -731.1 for 2013.
Big increases made in debt reduction were the main driver of negative cash flows in financing.
Stock Valuation
To determine the value of DST stock, I used two models. The first model is the constant
growth model and the second is the non-constant growth model. To apply these models to stock
valuation I need estimated dividends, estimated growth rates, and estimated required rates of
return.
To compute the required rate of return, I used the beta calculated with the S&P 500, 1.15.
I determined this was the best index to use since it is well diversified and widely known.
Discount Rate Using CAPM Model
rRF=3% RPm= 6.5% Beta(b)=1.15
rs = rRF + RPm*beta
Discount rate=3% + 6.5%*B = 3% + (1.15*6.5%) = 10.5%
I now need the estimated long run growth rates for DST. Since the growth rate on yahoo
finance was larger than the discount rate and would not work in the constant growth formula I
used the growth rate of net income which was 6.46%. This number represents a conservative
estimate since yahoo predicted growth of 11%. Since I am not a professional stock analyst like
those used to determine 11% I have little confidence in the number I used, 6.46%.
Constant Growth Model
Current Dividend for DST
$1.20
P0=D0(1+g)/(rs-g)
1.2(1+6.46%)/(10.5%-6.46%)= 1.27752/.0404= 31.62
As of 4/14/2015 the stock price of DST is $113.96. Compared to the valuation using
constant growth, DST is overvalued. DST is considered over valued in the computation because I
used a growth rate nearly half of the growth rate yahoo analysts predicted.
Supernormal Growth Model
D1=d0 (1+g) = 1.2(1+ 8.8%) = 1.3056
D2=d1 (1+g) = 1.3056(1+11.8%) =1.4597
D3=d2 (1+g) = 1.4597(1+6.46%) = 1.554
P2 = D3/ (rs-g) = 1.554/(10.5%-6.46%)= 38.4653
NPV (rate,0, {D1,D2+P2})= NPV(16%,0,{1.3056,1.4597+38.4653})= 30.7963
7. Ryan Dunn
For supernormal growth, I used this year’s growth rate of 8.8% along with the current
dividend of $1.20 from yahoo. Using both of these numbers I predicted a dividend at year one of
$1.3056. I next used dividend of year one along with the predicted growth rate of next year from
yahoo to find the dividend for year two of $1.4597. In year three constant growth begins so the
growth rate in dividends is my assumed growth rate of 6.46%. Using 6.46% and the dividend of
year two I computed a dividend of $1.554 for year three. I now have all the inputs to compute the
price of DST for year two. After finding the price of the stock for year two, I found the net
present value of all the dividends and also the price of the stock. Under net present value the
value of the stock should be $30.7963 which makes it overvalued. Like the constant growth
model this model is also subject to the assumed growth rate which is much lower than analyst’s
predictions.
Works Cited
http://finance.yahoo.com/q/pr?s=DST+Profile
www.investopedia.com/terms