Download as PDF, PPTX

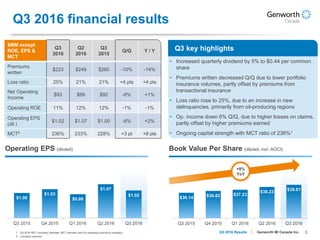
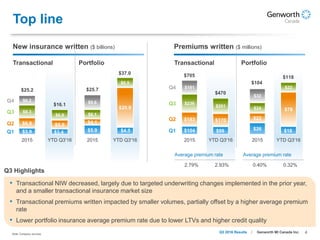
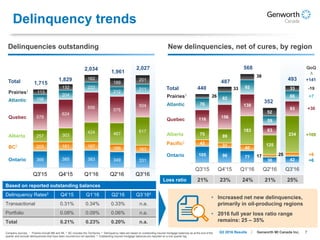
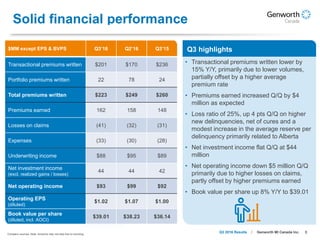
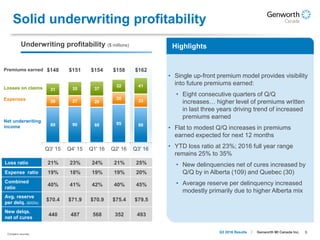
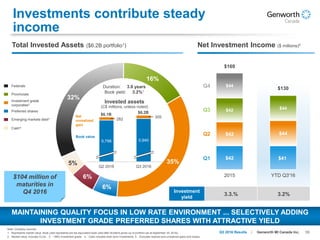


Genworth MI Canada Inc. reported its third quarter 2016 results. Key highlights included: - Premiums written decreased 10% quarter-over-quarter and 14% year-over-year due to lower transactional insurance volumes. - The loss ratio increased to 25% due to a rise in new delinquencies primarily in oil-producing regions of Alberta and Quebec. - Net operating income decreased 6% quarter-over-quarter primarily due to higher losses on claims, though it was up 1% year-over-year.