Download as PDF, PPTX


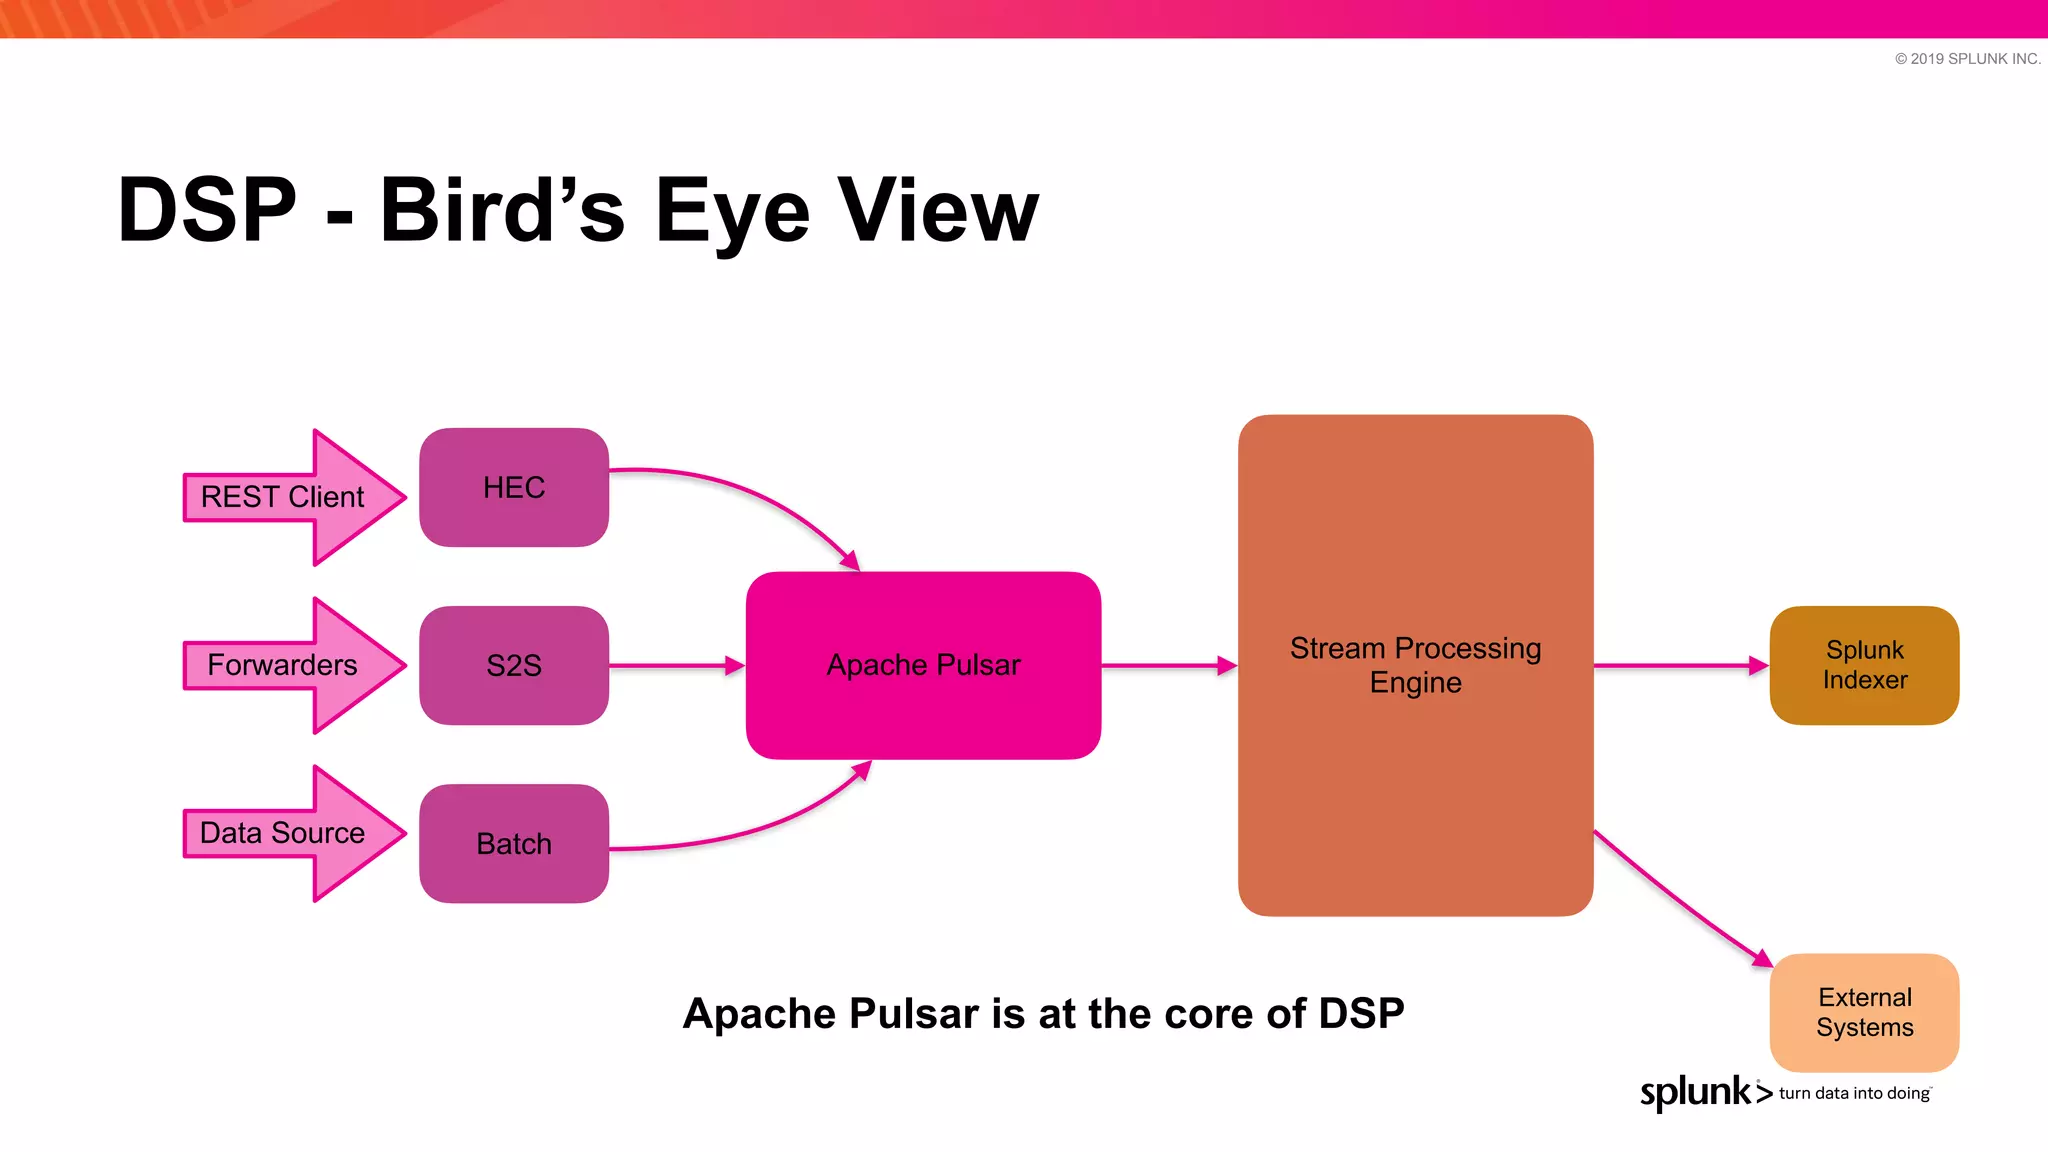

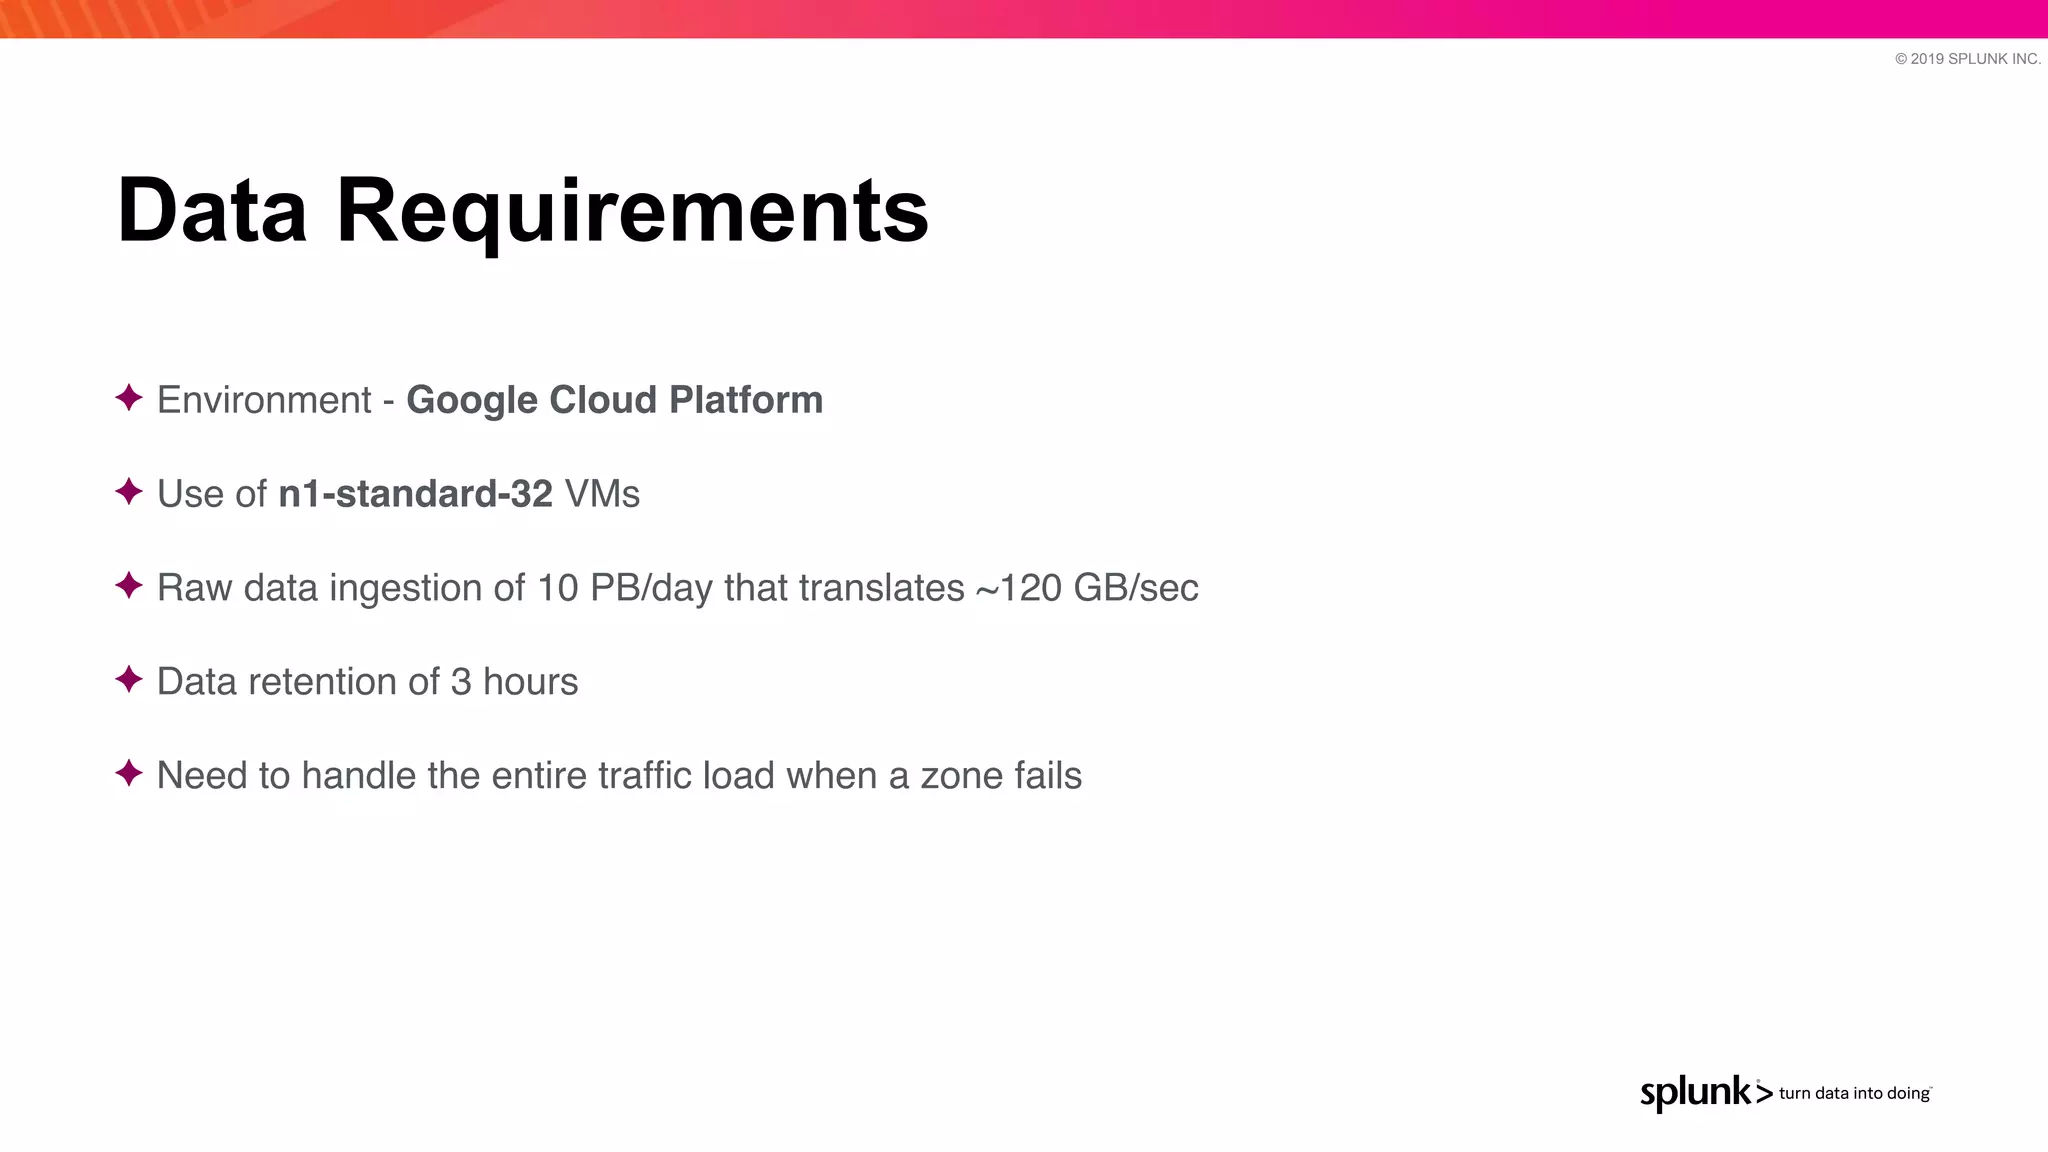
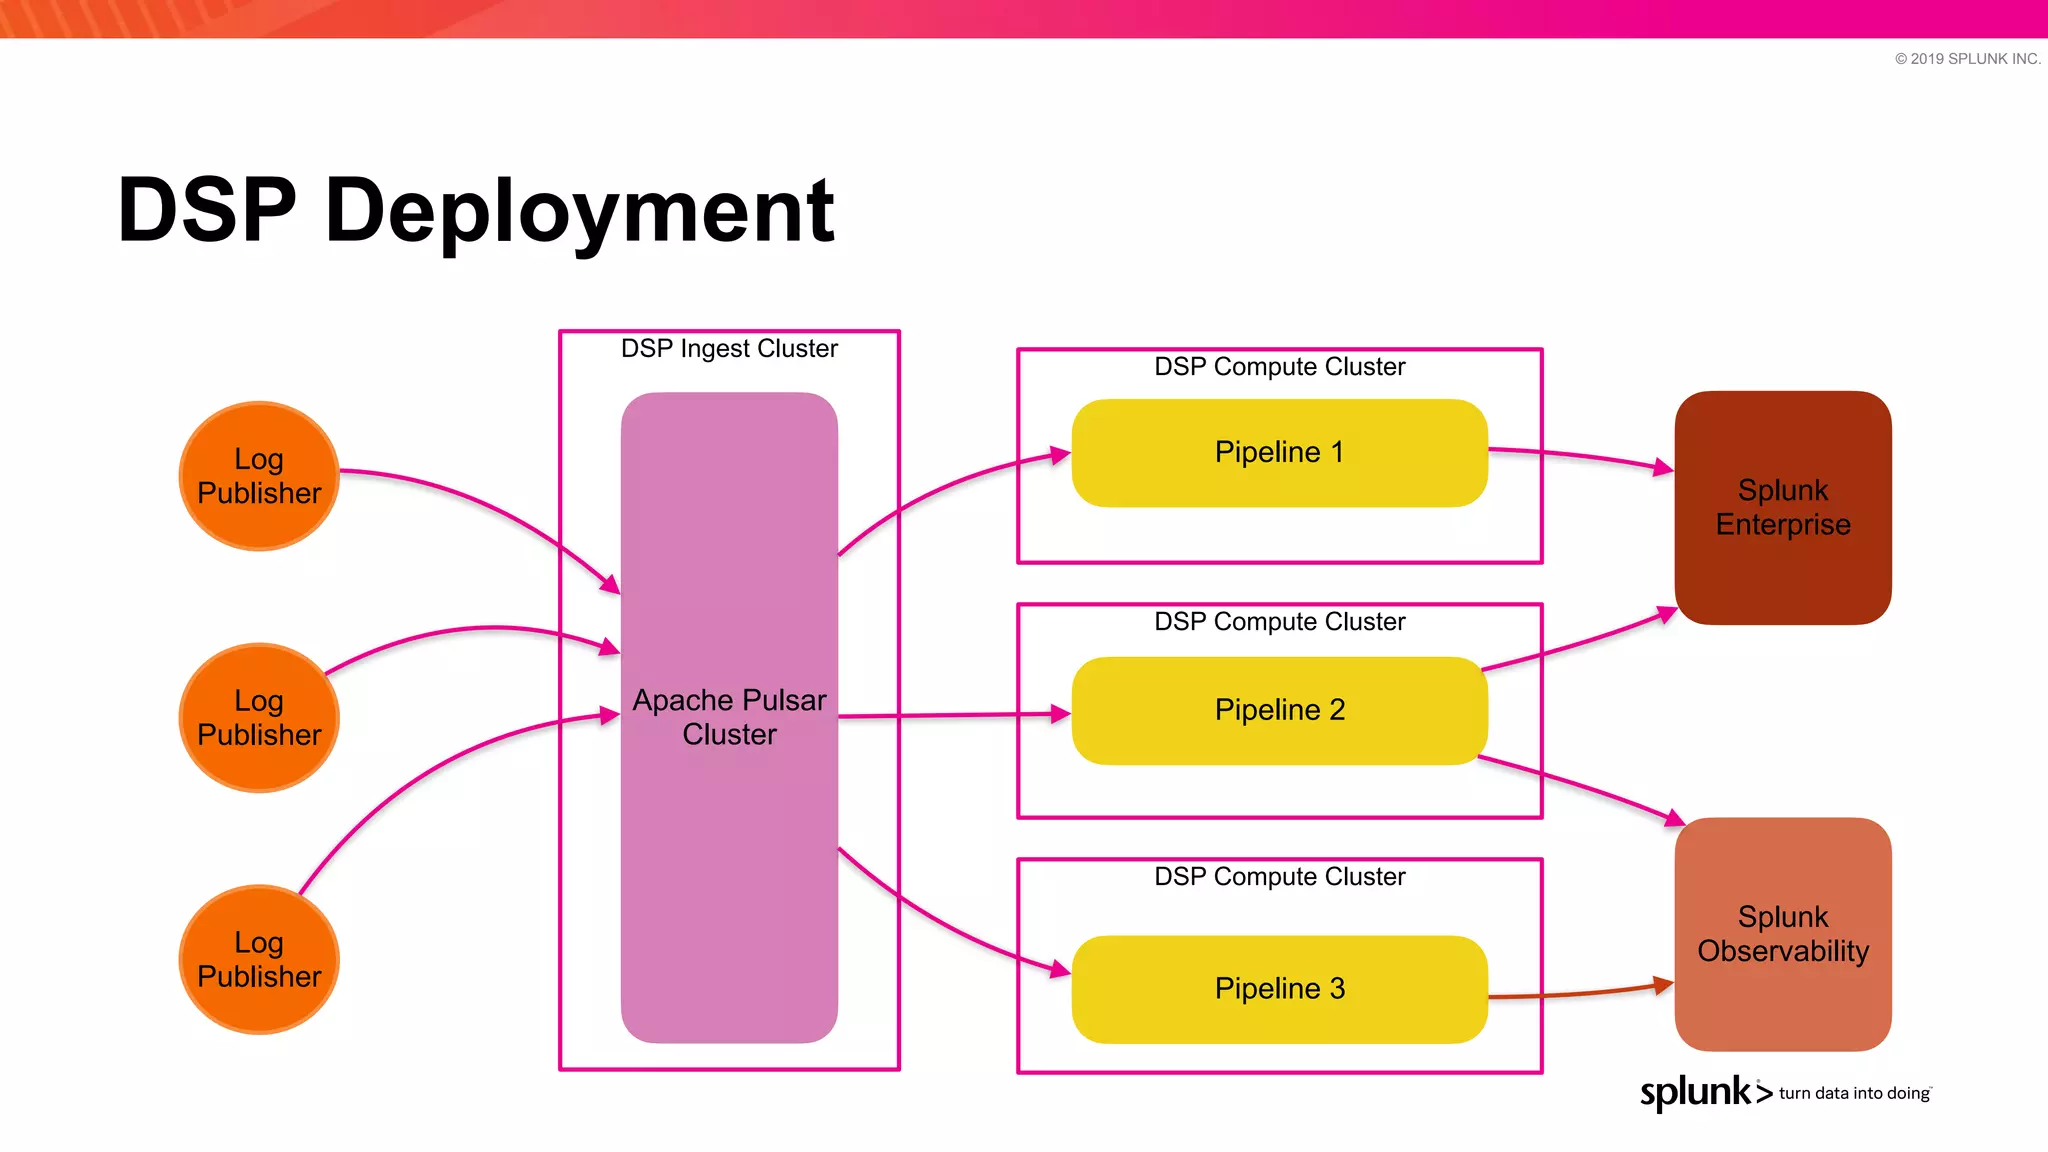
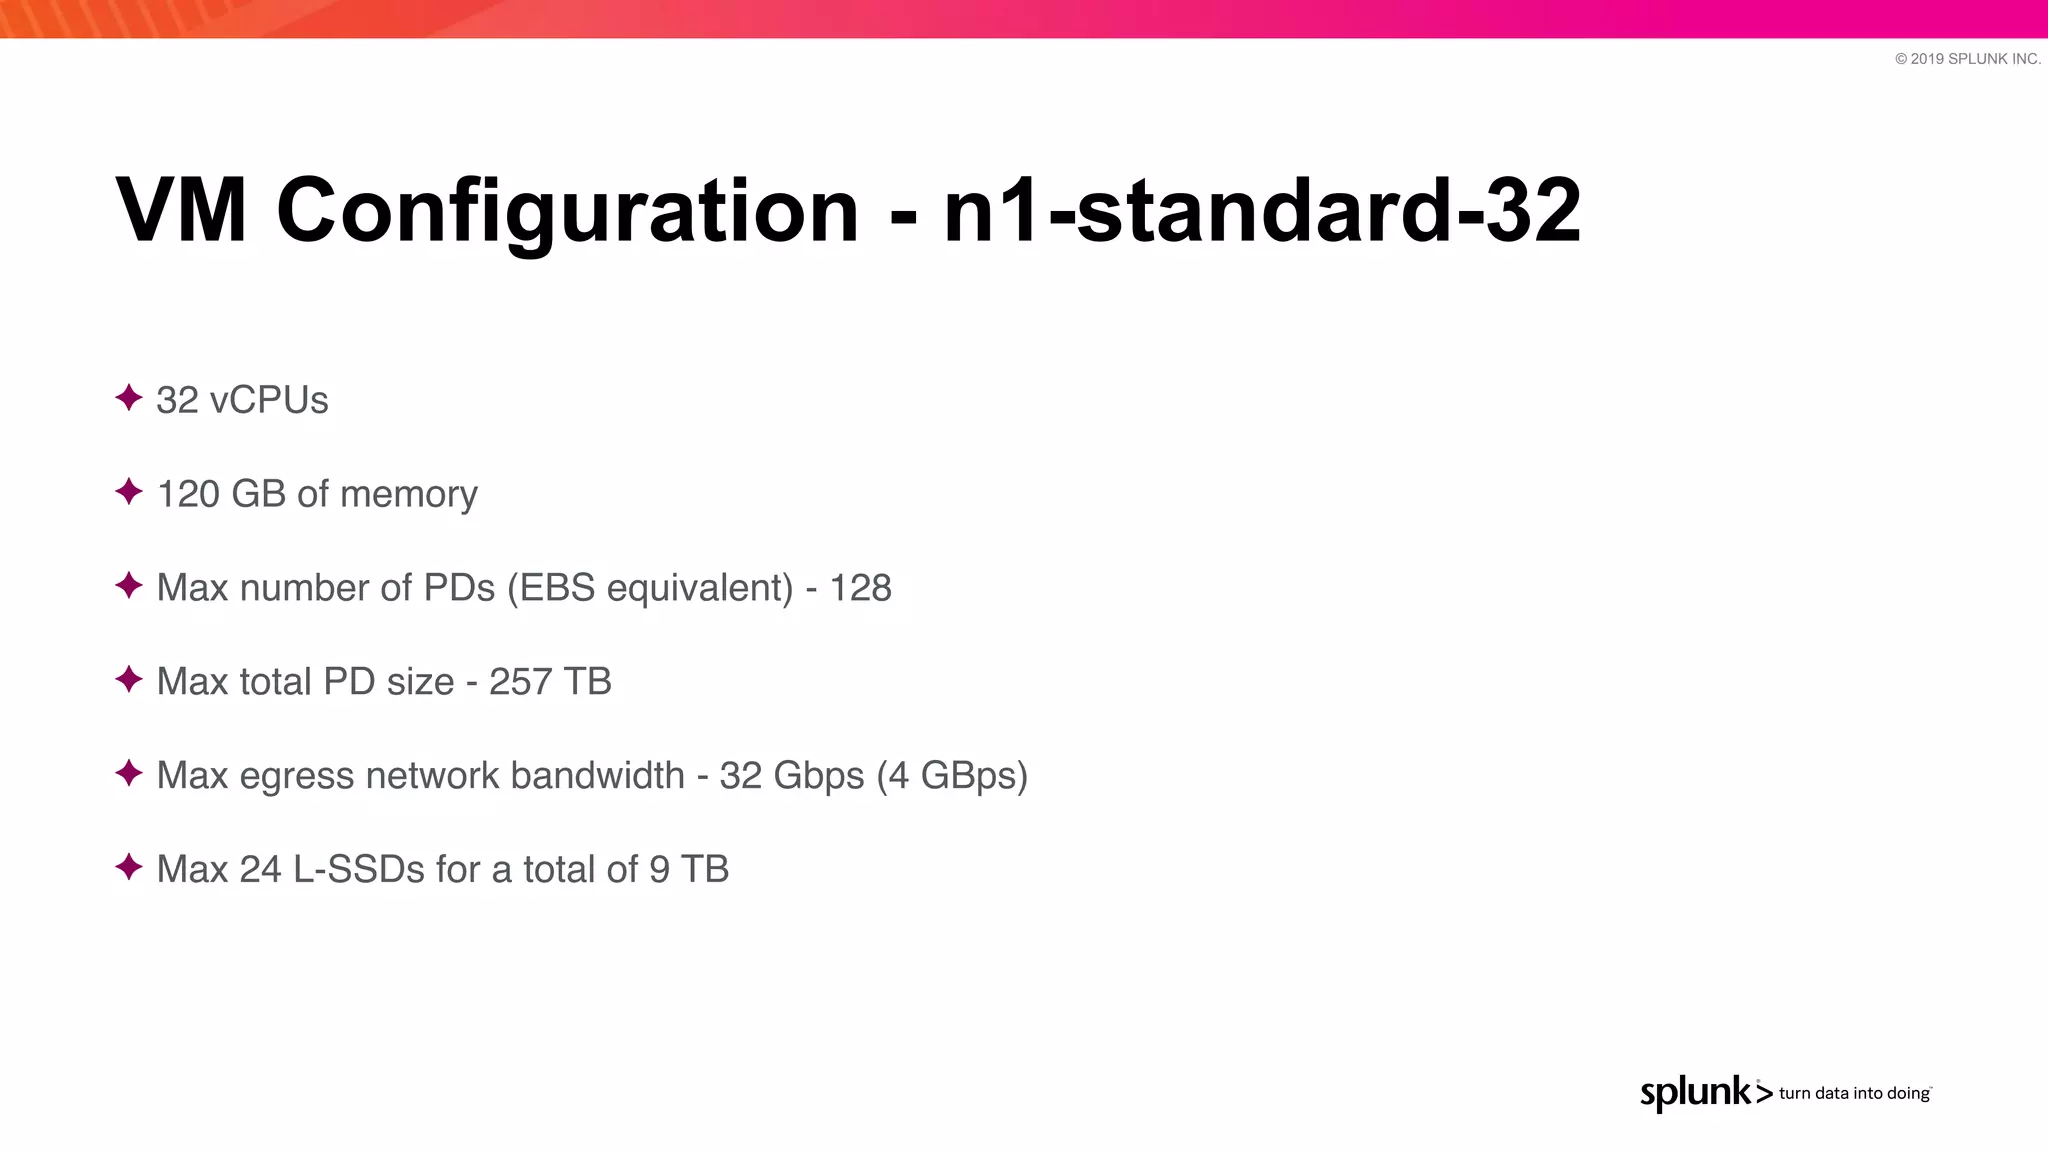

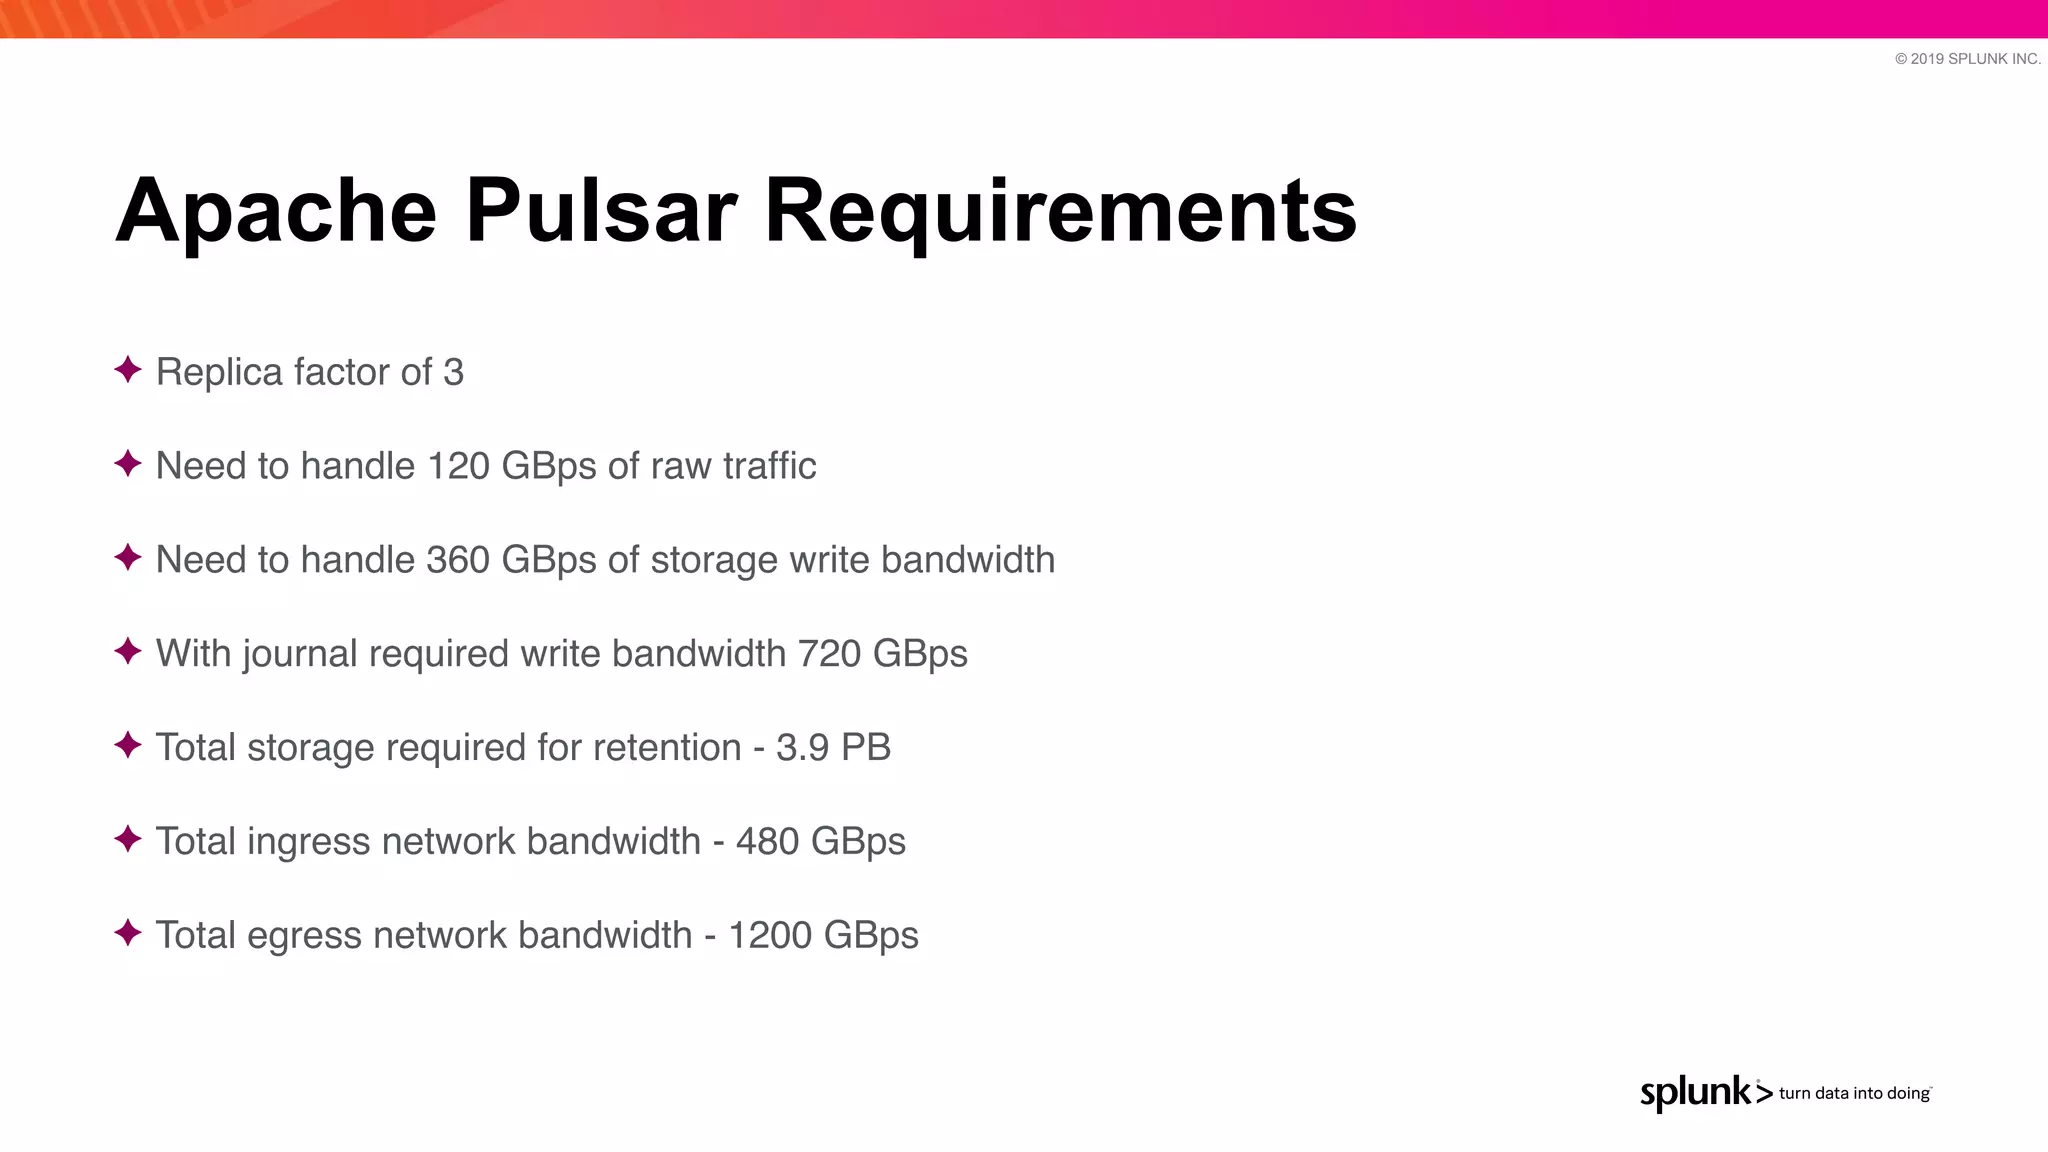
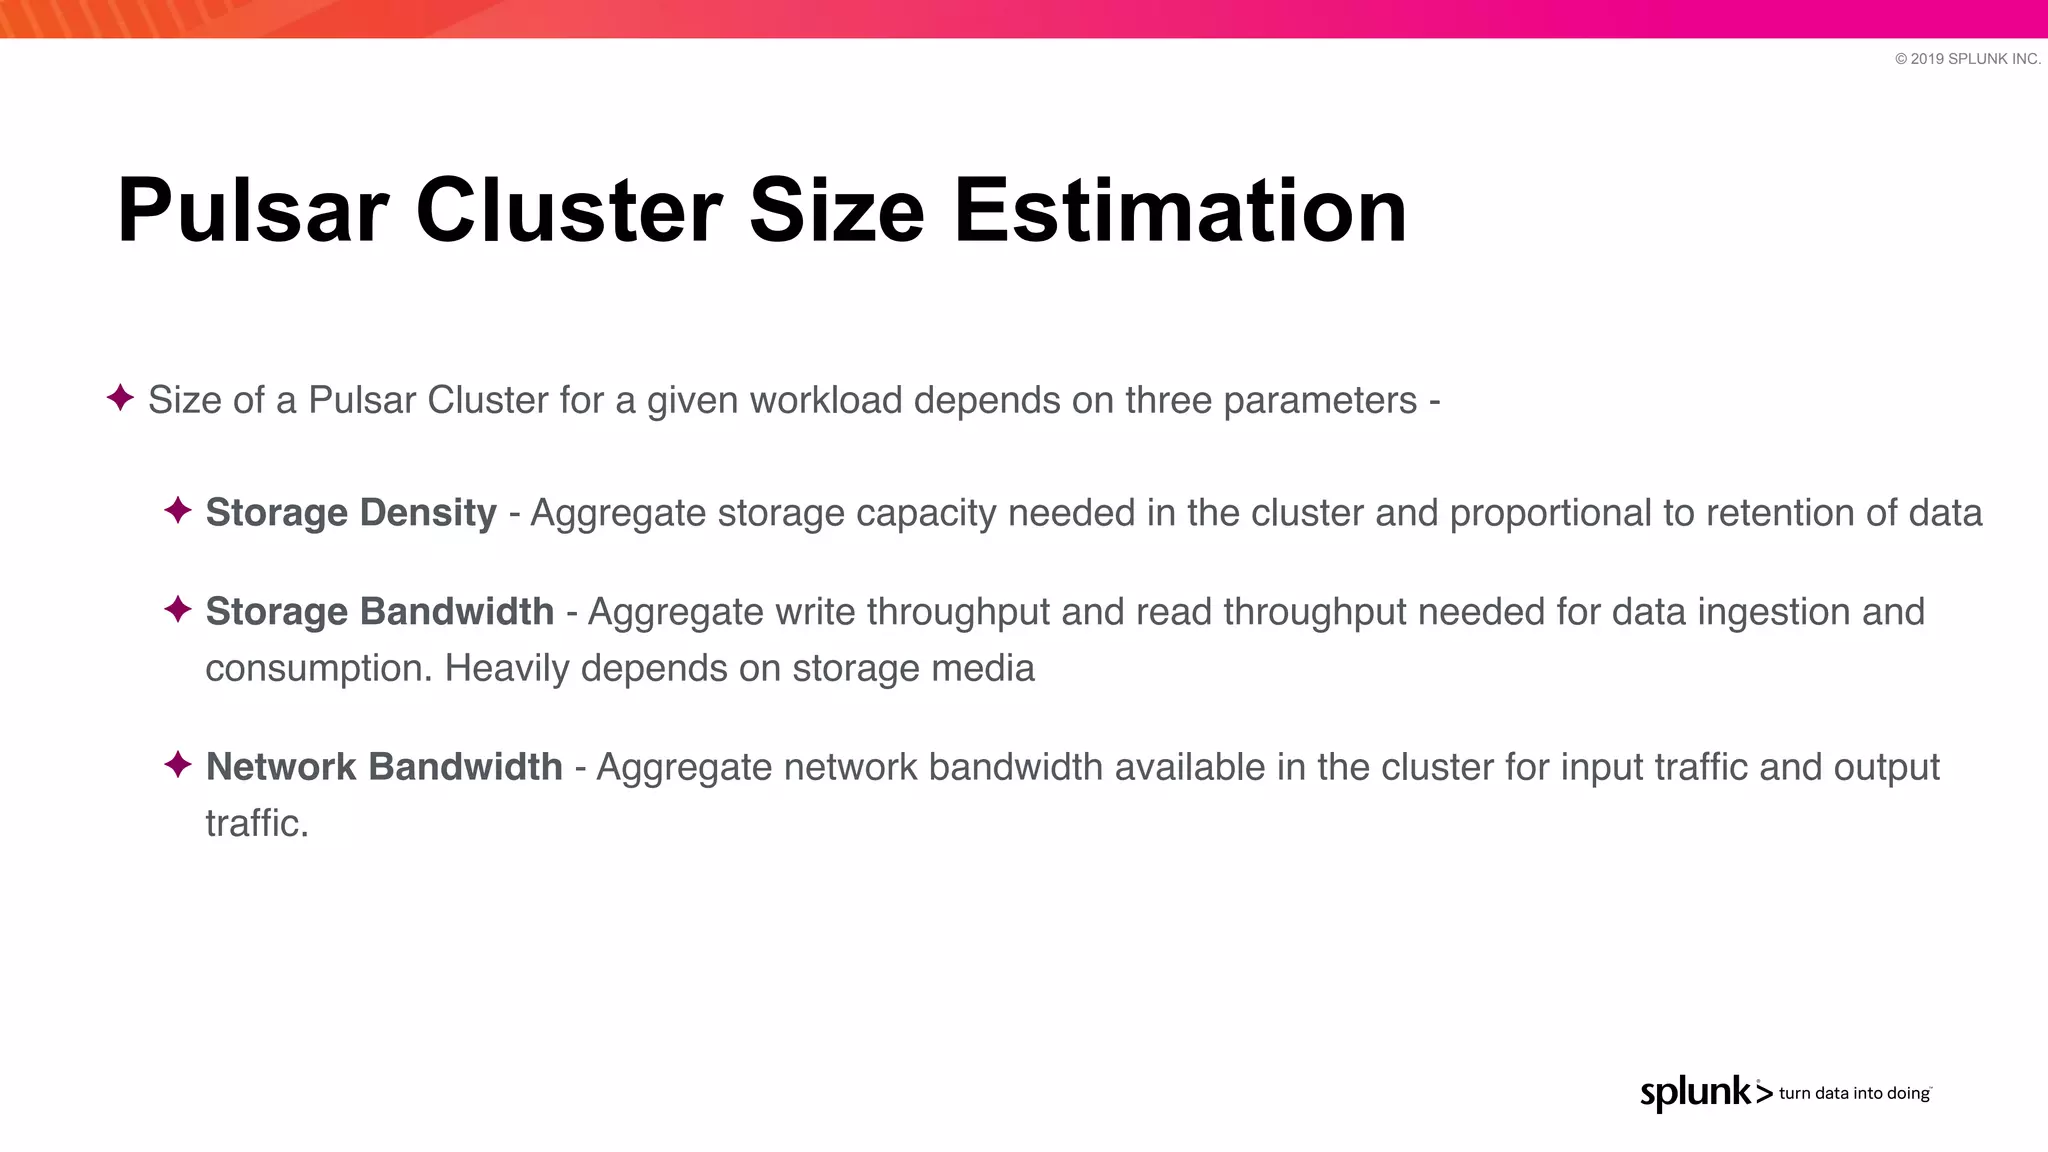
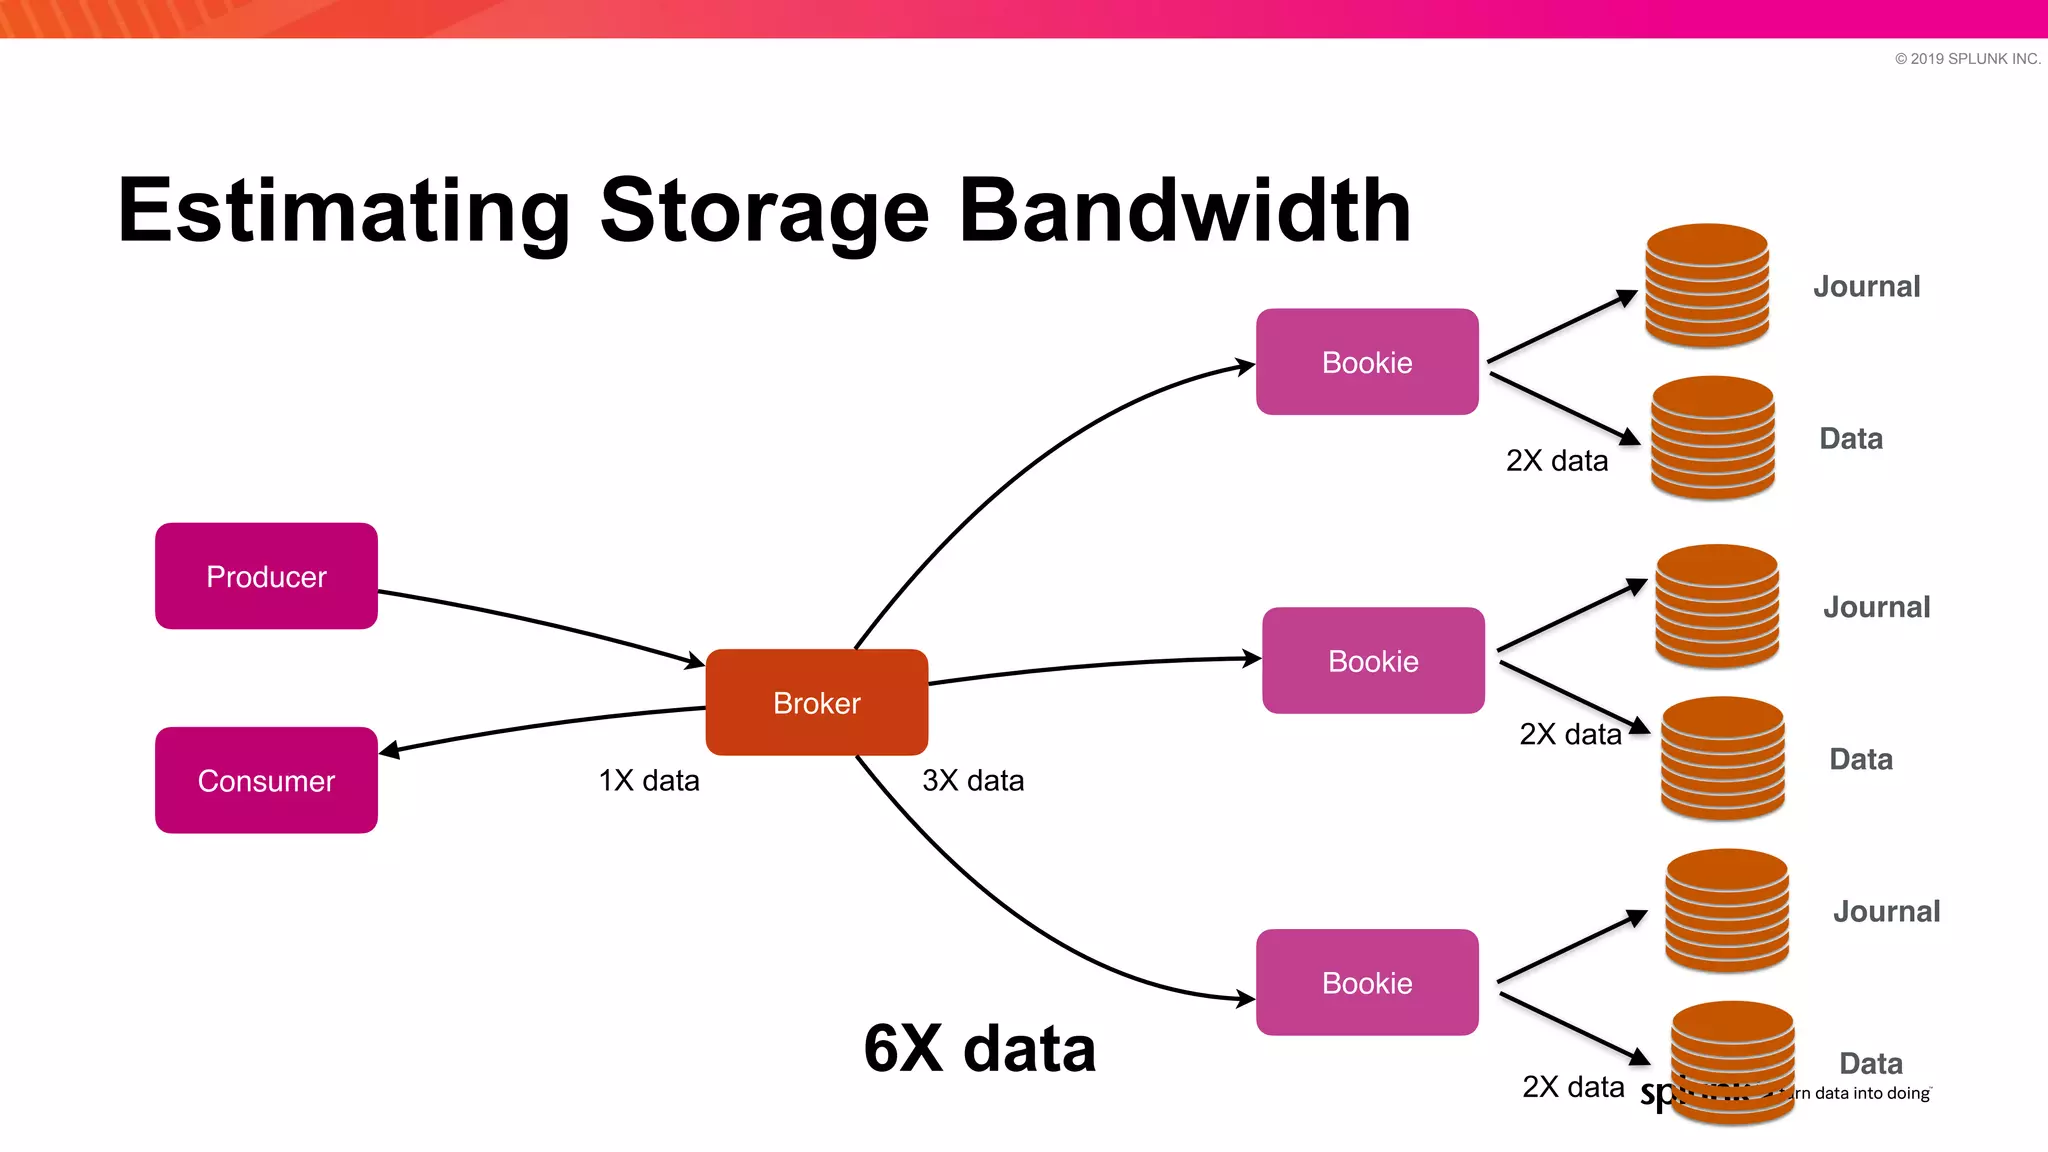
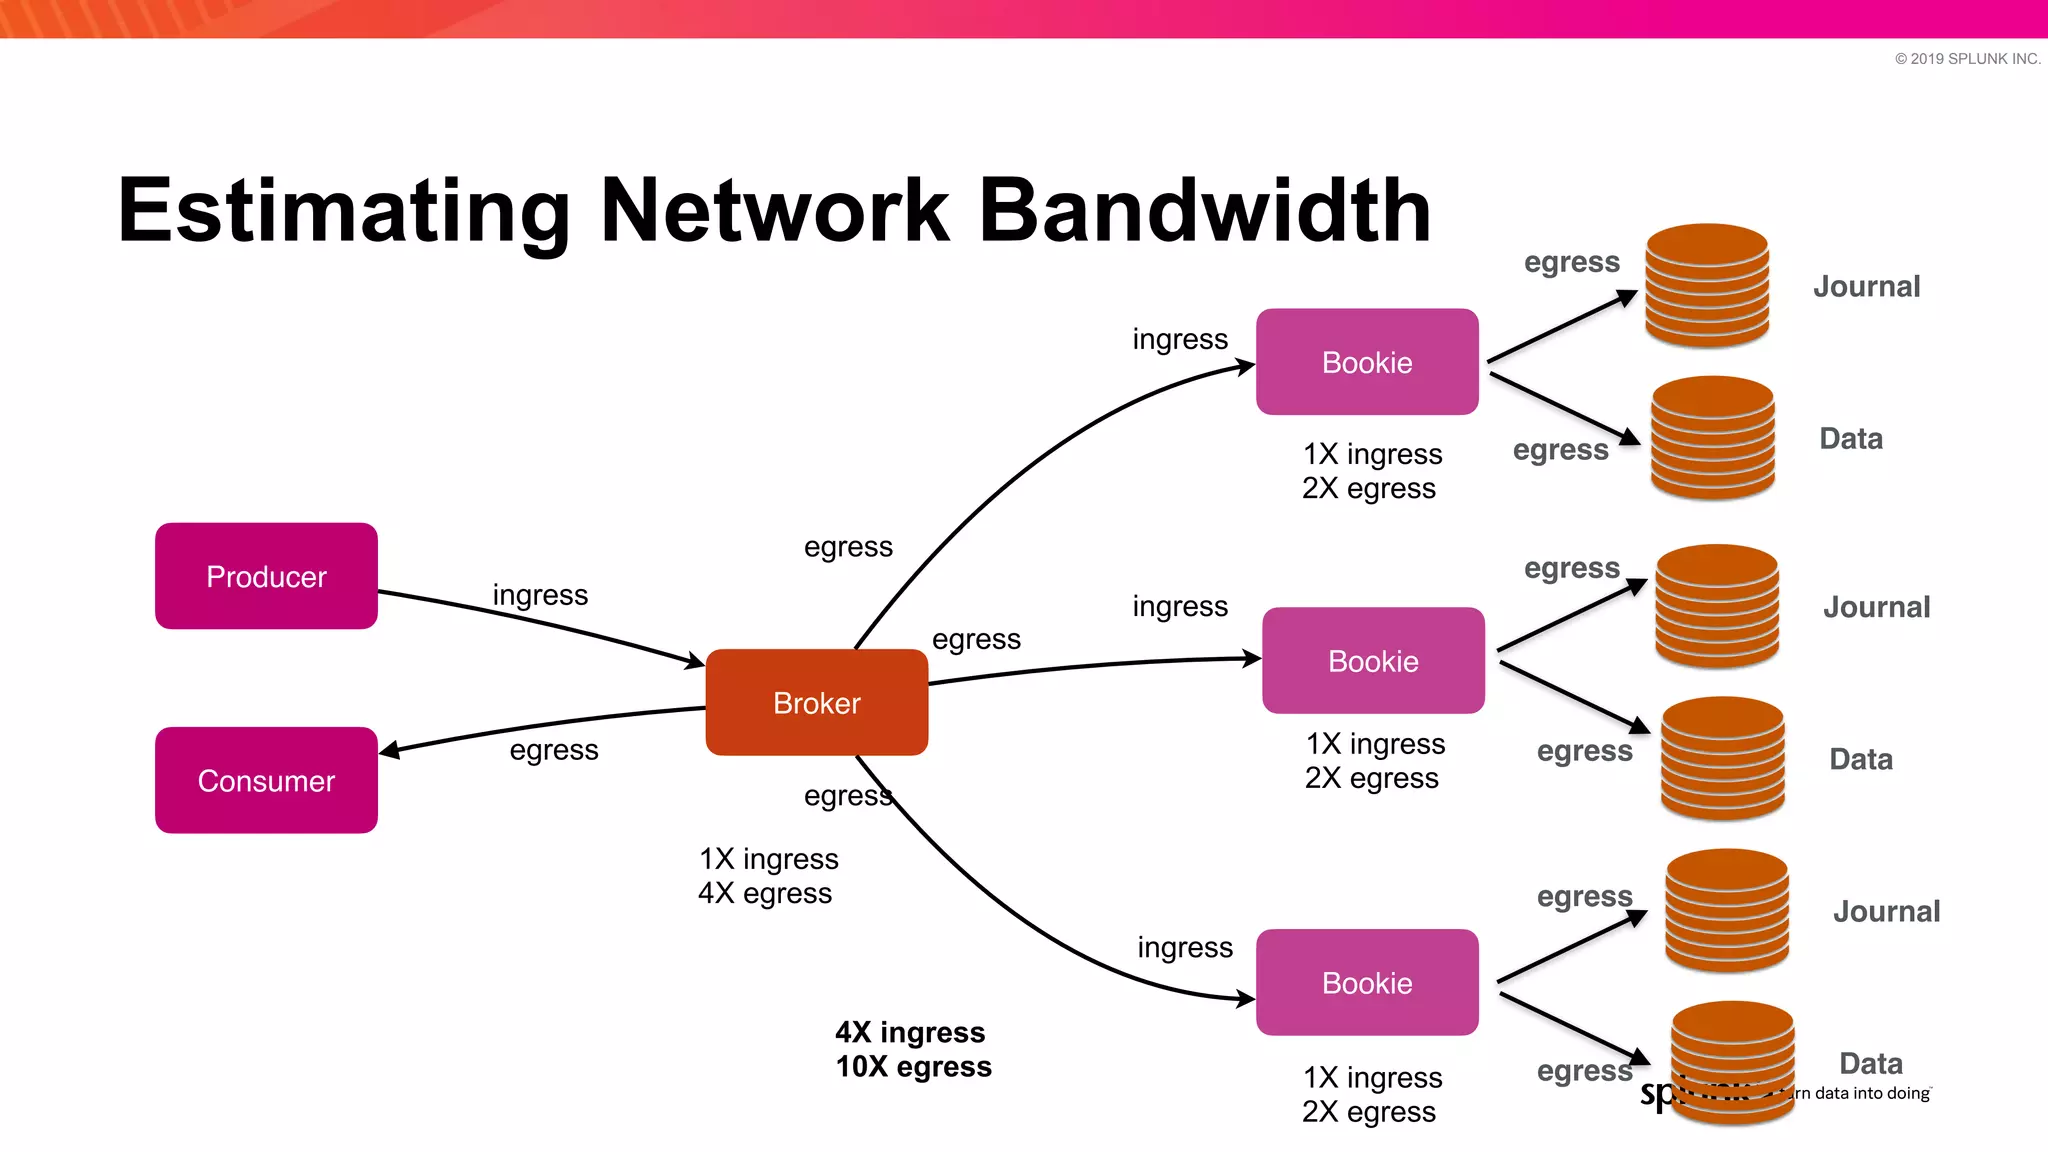
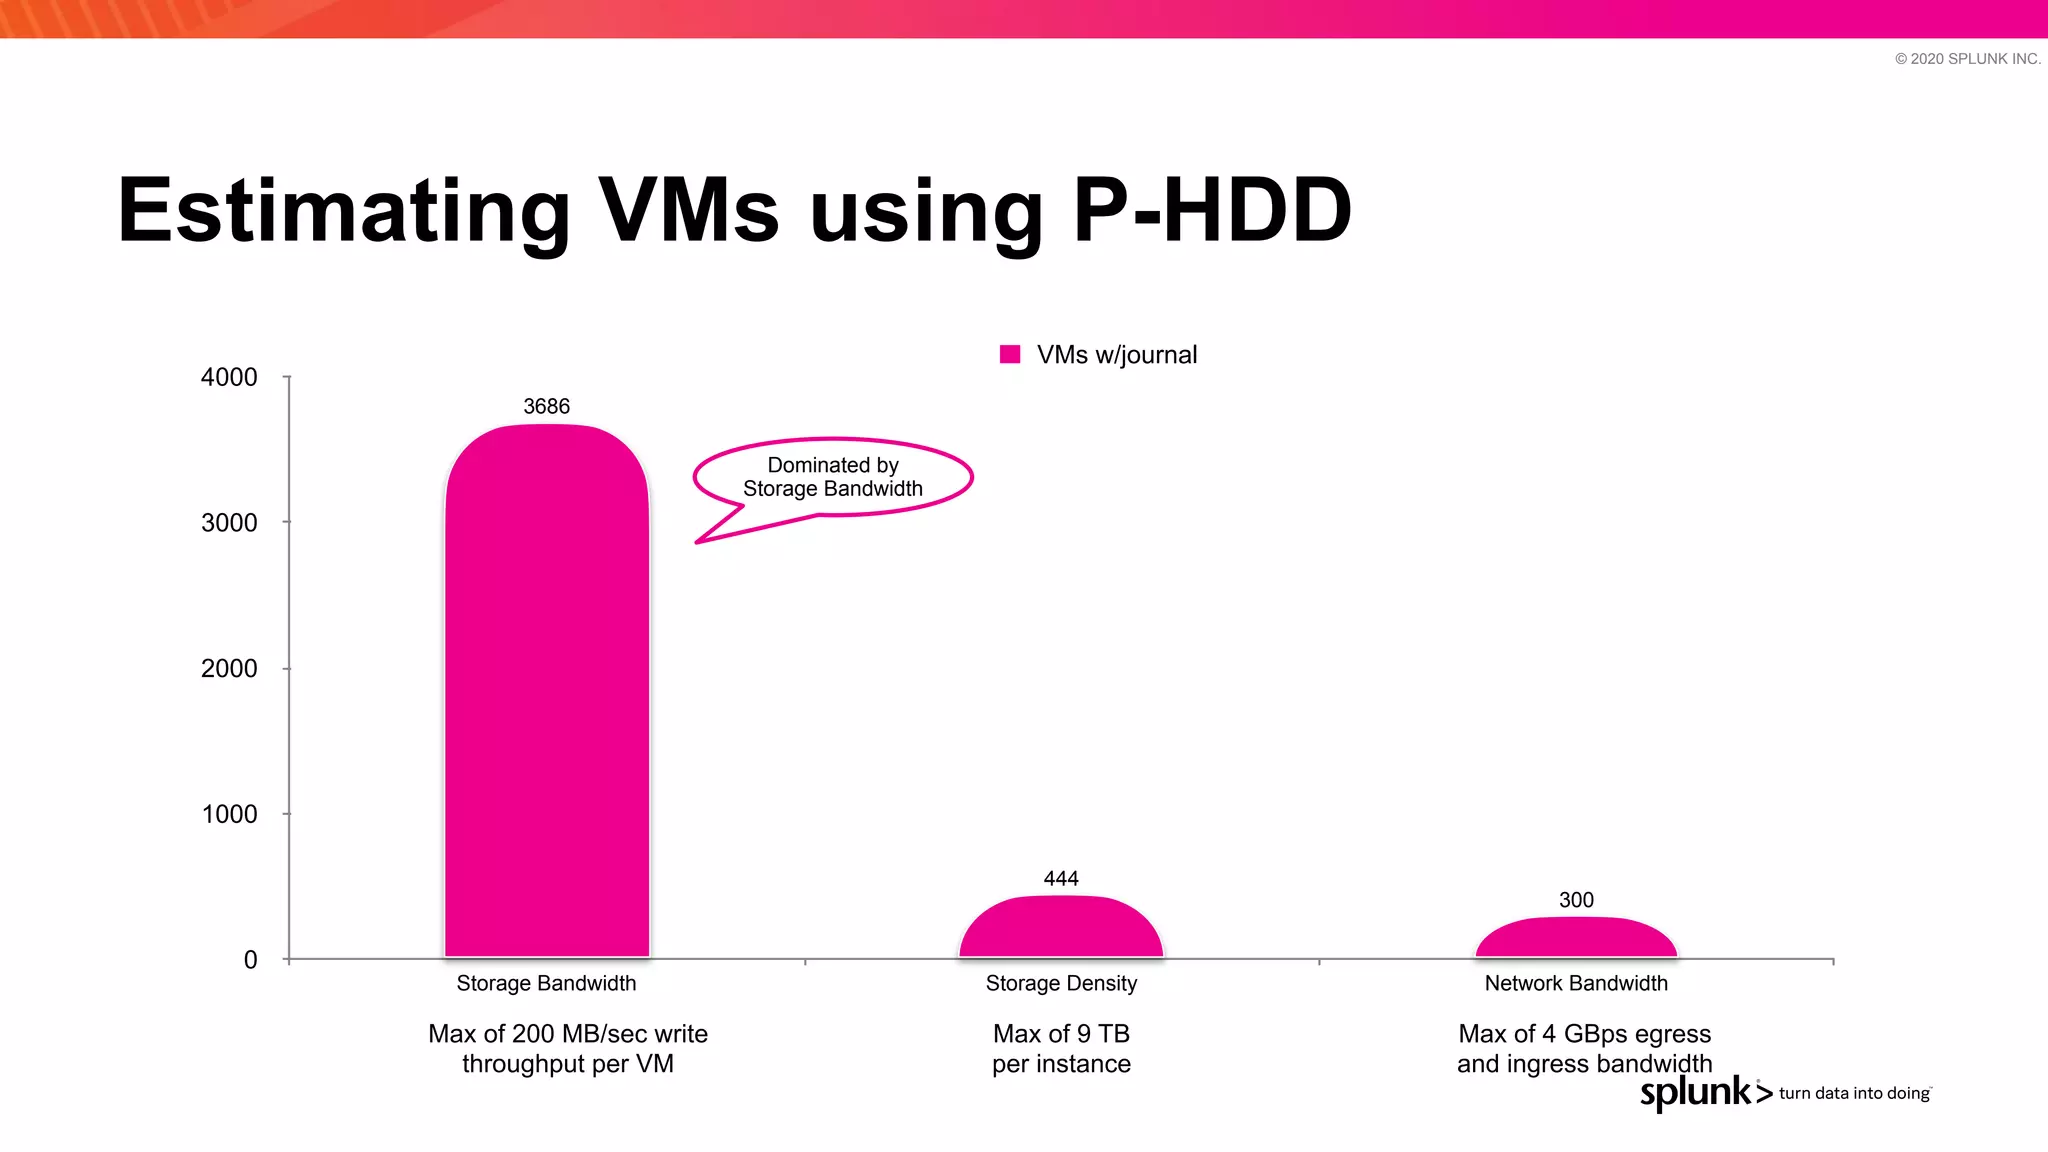
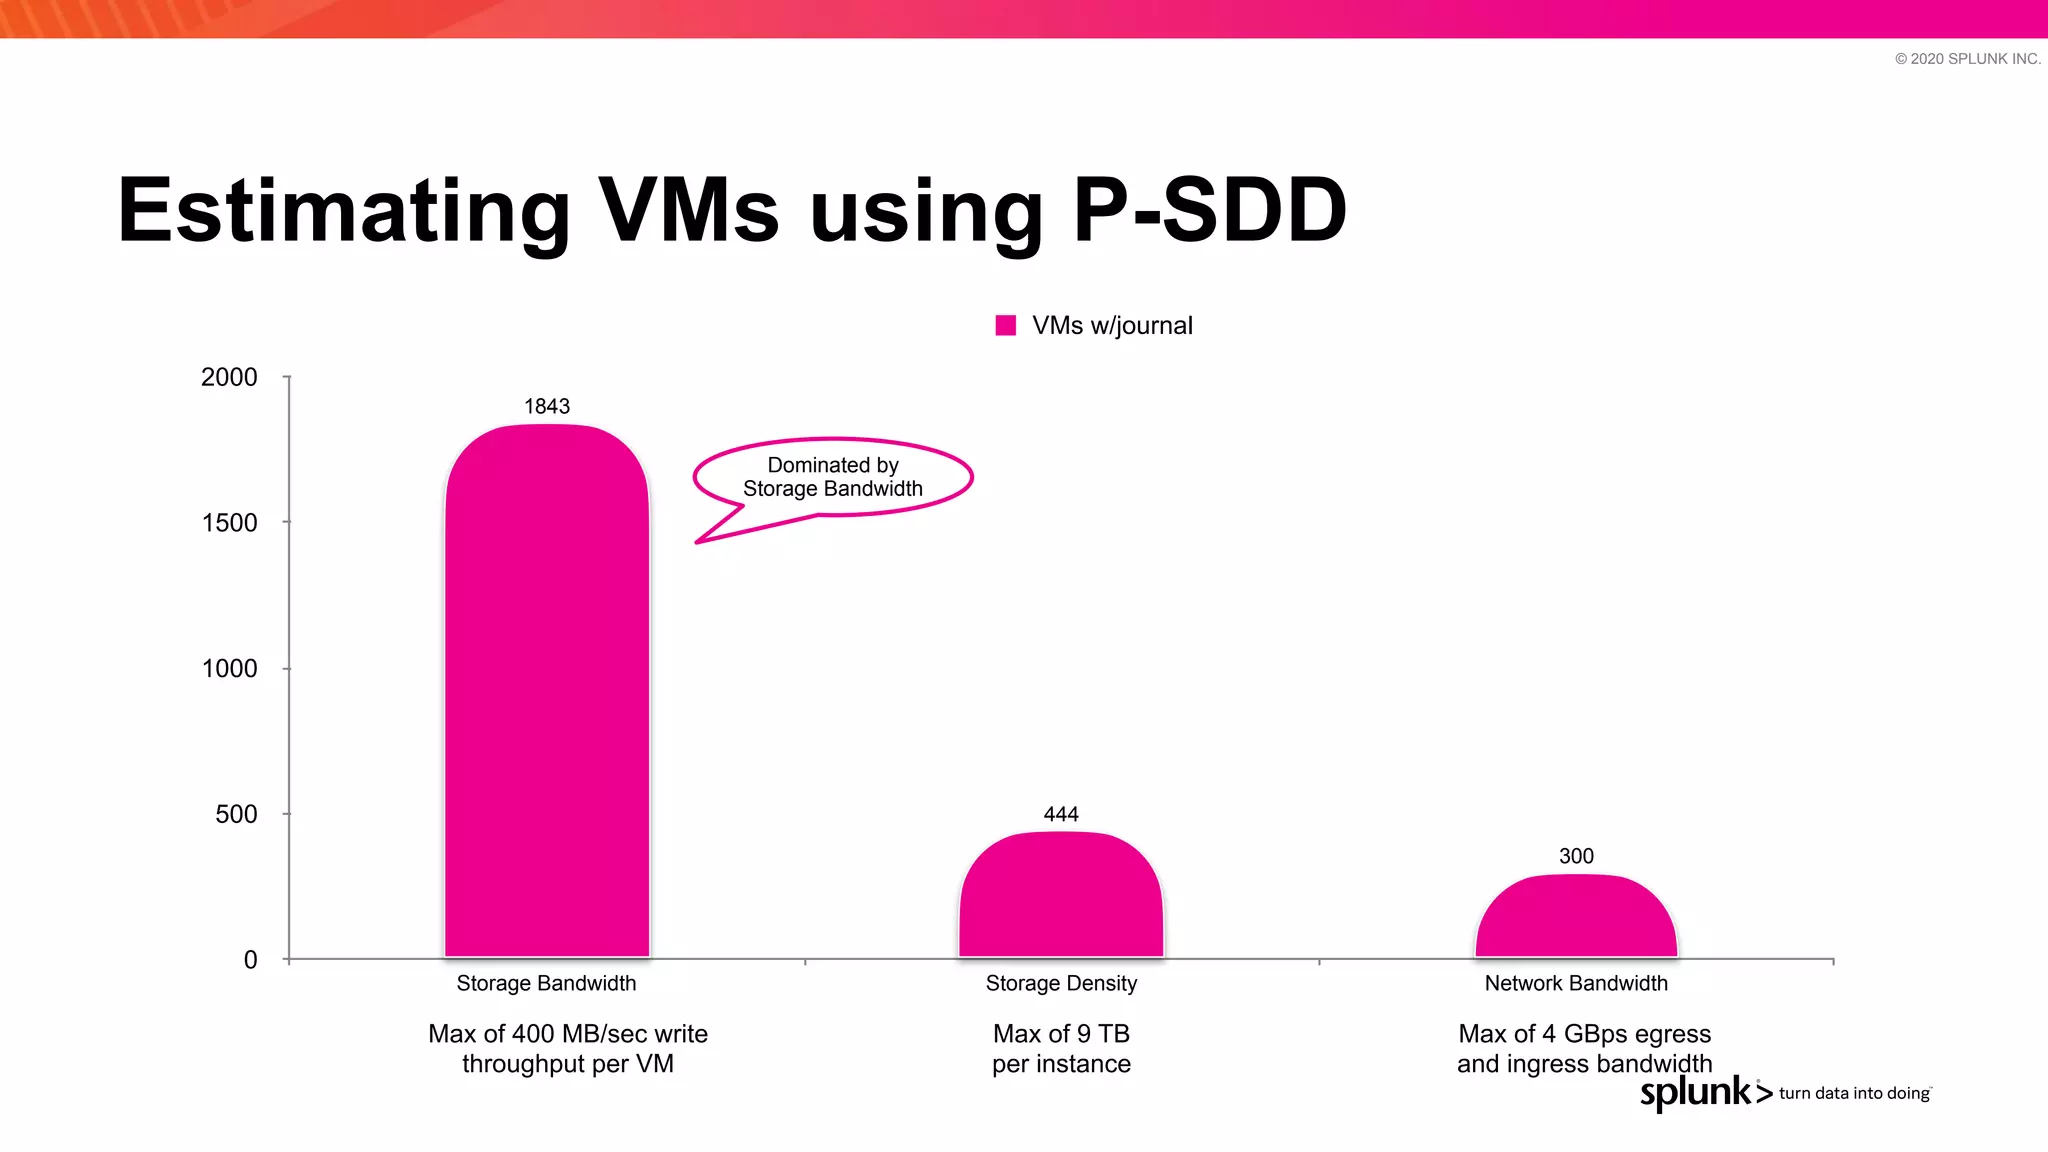
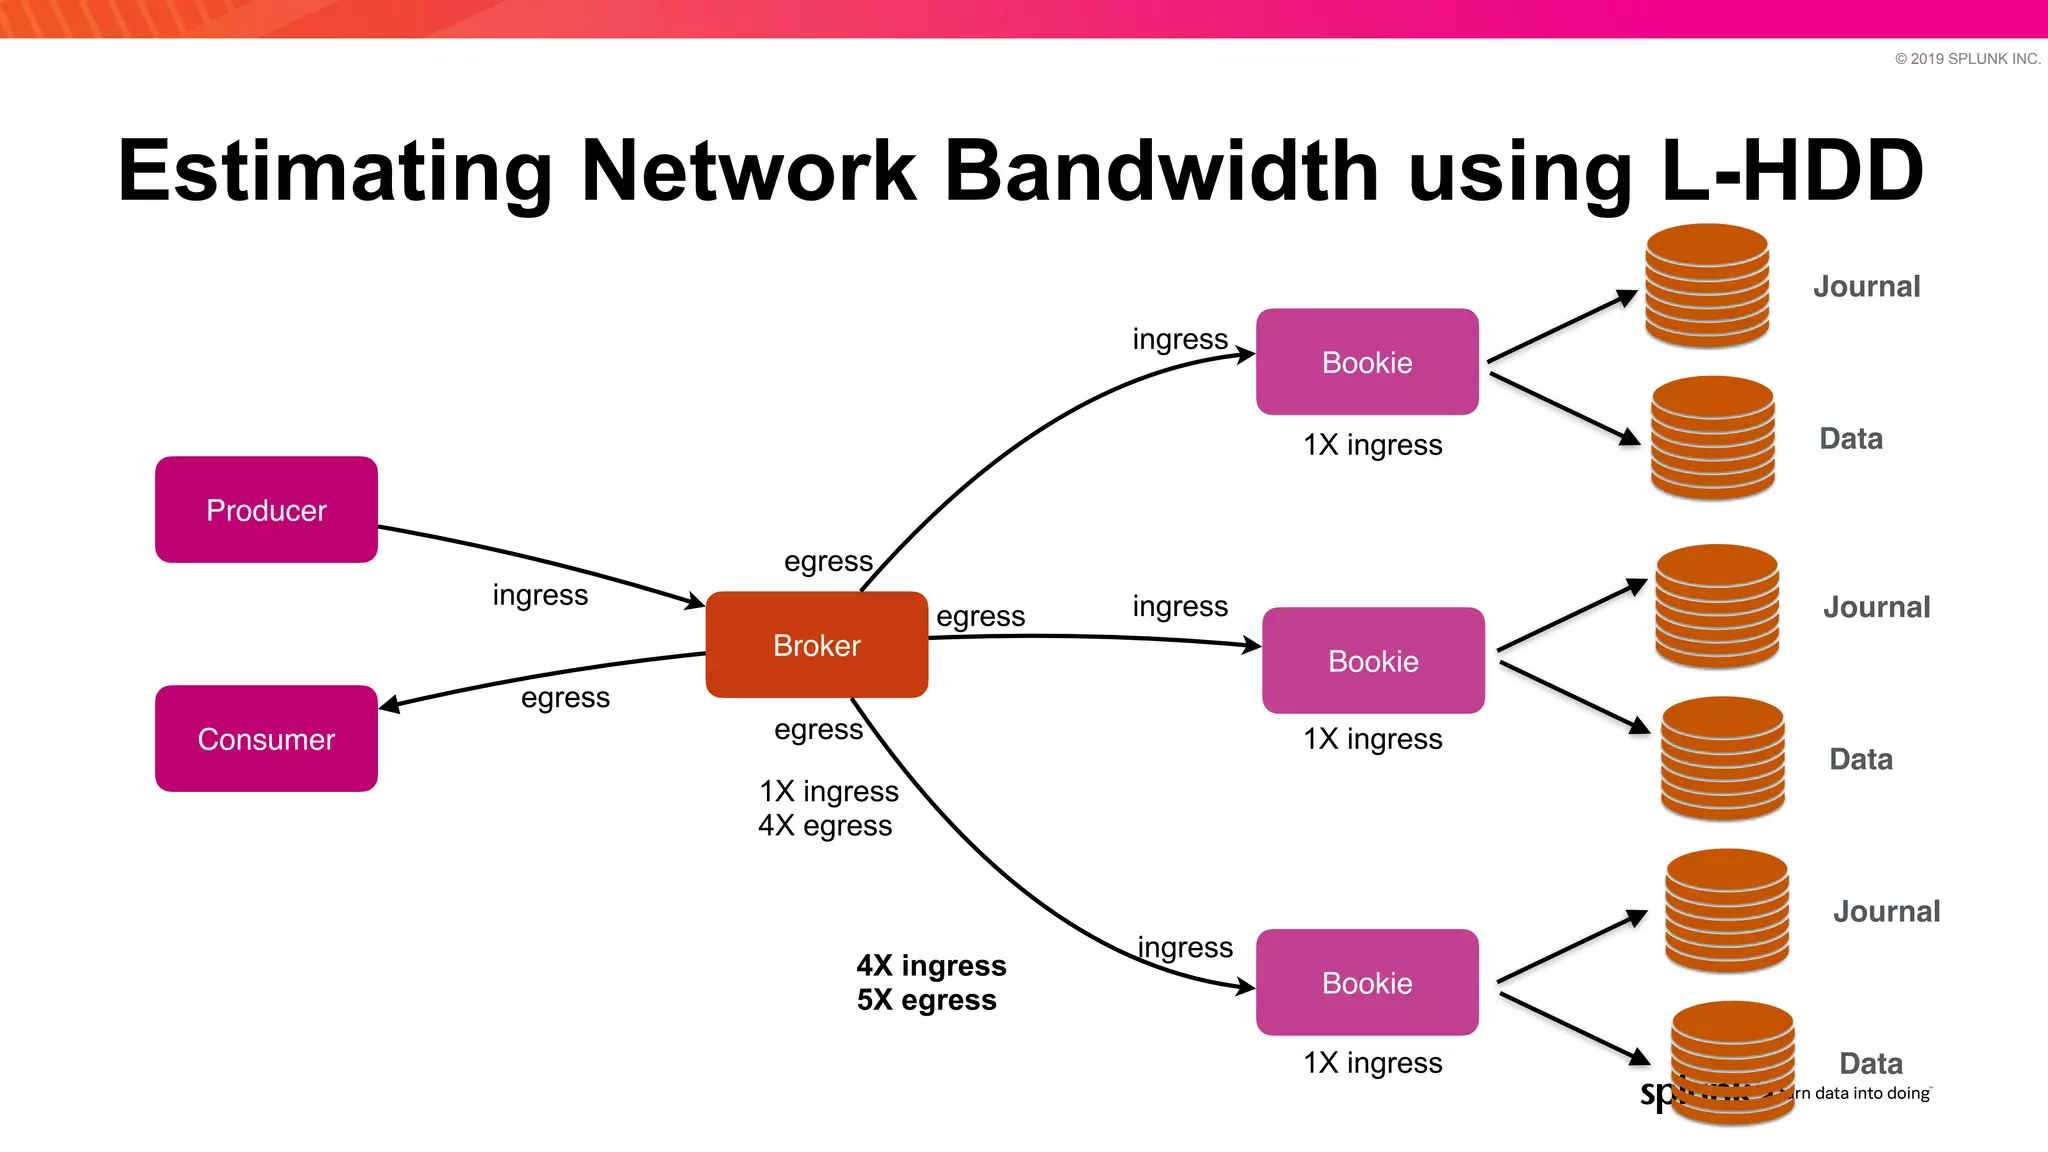
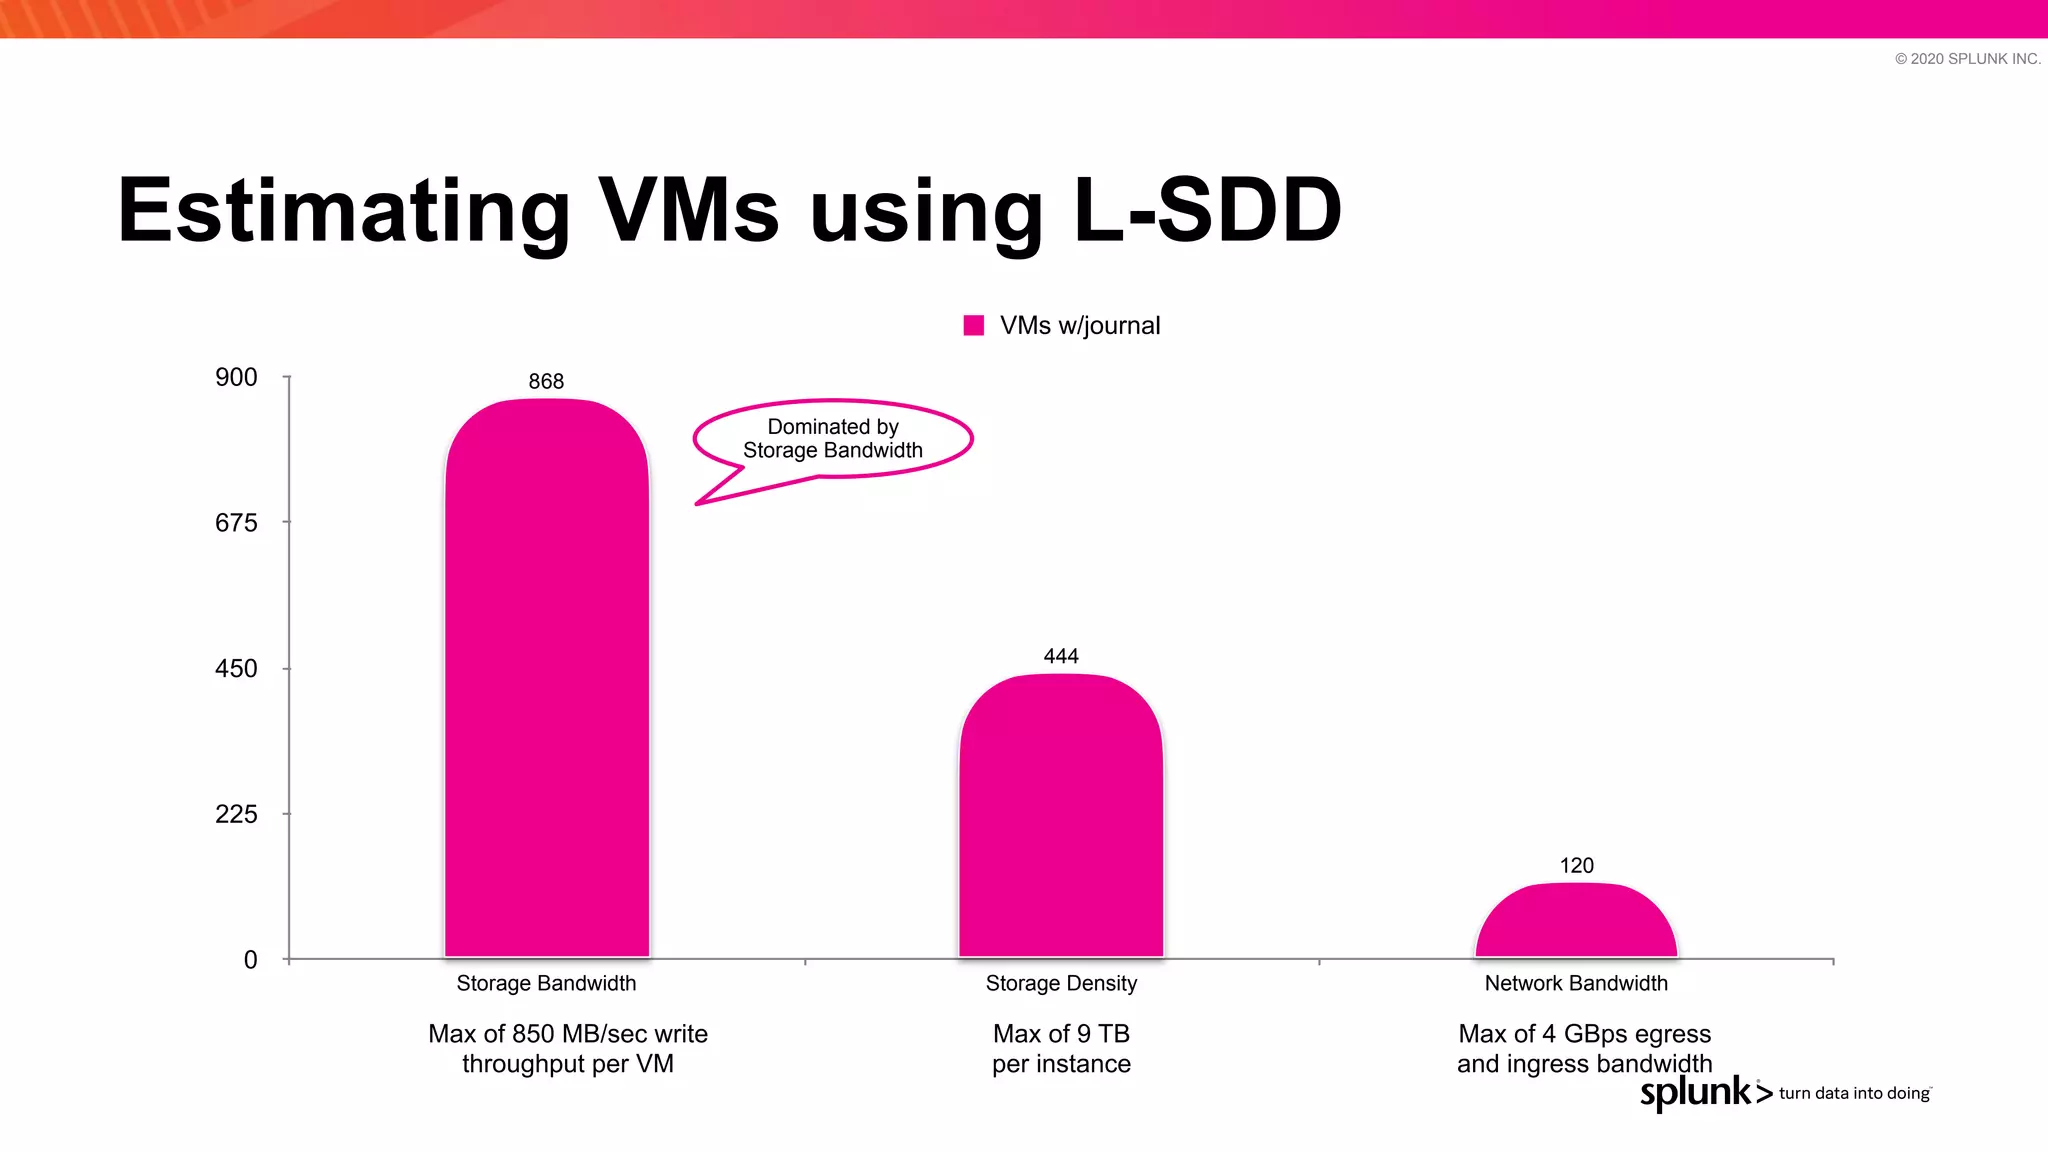
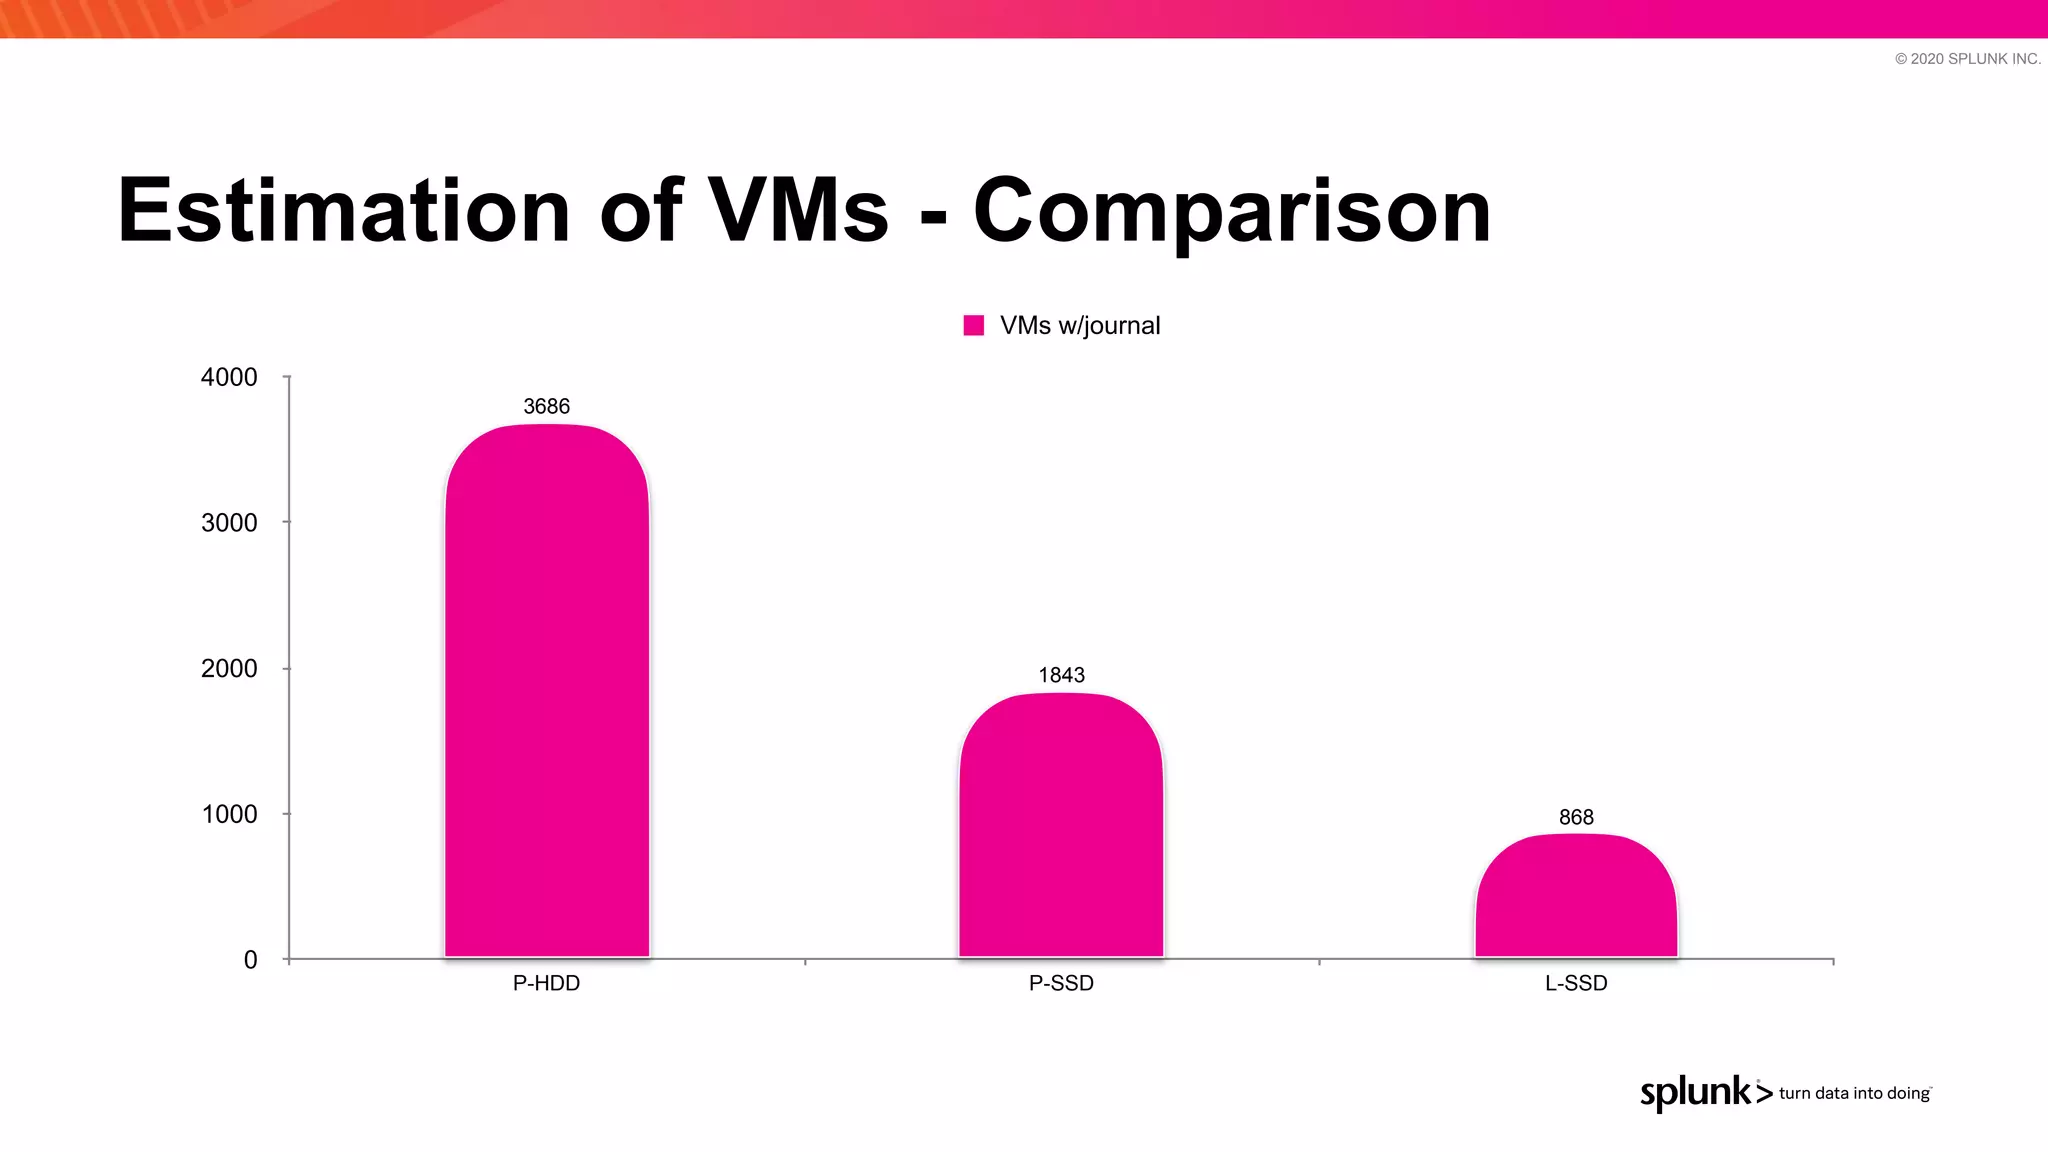

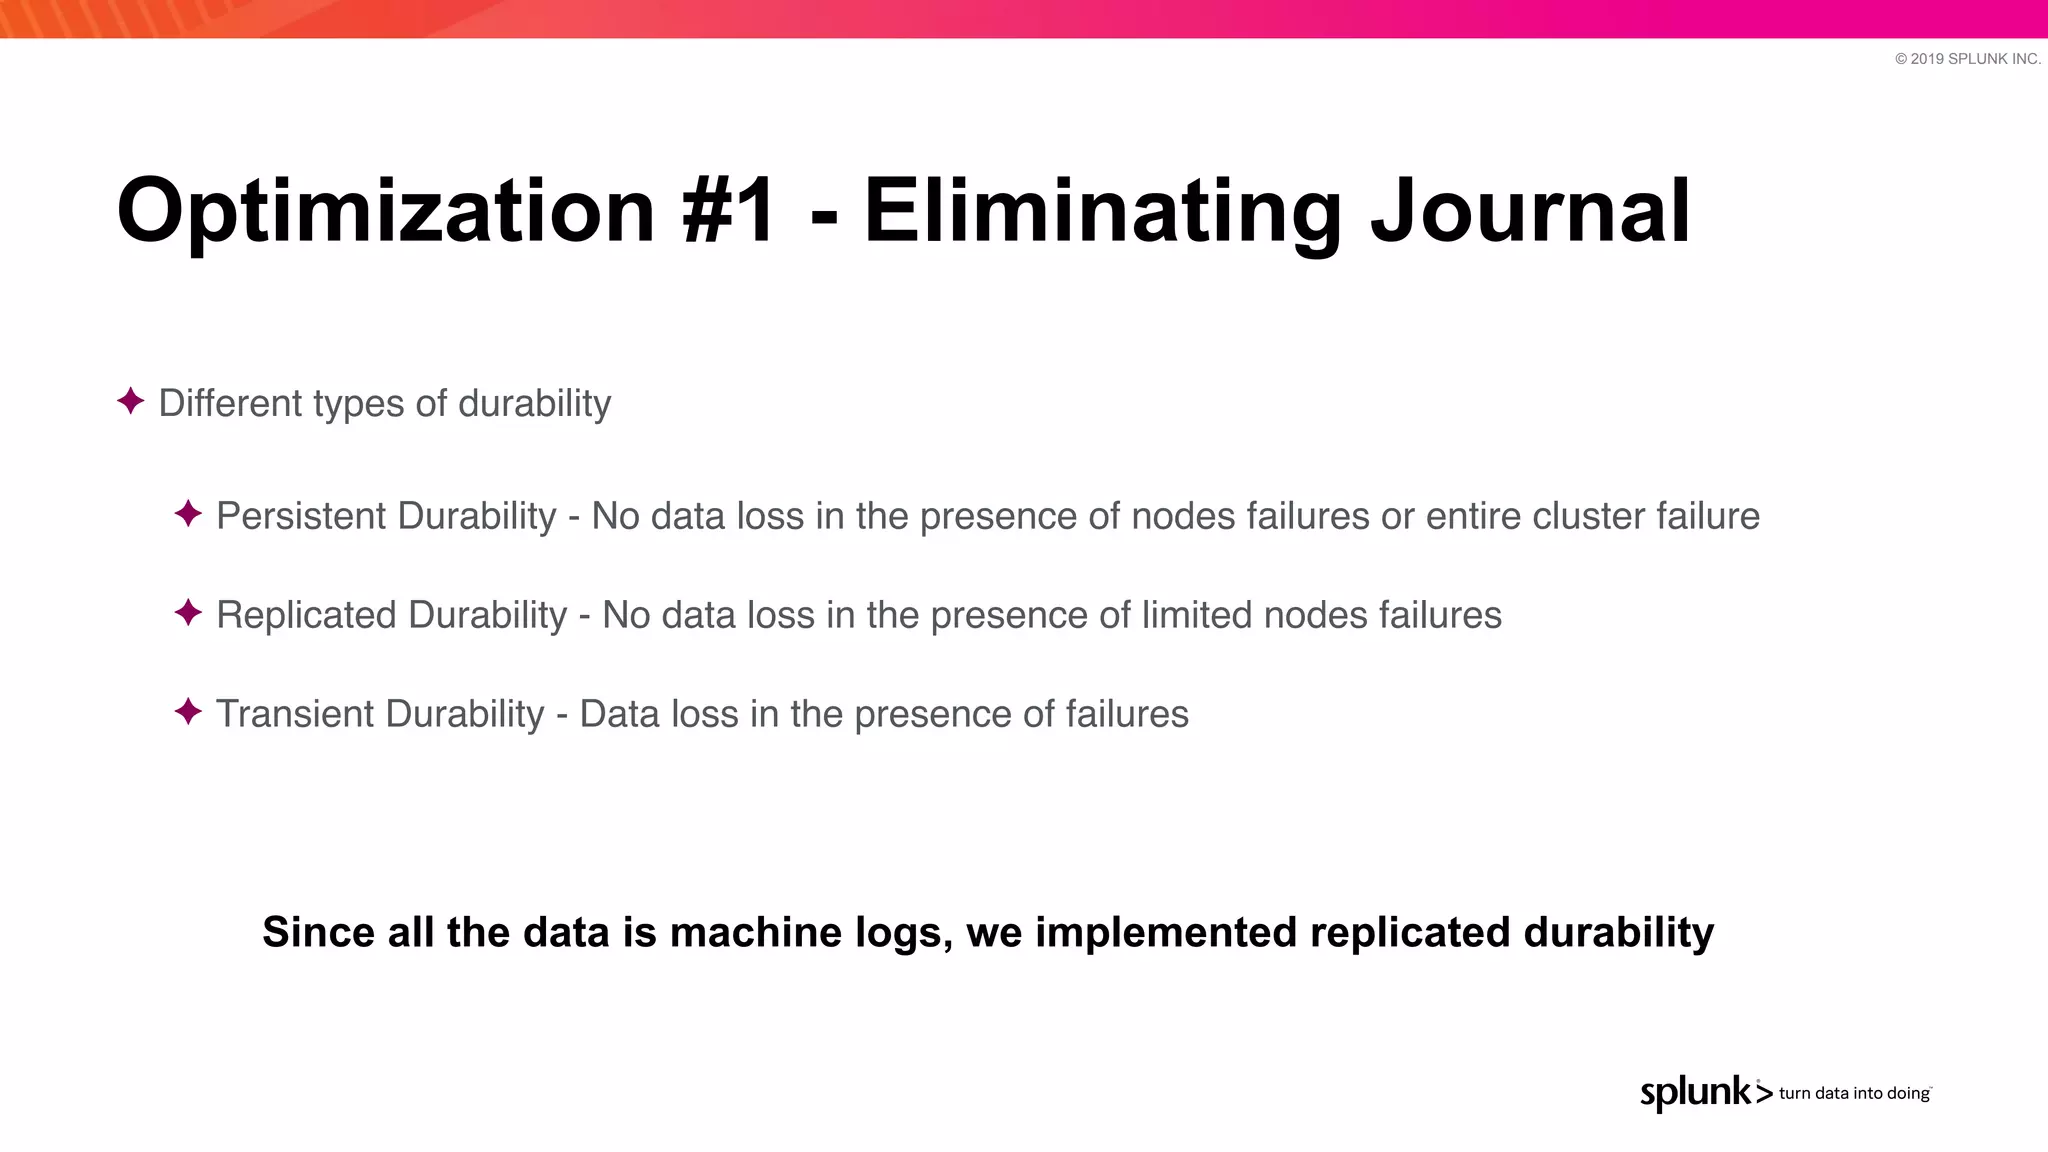
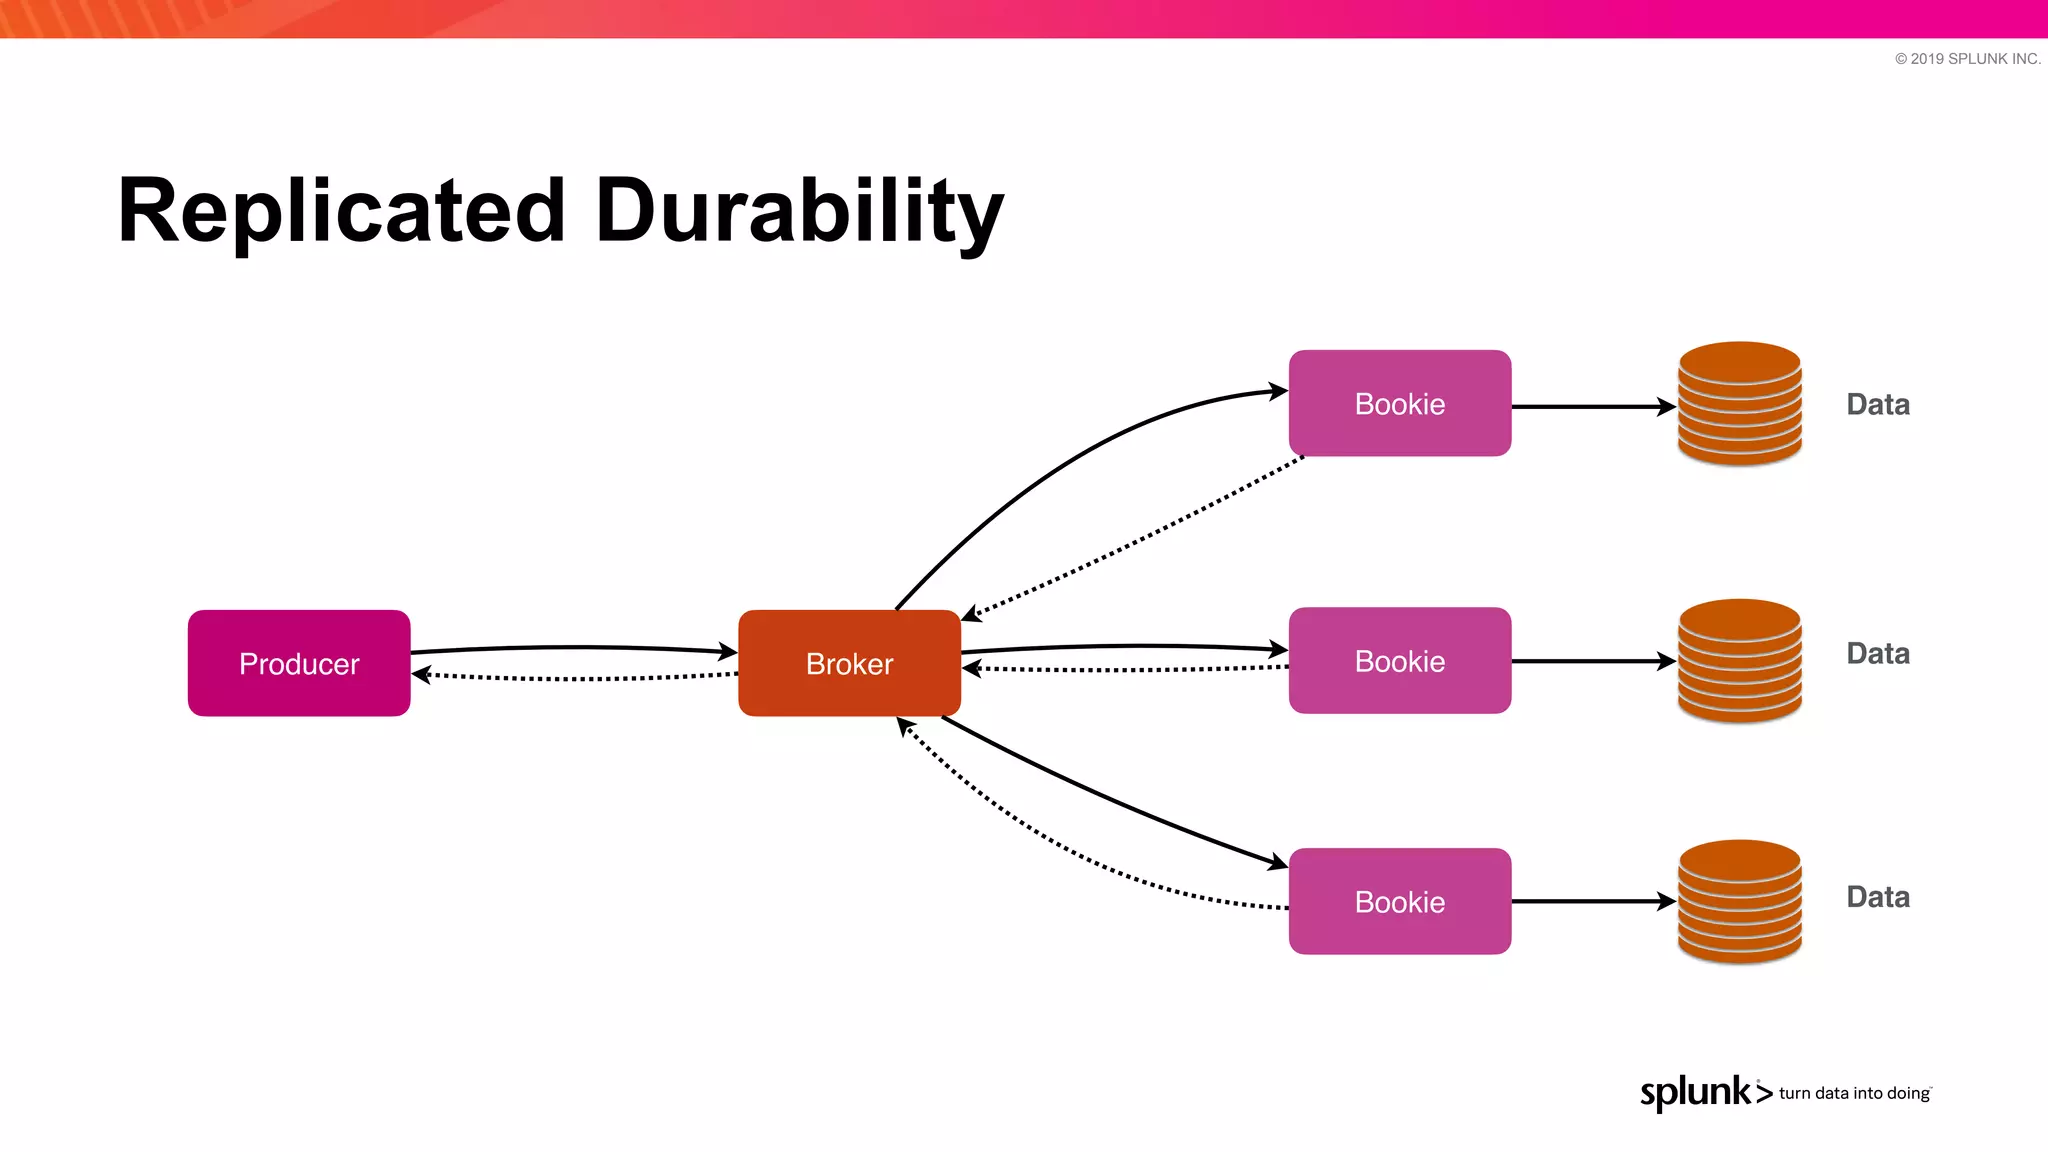
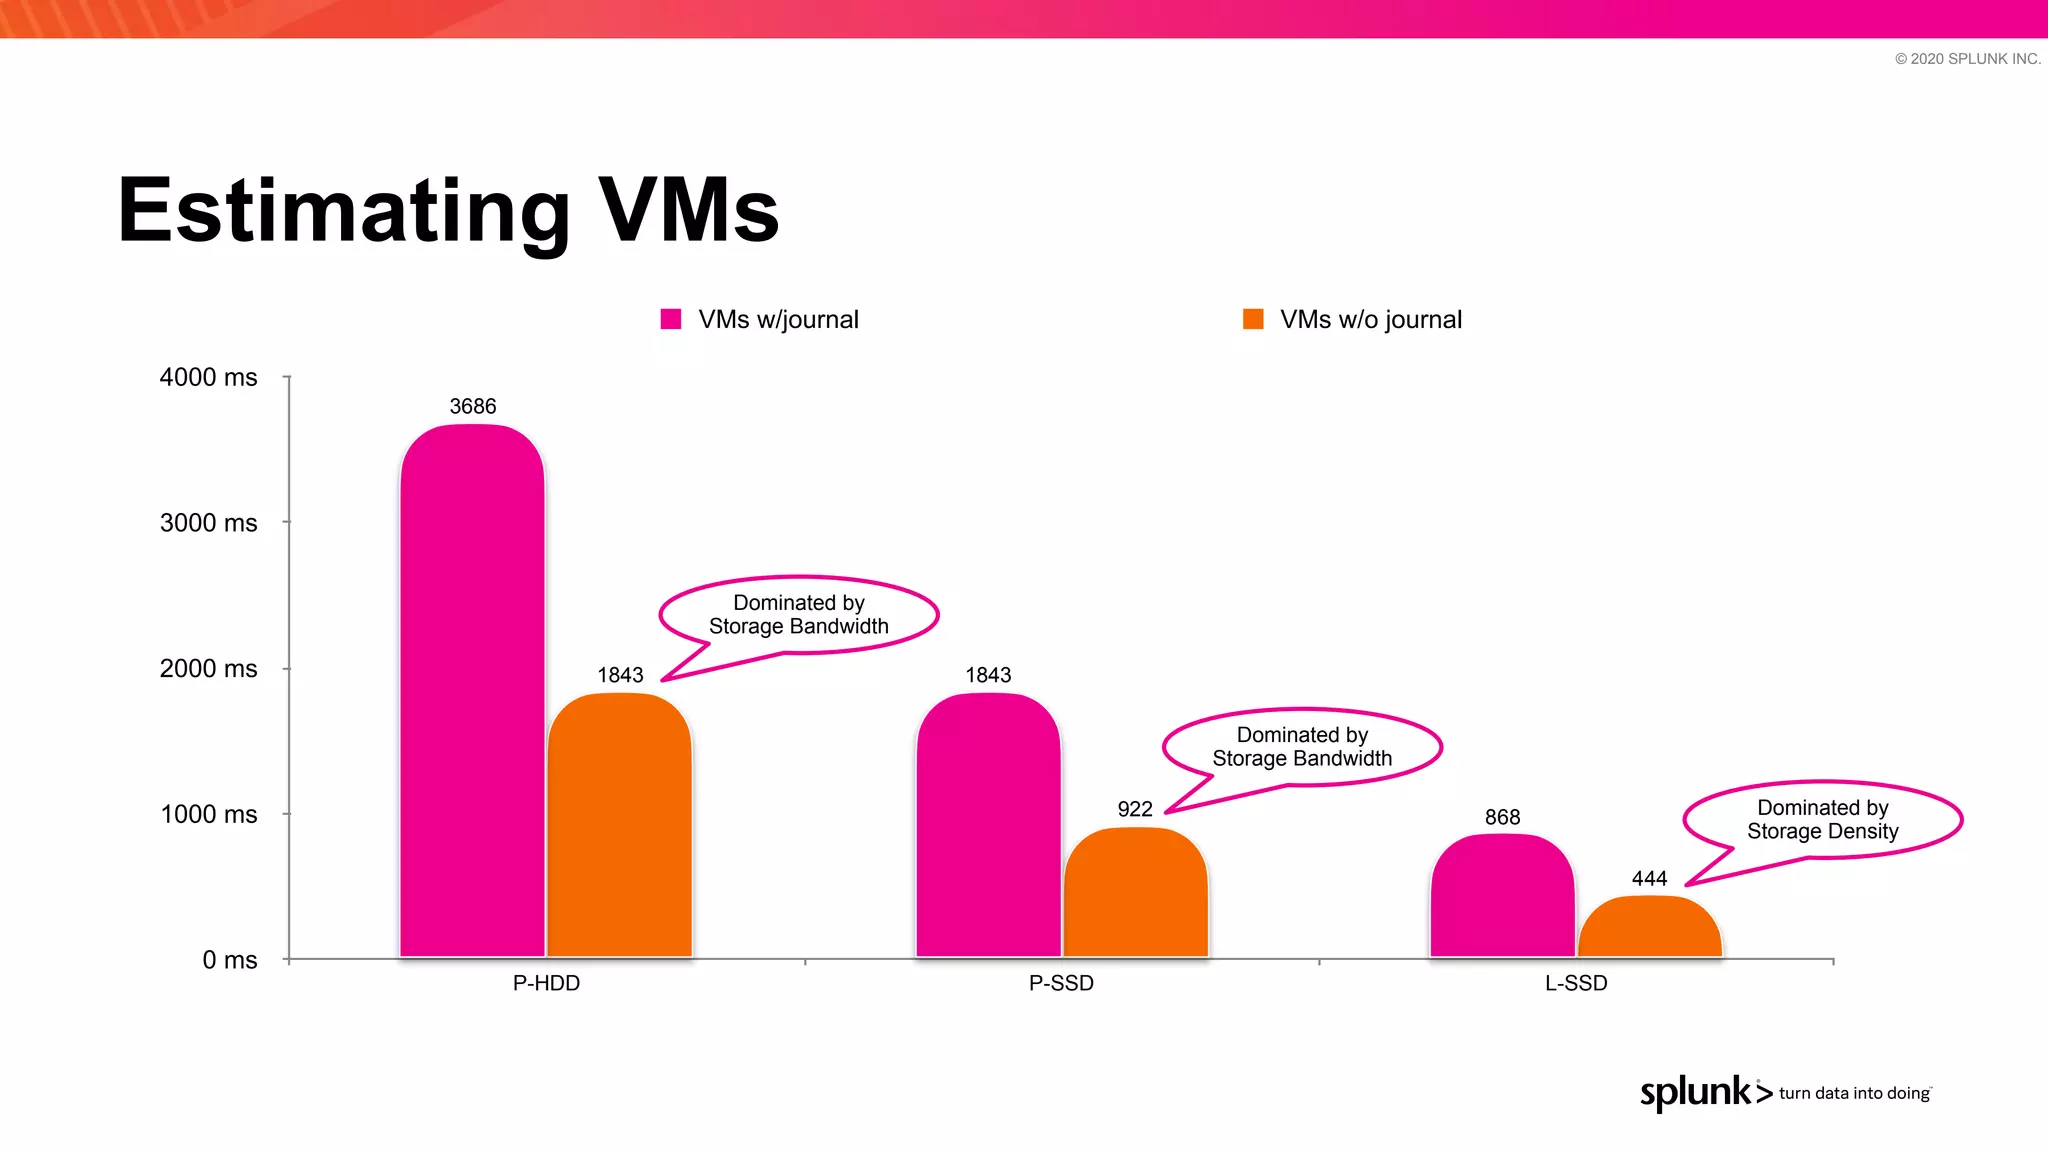
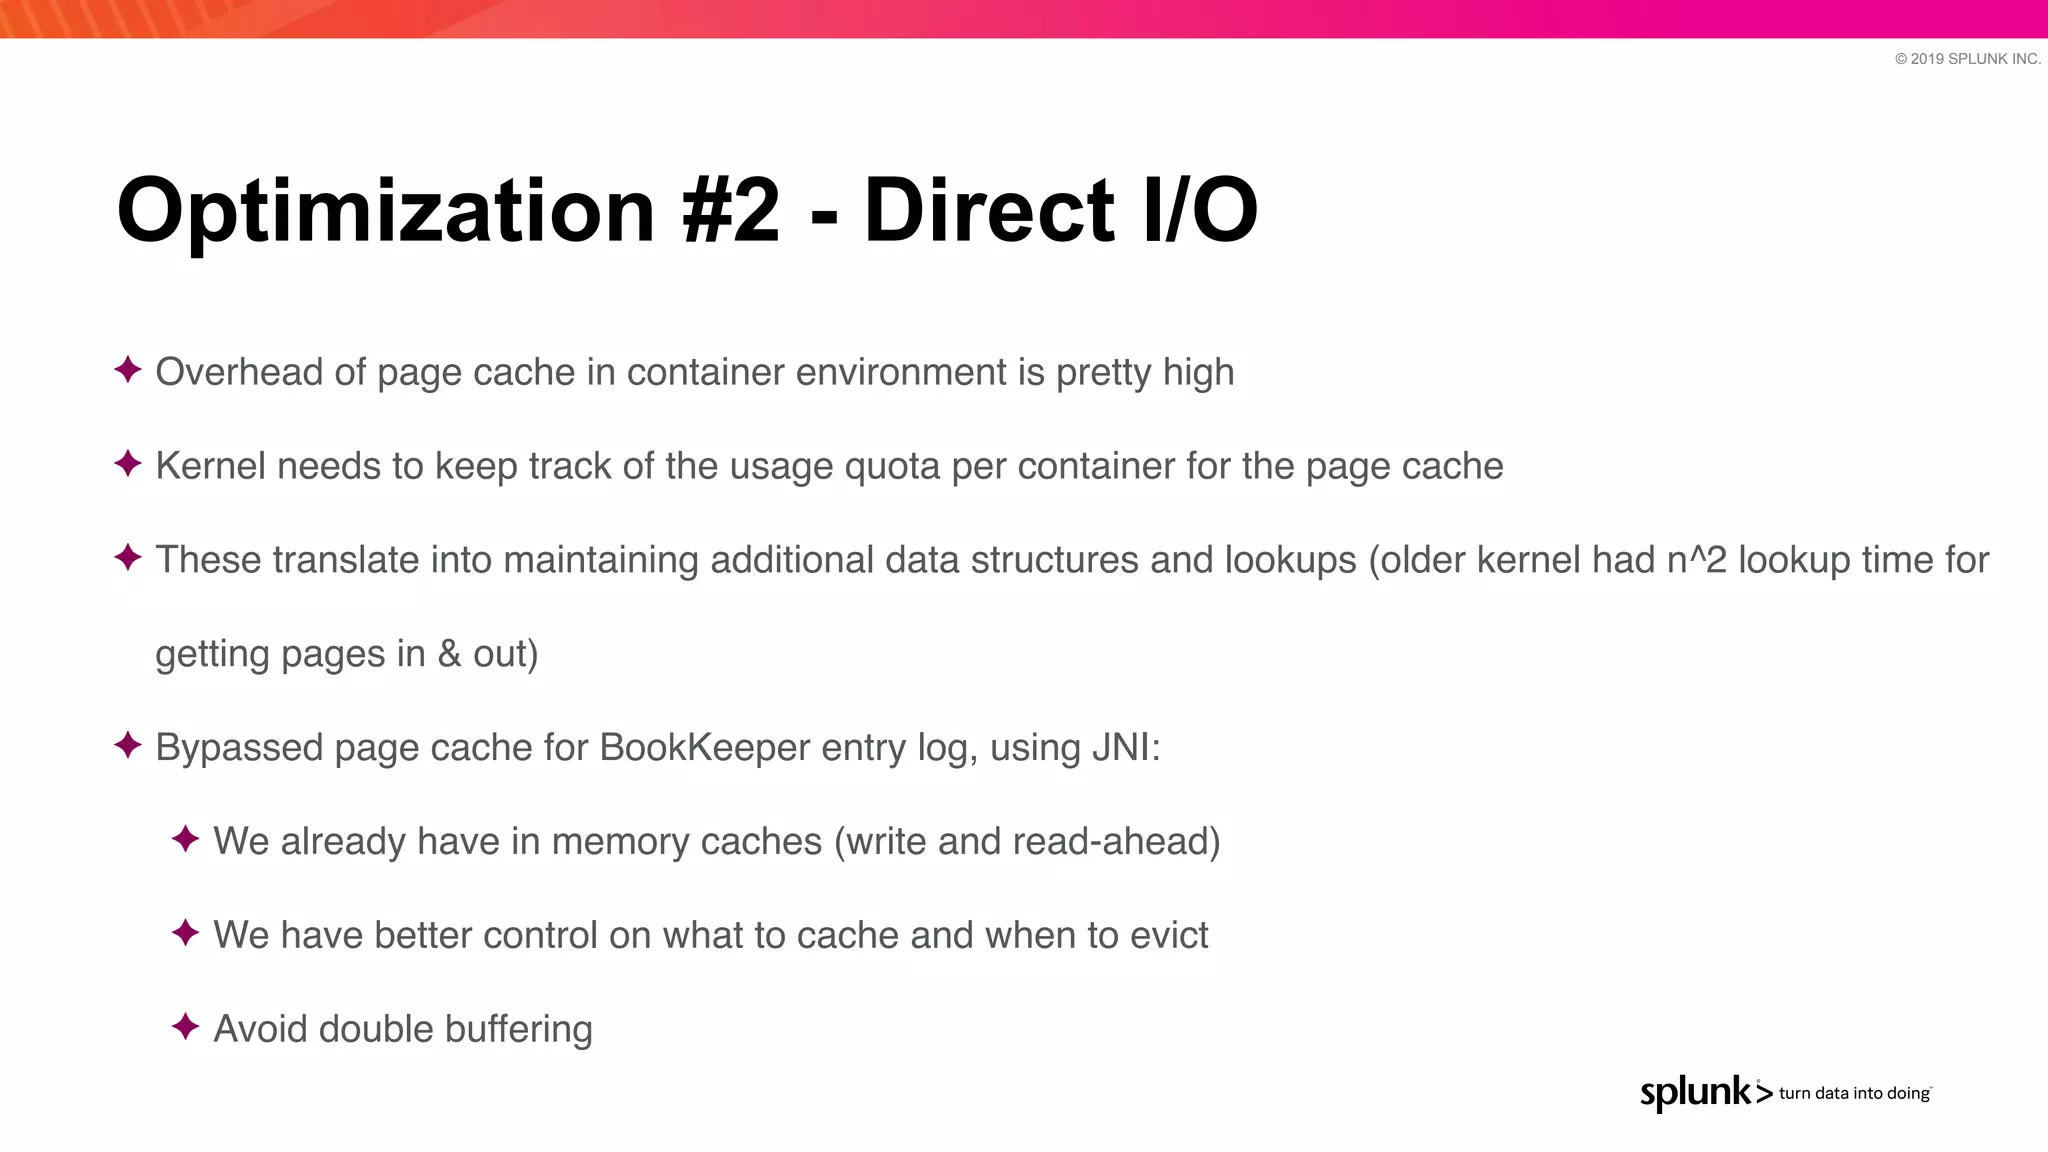
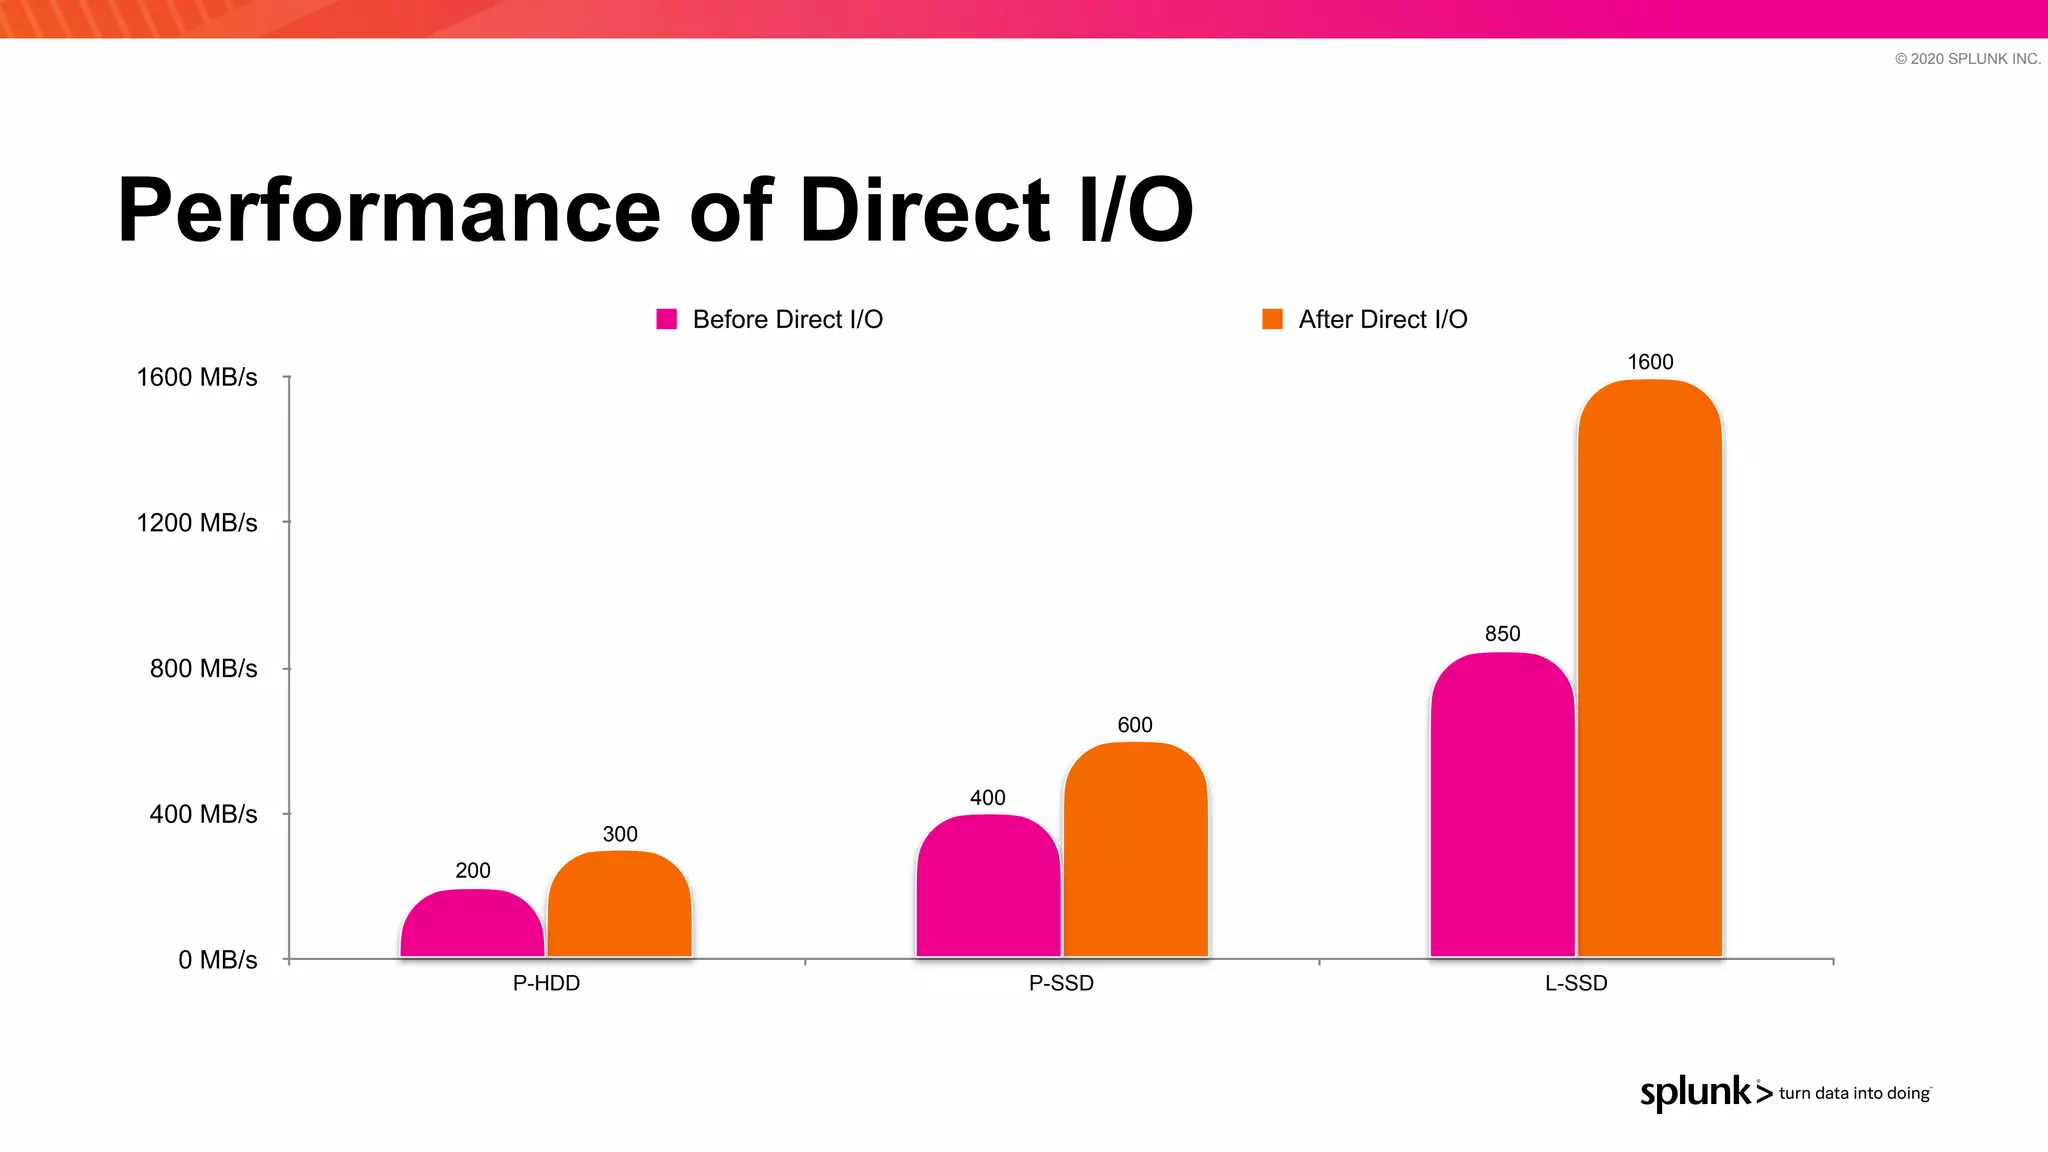
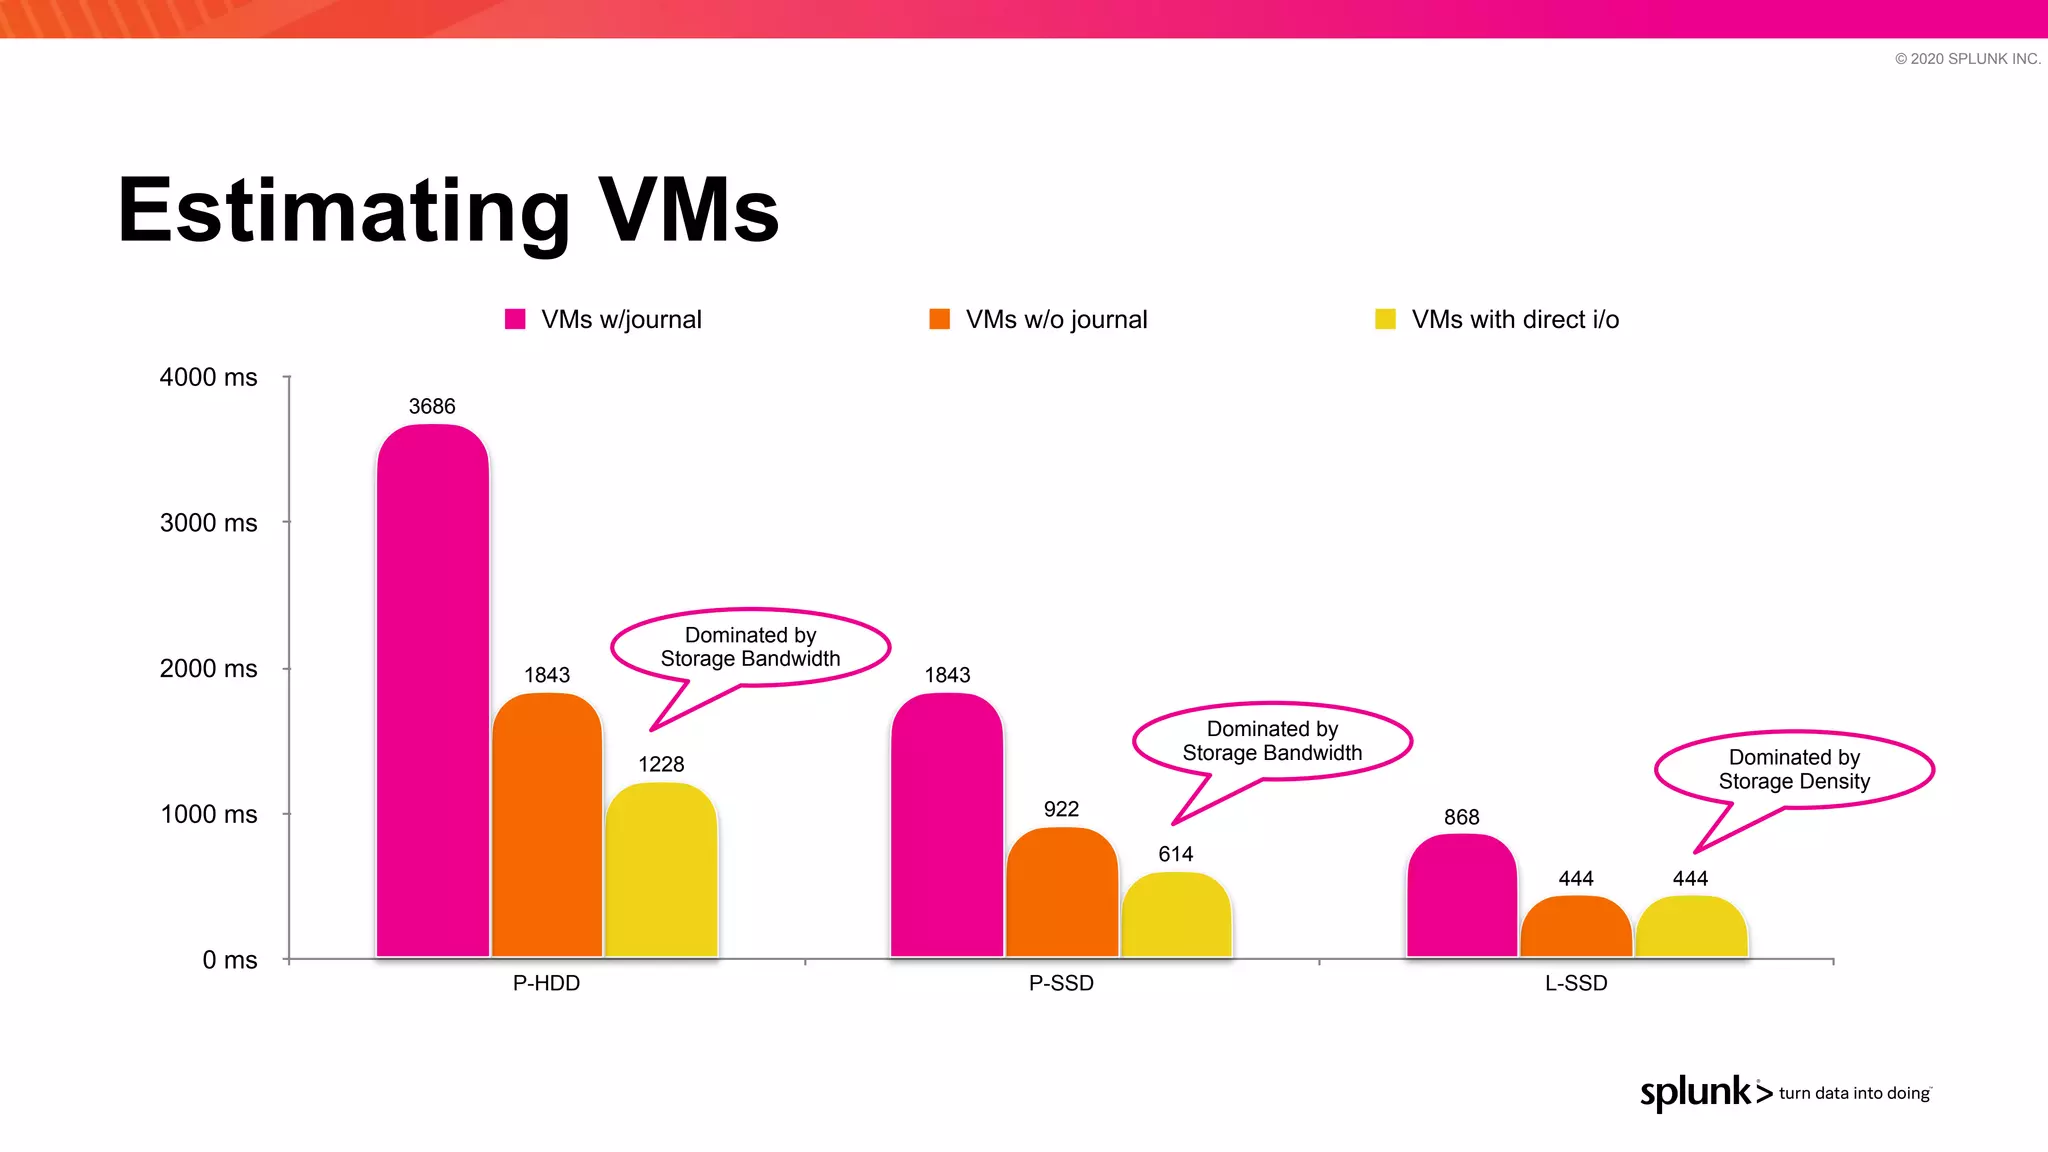
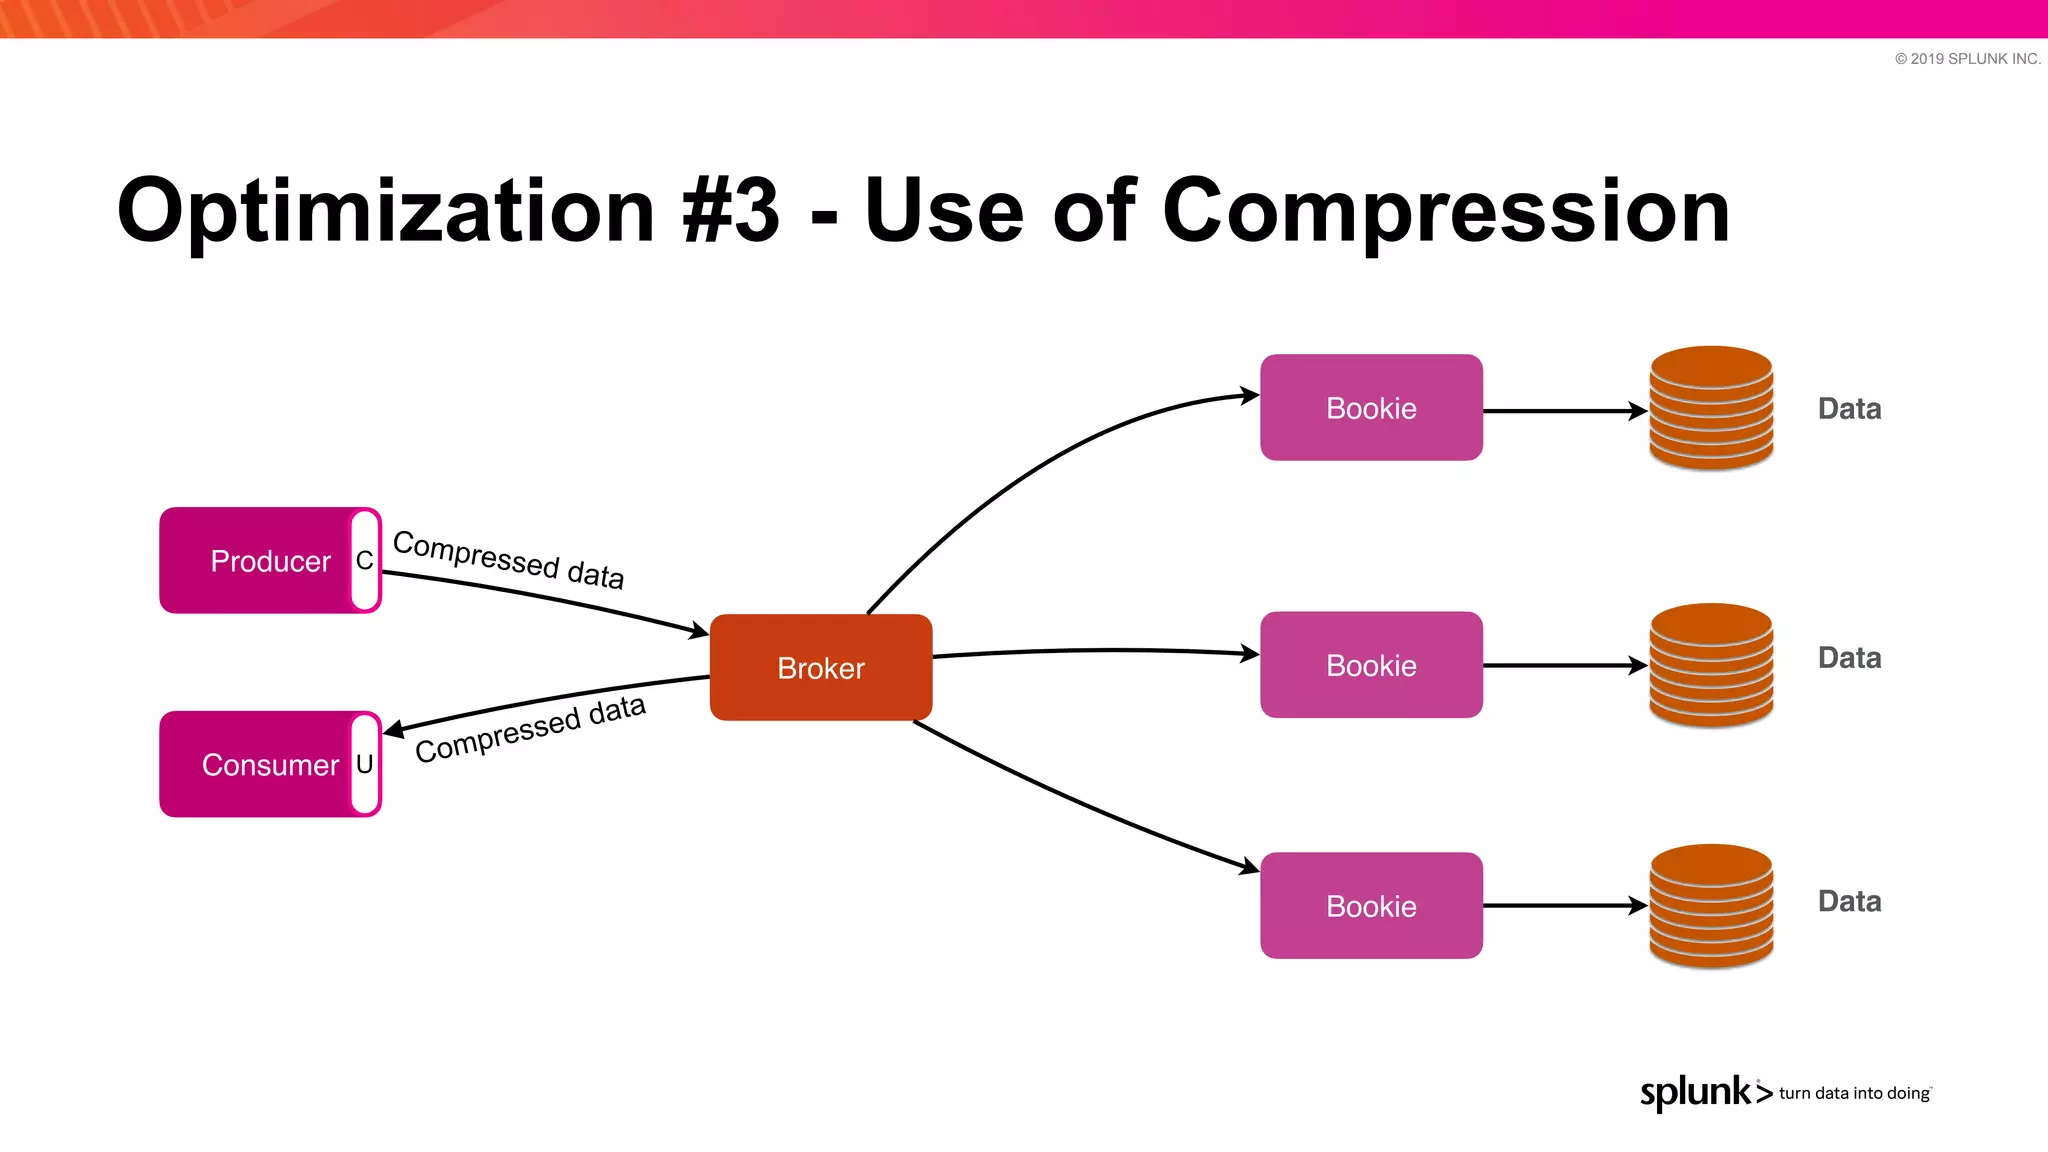
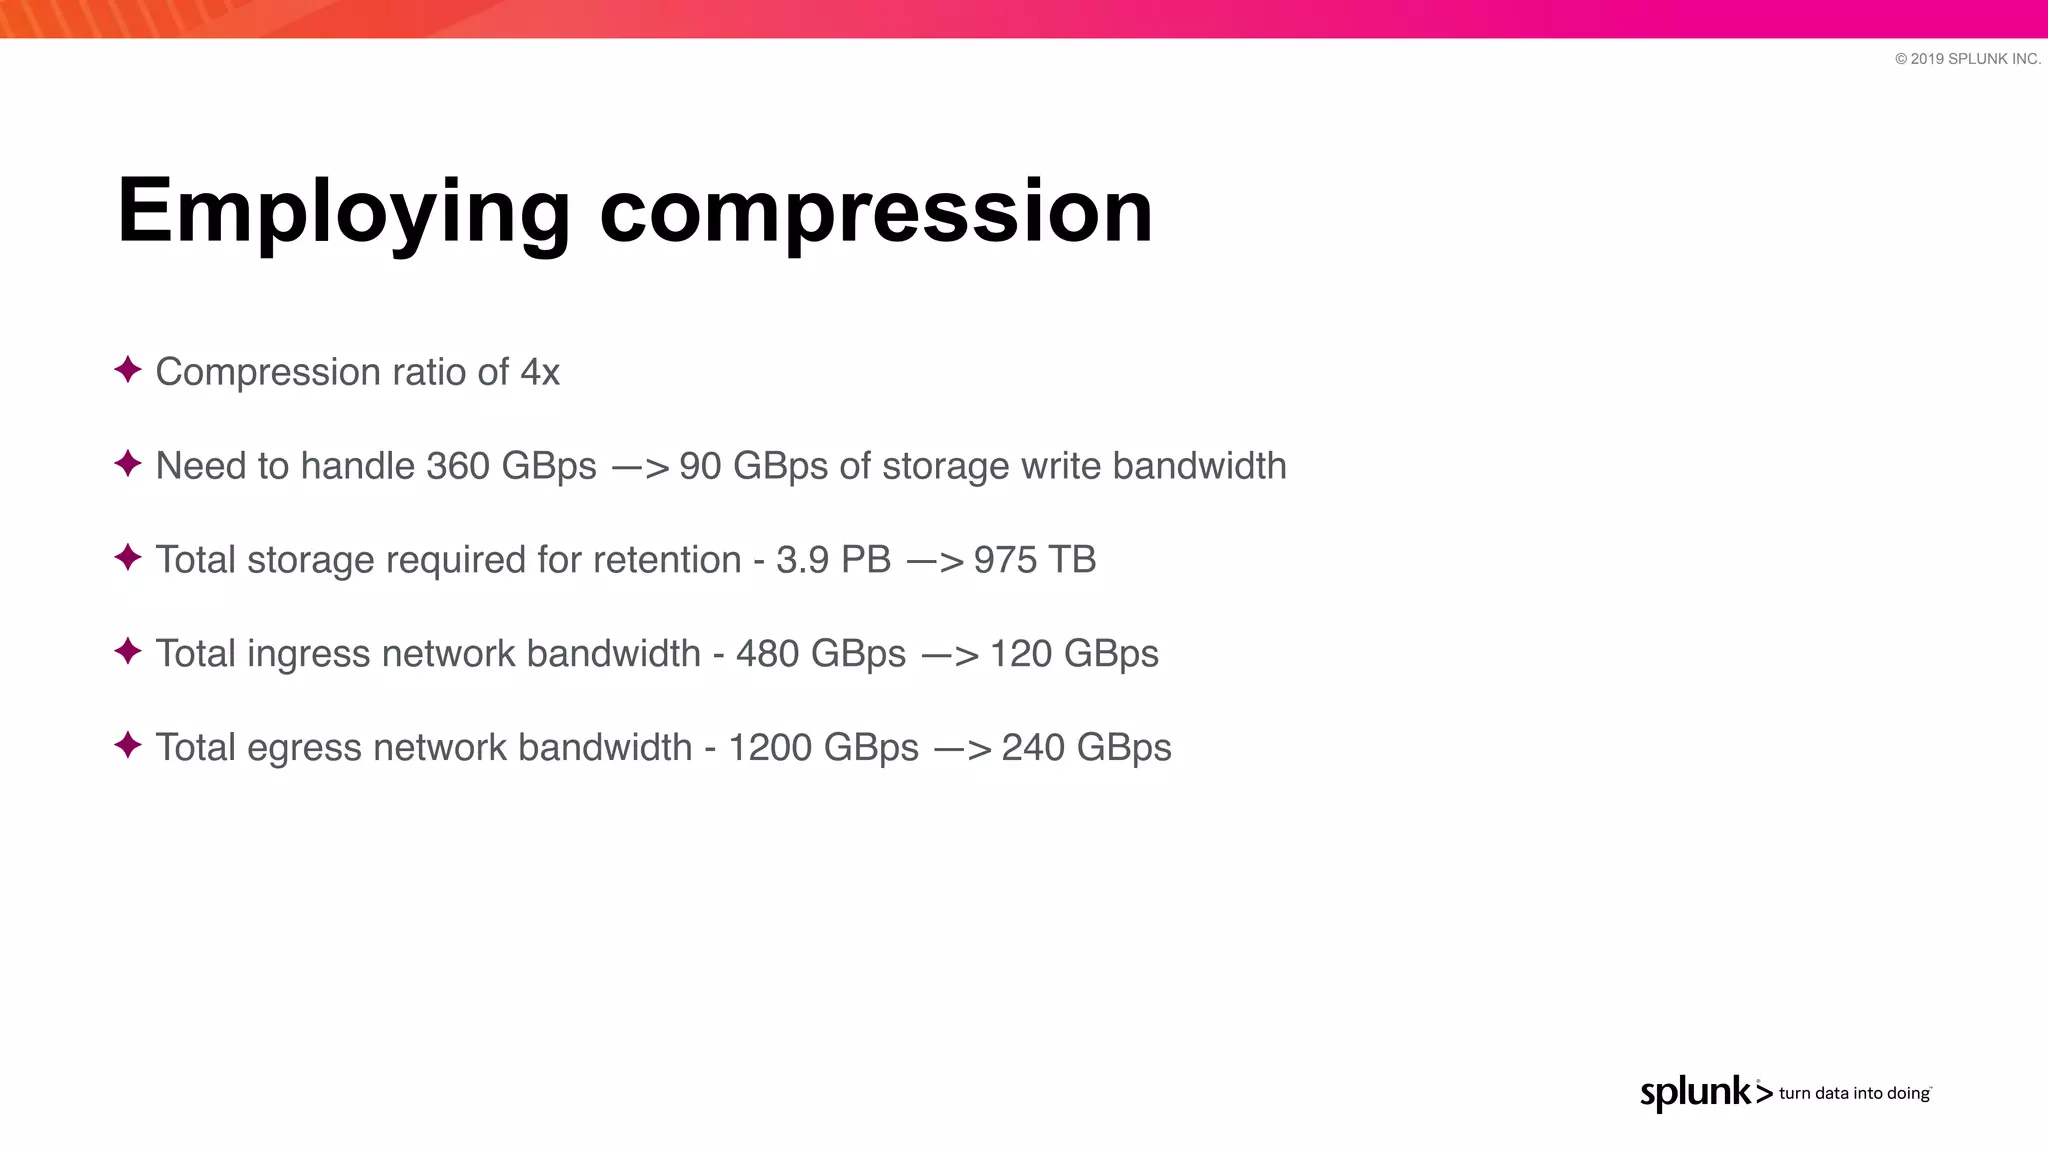
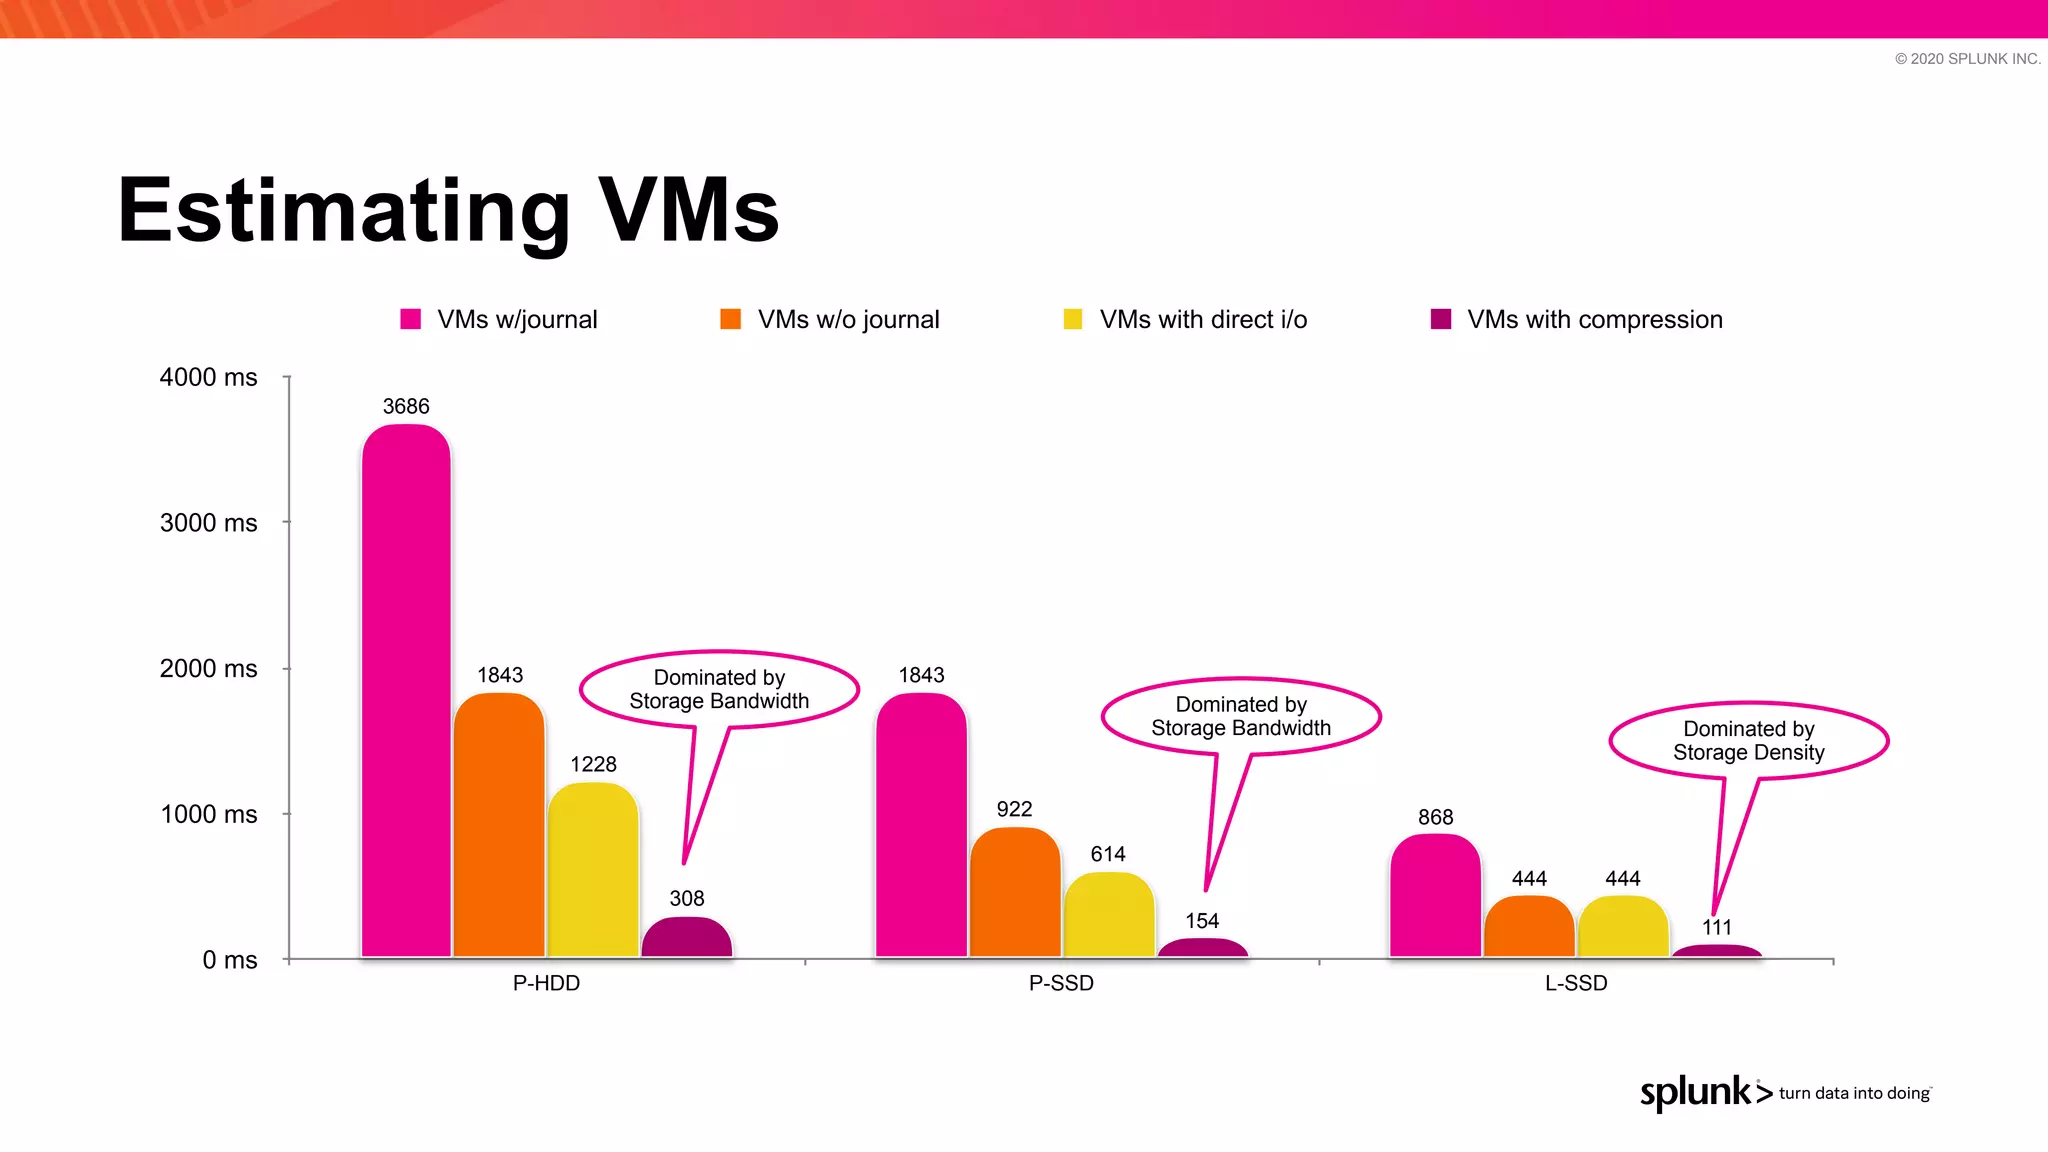
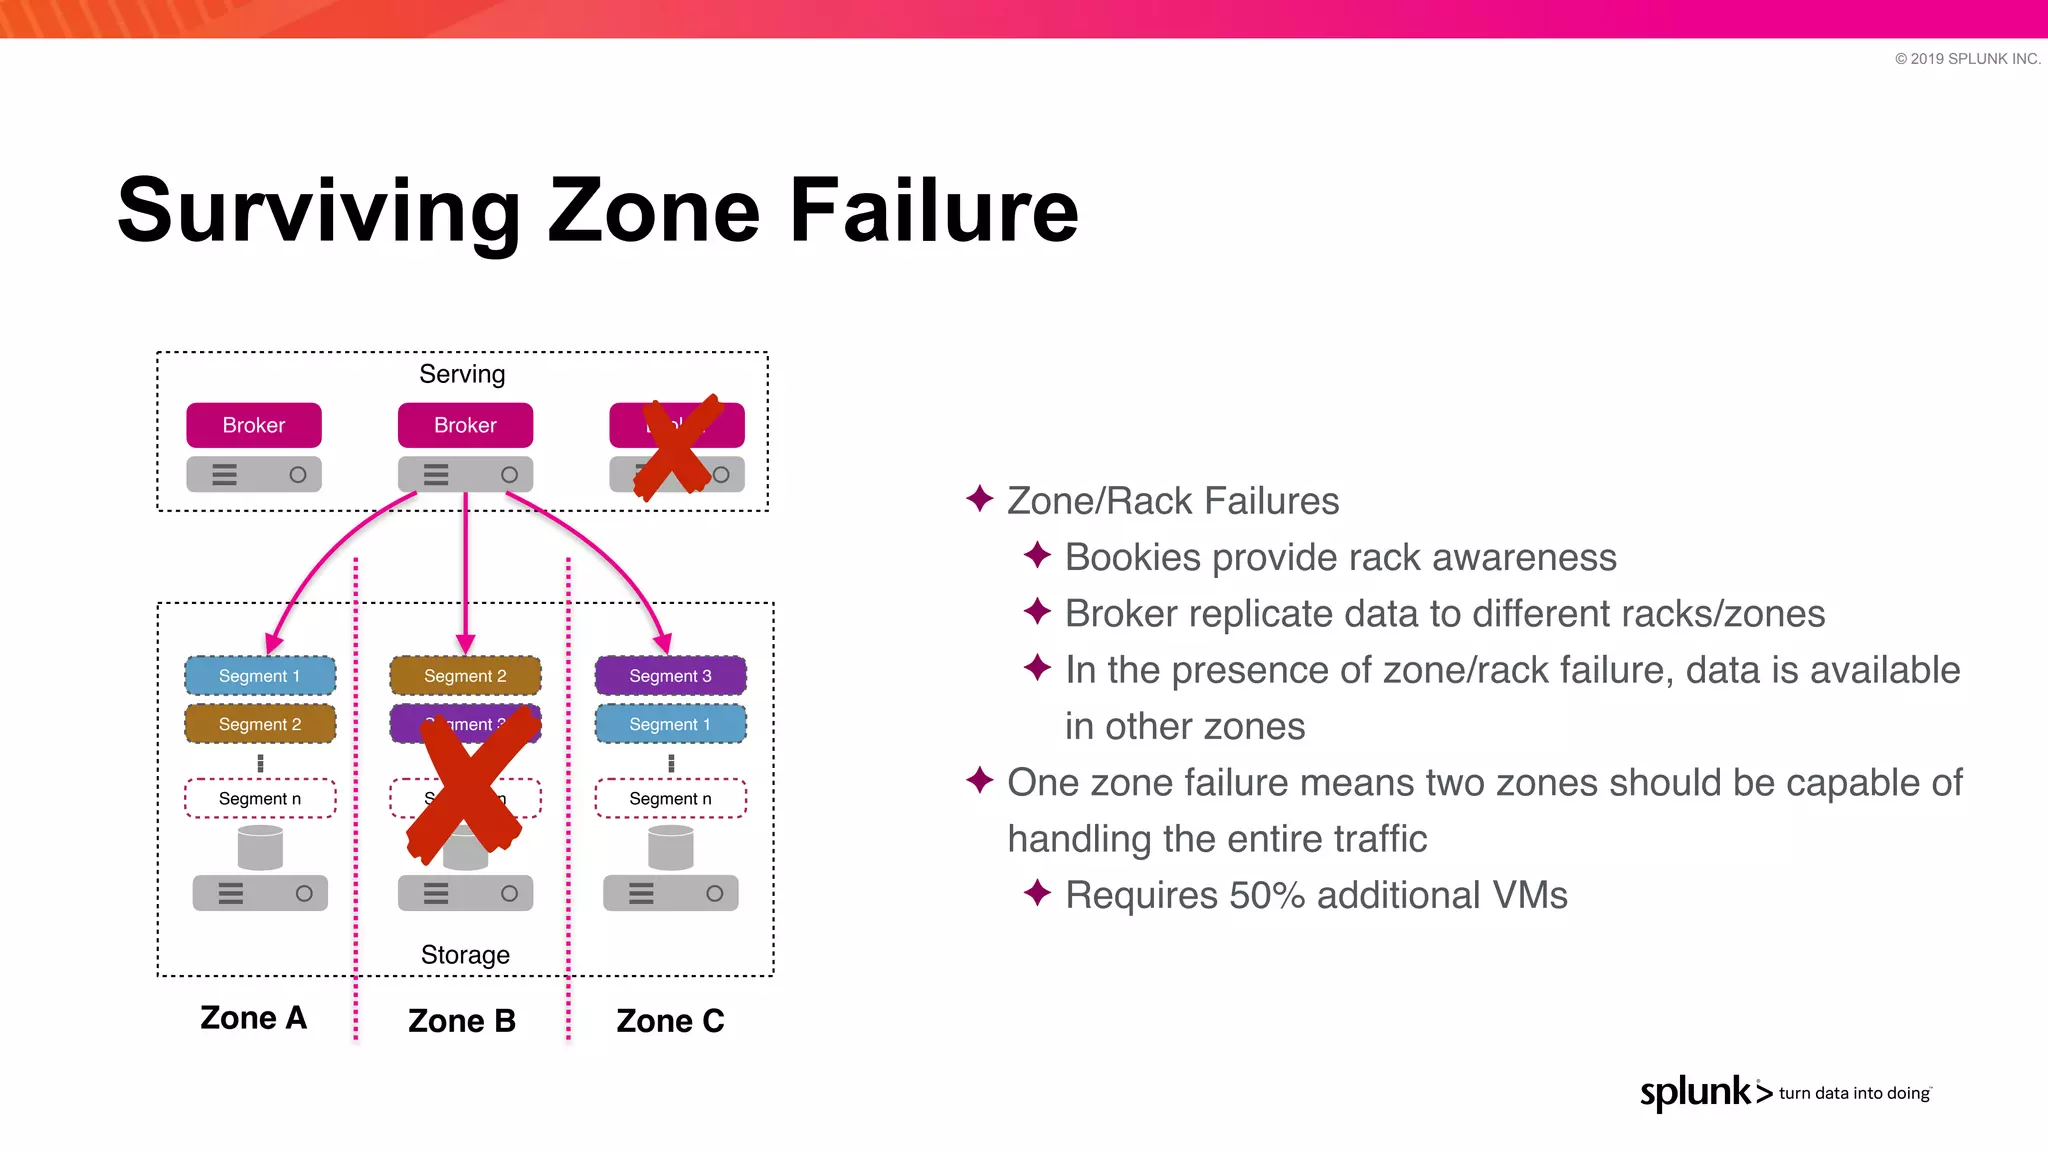
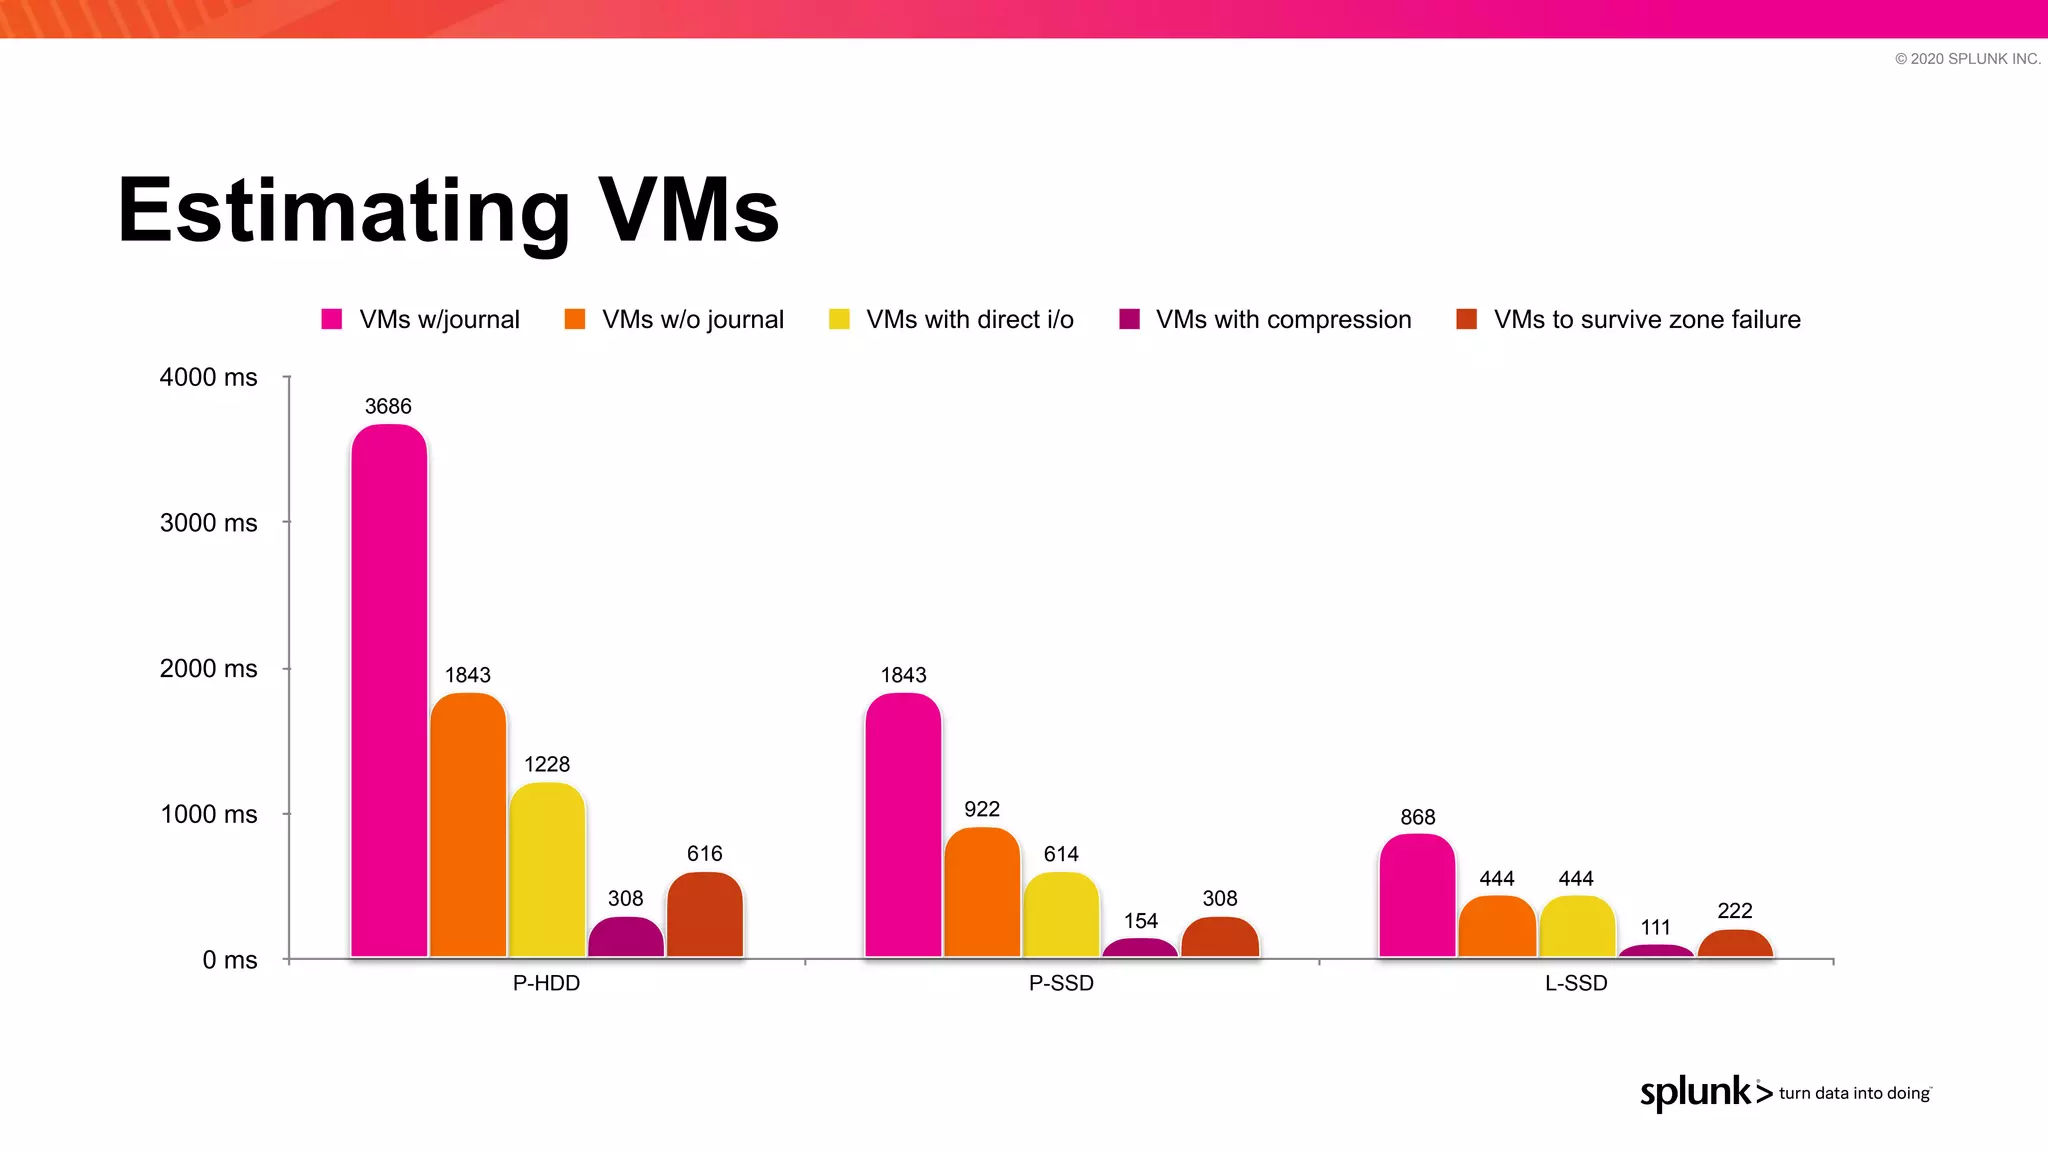


The document discusses optimizing an Apache Pulsar deployment to handle 10 PB of data per day for a large customer. It estimates the initial cluster size needed using different storage options in Google Cloud Platform. It then describes four optimizations made - eliminating the journal, using direct I/O, compression, and improving the C++ client - and recalculates the cluster size after each optimization. The optimized deployment uses 200 VMs each with 24 local SSDs to meet the requirements.