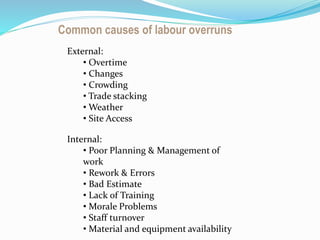
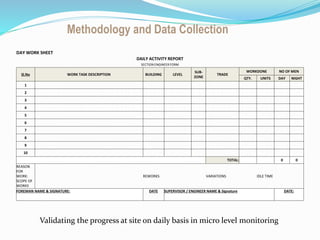
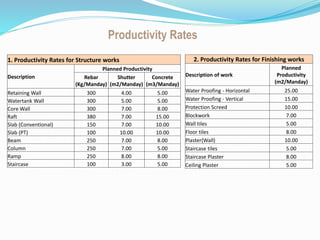
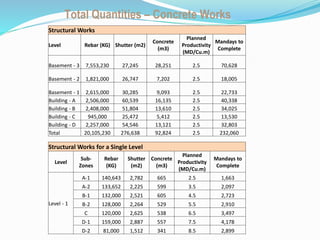
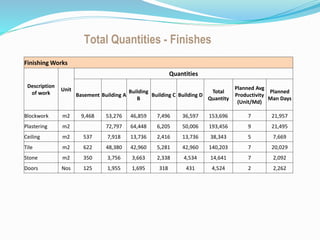
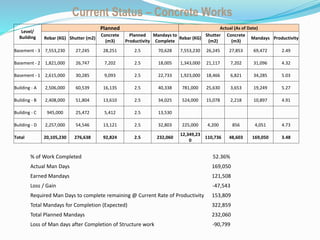
2. Building C Super
Sructure
Productivity
What is Labour Productivity?
Productivity = Output / Input
(Earned hours / Worked hours)
Examples:
• Kilograms of rebar fixed per manday
• Cu.m Concrete poured per manday
• Sq.m of formwork placed per manday
• Sq.m of block laid per manday
• Sq.m of tiles laid per manday
3. Building C Super
Sructure
Why Measure Productivity?
• You Can’t Correct a problem if you don’t know it exists
• By the time the job is over, you have lost the more
• You will have current information to manage and control
your project
• You should correct losses arising from internal problems
• You may be able to recover losses arising from external
causes.
•Extremely vital performance measurement tool within the
construction industry
•Productivity growth is important to an individual
enterprise, an industry or an economy
4. Building C Super
Sructure
Common causes of labour overruns
External:
• Overtime
• Changes
• Crowding
• Trade stacking
• Weather
• Site Access
Internal:
• Poor Planning & Management of
work
• Rework & Errors
• Bad Estimate
• Lack of Training
• Morale Problems
• Staff turnover
• Material and equipment availability
5. Building C Super
Sructure
Themes for Productivity Improvement
• Consistent Practices
• Process versus Results Management
• Consistent Procedures and Practices
• Proactive versus Reactive Management
• Measurement and Analysis of a defect
• Risk or Variation Analysis
• Vital Few versus Useful Many
• Planning Versus Reacting
• Focus on Quality first
• Pride and a Positive Attitude
6. Building C Super
Sructure
Methodology and Data Collection
• Daily activity form sheet will be distributed to concerned site engineer
•Site engineer will assign works to foreman, each foreman will fill the data in form.
•The contents in the form majorly covering:
•The quantity of activity completed for the activity being carried out
•The quantity of skilled & unskilled used to complete the activity
•End of each shift these forms are collected by Productivity Engineer and compiles
the information and generates reports e.g. building wise trade wise, etc.
• Generally monitoring major works like Steel, Formwork, Concrete, Block, Tiles etc.
•From the above reports are very useful to site management to take necessary
corrective action to improve productivity wherever necessary
7. Building C Super
Sructure
Methodology and Data Collection
Validating the progress at site on daily basis in micro level monitoring
DAY WORK SHEET
DAILY ACTIVITY REPORT
SECTION ENGINEER FORM
Sl.No WORK TASK DESCRIPTION BUILDING LEVEL
SUB-
ZONE
TRADE
WORKDONE NO OF MEN
QTY. UNITS DAY NIGHT
1
2
3
4
5
6
7
8
9
10
TOTAL: 0 0
REASON
FOR
WORK:
SCOPE OF
WORKS
REWORKS VARIATIONS IDLE TIME
FOREMAN NAME & SIGNATURE: DATE SUPERVISOR / ENGINEER NAME & Signature DATE:
9. Building C Super
Sructure
Total Quantities – Concrete Works
Structural Works
Level Rebar (KG) Shutter (m2)
Concrete
(m3)
Planned
Productivity
(MD/Cu.m)
Mandays to
Complete
Basement - 3 7,553,230 27,245 28,251 2.5 70,628
Basement - 2 1,821,000 26,747 7,202 2.5 18,005
Basement - 1 2,615,000 30,285 9,093 2.5 22,733
Building - A 2,506,000 60,539 16,135 2.5 40,338
Building - B 2,408,000 51,804 13,610 2.5 34,025
Building - C 945,000 25,472 5,412 2.5 13,530
Building - D 2,257,000 54,546 13,121 2.5 32,803
Total 20,105,230 276,638 92,824 2.5 232,060
Structural Works for a Single Level
Level
Sub-
Zones
Rebar
(KG)
Shutter
(m2)
Concrete
(m3)
Planned
Productivity
(MD/Cu.m)
Mandays to
Complete
Level - 1
A-1 140,643 2,782 665 2.5 1,663
A-2 133,652 2,225 599 3.5 2,097
B-1 132,000 2,521 605 4.5 2,723
B-2 128,000 2,264 529 5.5 2,910
C 120,000 2,625 538 6.5 3,497
D-1 159,000 2,887 557 7.5 4,178
D-2 81,000 1,512 341 8.5 2,899
10. Building C Super
Sructure
Total Quantities - Finishes
Finishing Works
Description
of work
Unit
Quantities
Basement Building A
Building
B
Building C Building D
Total
Quantity
Planned Avg
Productivity
(Unit/Md)
Planned
Man Days
Blockwork m2 9,468 53,276 46,859 7,496 36,597 153,696 7 21,957
Plastering m2 72,797 64,448 6,205 50,006 193,456 9 21,495
Ceiling m2 537 7,918 13,736 2,416 13,736 38,343 5 7,669
Tile m2 622 48,380 42,960 5,281 42,960 140,203 7 20,029
Stone m2 350 3,756 3,663 2,338 4,534 14,641 7 2,092
Doors Nos 125 1,955 1,695 318 431 4,524 2 2,262
11. Building C Super
Sructure
Current Status – Concrete Works
Level/
Building
Planned Actual (As of Date)
Rebar (KG) Shutter (m2)
Concrete
(m3)
Planned
Productivity
Mandays to
Complete
Rebar (KG)
Shutter
(m2)
Concrete
(m3)
Mandays Productivity
Basement - 3 7,553,230 27,245 28,251 2.5 70,628 7,553,230 26,245 27,853 69,472 2.49
Basement - 2 1,821,000 26,747 7,202 2.5 18,005 1,343,000 21,117 7,202 31,096 4.32
Basement - 1 2,615,000 30,285 9,093 2.5 22,733 1,923,000 18,466 6,821 34,285 5.03
Building - A 2,506,000 60,539 16,135 2.5 40,338 781,000 25,630 3,653 19,249 5.27
Building - B 2,408,000 51,804 13,610 2.5 34,025 524,000 15,078 2,218 10,897 4.91
Building - C 945,000 25,472 5,412 2.5 13,530
Building - D 2,257,000 54,546 13,121 2.5 32,803 225,000 4,200 856 4,051 4.73
Total 20,105,230 276,638 92,824 2.5 232,060
12,349,23
0
110,736 48,603 169,050 3.48
% of Work Completed 52.36%
Actual Man Days 169,050
Earned Mandays 121,508
Loss / Gain -47,543
Required Man Days to complete remaining @ Current Rate of Productivity 153,809
Total Mandays for Completion (Expected) 322,859
Total Planned Mandays 232,060
Loss of Man days after Completion of Structure work -90,799
12. Building C Super
Sructure
Productivity History – Planned vs Actual
0.00
0.50
1.00
1.50
2.00
2.50
3.00
3.50
4.00
0.00
1.00
2.00
3.00
4.00
5.00
6.00
Apr-17 May-17 Jun-17 Jul-17 Aug-17 Sep-17 Oct-17 Nov-17 Dec-17
Planned Productivity (Avg/Month) Actual Productivity (Avg/Month)
Planned Productivity Cumulative Actual Productivity Cumulative
13. Building C Super
Sructure
Conclusion
•Various ways of improving productivity
•For an organisation to survive and prosper improving
productivity is a must
By Kapuganti Jagannadha Gupta
BE, MBA, PMP, CCE