SlideShare a Scribd company logo
1 of 6
Download to read offline
227
Journal of Global Resources Volume 6 (01) August 2019-January 2020 Page 227-232
UGCโ€“CARE Listed Journal in Group D ISSN: 2395-3160 (Print), 2455-2445 (Online)
36
CHANGING SCENARIO OF LIVESTOCK IN SELECTED DISTRICTS OF RAJASTHAN
Om Prakash
Assistant Professor, Department of Geography, JNV University Jodhpur (Rajasthan)
Email: oprjnvu@gmail.com
Abstract: Livestock population and productivity is greatly influenced by climatic conditions. The
climate has a significant impact not only on cattle but also on other livestock. Along with climate
livestock are also get influenced by the availability of good soil/land and rainfall supply.
Rajasthan is a state of fluctuating local distinctiveness of land and climate. The cattle
population of Rajasthan shows variations in different districts. As per the reports, Rajasthan
and other parts country display poor livestock production. This article analyses the livestock of
Total three districts with the help of study of total livestock available in these districts in different
years since 1961 to 2012 including all the data for separate districts. The data is collected for
different livestock that includes Cattle, Buffalo, Sheep, Goat, Horses & Ponies, Donkey, Camel
and others.
Introduction
The rural population of India consists of more than 70 percent. Hence, probably land is
pressurized more as almost the entire village population relies on agriculture, resulting in an
unfavorable landman ratio. Merely agriculture cannot provide gainful employment to all the rural
areas as the population is exploding resulting in the increasing pressure on land. Thus, allied
activities like animal husbandry can be considered as an effective instrument for supplementing
the income and providing employment to the weaker sections in rural areas. Domesticated
animals are prominently known as โ€œlive banksโ€, are the significant contributors to our national
wealth and therefore help in enhancing the living standards of rural people. The livestock
population in Rajasthan has increased from 255.16 lacs in 1951 to 577.32 lacs; about 11.27
percent of Livestock population of country is available in Rajasthanโ€. In this way animal
husbandry remains the Prime occupation in Rajasthan. 19th
Enumeration of livestock was done
in 2012 when the number of total domestic animal found to be 577.32 lacs and their density
was 169 per sq. km. livestock sector provide consistent growth rate of over 6 percent per
annum round the year employment opportunity with more than 50 percent of total house hold
income in arid region as against national average of 22.5 percent and produce 11 percent milk,
30 percent wool and10 percent meat of the country. Rajasthan has Rank 1st
in wool production,
Rank 1st
in live meat animals (goat, sheep, and buffalo) to the tune of about 40,000 heads per
day Rank 2nd
in milk production in country more than 80 percent rural households keep animals
which continue to provide subsistence income during scarcity.
In the arid and semi-arid zone livestock rearing is the primary occupation and the principal
source of livelihood for the people and is only next to agriculture in importance. The study area
(Jodhpur, Barmer and Nagaur Districts) is main part of this zone and has 12.60 percent of
Rajasthanโ€™s total livestock. Barmer is one of leading district in having largest number of sheep
(14.04lacs) goats (28.96 lacs), Horses (2591), donkeys and pony (17495), camels (43172) and
total livestock (53.66lakh) according to 19th
livestock census 2012. Study area is comparatively
dry, rainless, hot and water scarcity area due to which the animal which can either survive on
small quantity of water like sheep goats or prolong their life cycle for a longest period without
water like camels and donkeys, livestock is the major source of livelihood for study area.
Study Area
The study area includes - Barmer, Jodhpur and Nagaur districts located between 24O
58' and
27O
40' North latitude and 70O
5' and 75O
15' East longitude. The study area is bounded on the
north by Churu and Bikaner districts on the east by Sikar, Jaipur and Ajmer districts, on the
south by Pali, Jalore districts and Gujrat state and on the west Jaisalmer district. The total
geographical area of study area is 68,955 square kilometre.
228
Present Scenario of Livestock
Rajasthan is majorly driven by the Service sector but farming and allied activities are still major
sources of livelihood in villages. Livestock is the primary vocation of Rajasthan as 61.1 percent
of the aggregate area is desert. The 19th
Livestock census, 2012 (GOI, 2014) stated that one of
the biggest livestock in the world is that of India with a holding of 11.6 percent of world livestock
population which consists buffaloes (57.83 percent), cattle (15.06 percent), sheep (7.14
percent), goats (17.93 percent), camel (2.18 percent), equine (1.3 percent), pigs (1.2
percent), chickens (4.72 percent) and ducks (1.94 percent). India possesses a huge livestock
population of 512 million nos. This mainly includes cattle, buffaloes, goats, sheep, and pigs.
There was a decrease of 33 percent of the livestock population in India as compared to the
previous census. The cattle, buffalo, sheep, goat, pig, and others contribute 37.28, 21.23,
12.71, 26.4, 2.01 and 0.5 percent, respectively in total livestock population. The livestock
population India has substantially increased in Gujarat (15.36 percent), Uttar Pradesh (14.01
percent), Assam (10.77 percent), Punjab (9.57 percent), Bihar (8.56 percent), Sikkim (7.96
percent), Meghalaya (7.41 percent) and Chhattisgarh (4.34 percent). Adeline has been noted
in the population of cattle, sheep, goats, and pigs by 4.1, 9.07, 3.82 and 7.54 percent,
respectively while the population of buffalo and poultry increased by 3.19 and 19 percent,
respectively in the last inter-censual period. A significant increase of 20.18 percent has been
registered in the Exotic and crossbred cattle population while the indigenous cattle diminished
by 8.94 percent. 729.21 million the total poultry population of India, which includes 692.65,
23.54 and 13.02 million chickens, duck and turkeys & other poultry, respectively There is a
growth trend in total poultry population quite more as compared to the total livestock population
(Islam, Anjum, Modi & Wadhwani, 2016) as per the observation.
Objectives
๏‚ท Analyze the livestock population structure geographically.
๏‚ท To analyze the role of livestock in balancing against risks.
๏‚ท To identify the effect of modernization on livestock scenario.
229
Research Methodology
The study area โ€œJodhpur, Barmer and Nagaurโ€ district is quite backward in socio โ€“ economic
status as it lies in Western arid Rajasthan where people are chiefly engaged in livestock
occupation. This geographical study aims at analysing present scenario of livestock which has
emerged as one of the key components of agriculture growth in arid region in recent years.
Causal research is conducted in order to identify the extent and nature of cause-and-effect
relationships.
Sampling Procedure
The present study is confined to study of secondary data for the livestock population of Barmer,
Nagaur and Jodhpur districts of Rajasthan and the factors affecting livestock productivity and
livestock occupation of rural people of the three districts.
Data Analysis
Table 01: Density of Livestock in Barmer, Jodhpur and Nagaur
Year Area of
(B+J+N)
Cattle
Density
Buffalo
Density
Sheep
Density
Goat
Density
Horses &
Ponies
Density
Donkey
Density
Camel
Density
Other
Density
Total
Livestock
Density
1961 68525.5 74 9.70 65 62 0.27 1.32 5.8 0.048 218
1966 68525.5 84 10.65 91 79 0.23 1.29 7.3 0.059 273
1972 68738 58 10.30 95 110 0.14 1.33 8.5 0.100 283
1977 68738 70 13.86 122 113 0.18 2.03 9.0 0.114 331
1983 68955 74 17.52 160 139 0.14 2.19 8.3 0.233 401
1988 68955 49 16.94 100 96 0.15 1.52 6.9 0.400 271
1992 68955 63 24.68 143 110 0.11 2.16 8.6 0.653 391
1997 68955 76 37.26 194 184 0.13 2.13 7.5 0.716 502
2003 68955 62 58.35 118 158 0.15 1.48 4.7 1.021 404
2007 68955 71 41.47 135 214 0.14 1.06 4.0 0.281 468
2012 68955 93 52.32 114 259 0.29 0.90 2.9 0.469 524
Source: livestock census reports 1961-2012, Board of Revenue Ajmer
* Population Density of livestock = Number of Livestock/Land Area.
Table 1 shows the combined density of livestock in all the three districts taken for study
viz. Barnmer, Nagaur and Jodhpur district. From above table it is quite evident that Goat
density (259) and Sheep density (114) are highest followed by cattle density at the third place.
We have already seen in the separate analysis of livestock densities of the three districts that
goat, cattle and sheep are the highly maintained live stocks in the three districts. Also from the
table it is clear that total livestock density from 1961 to 2012 is mainly increasing with only two
declines noticed in the year 1988 and 2003. Thus the total livestock is witnessing an increase
during the time period under consideration. To find the significance growth of livestock
population in Barmer, Jodhpur and Nagaur districts during the period of 1961 to 2012 following
hypothesis has been formulated and tested with the help of regression analysis.
Table 02: Statistics for Livestock in Barmer, Jodhpur and Nagaur
Category N Mean Std. Deviation Std. Error Mean
Cattle 11 70.36 12.209 3.681
Buffalos 11 26.64 17.753 5.353
Sheep 11 121.55 35.691 10.761
Goat 11 138.55 60.120 18.127
Horses & Ponies 11 .18 .060 .018
Donkey 11 1.58 .466 .141
Camel 11 6.68 2.056 .620
Other 11 .37 .316 .095
Total 11 369.6364 102.32524 30.85222
Source: calculated by author
H01:- There is no significant growth of Livestock population in Barmer, Jodhpur and
Nagaur district during the period of 1961 to 2012.
H1:- There is a significant growth of Livestock population in Barmer, Jodhpur and Nagaur
district during the period of 1961 to 2012.
230
Table 2 presented the mean, standard deviation with standard error mean has been
given in the table. Table above depicts that the mean score value of the Cattle (70.36 ยฑ
12.209), Buffalos (26.64 ยฑ 17.753), Sheep (121.55 ยฑ 35.691), Goat (138.55 ยฑ 60.12), Horses &
Ponies (0.18 ยฑ 0.06), Donkey (1.58 ยฑ 0.466), Camel (6.68 ยฑ 2.056), other (0.37 ยฑ 0.316) and
Total (369.6364 ยฑ 102.32524).
Table 03: Regression for Livestock in Barmer, Nagaur and Jodhpur
ANOVA
a
Model Sum of
Squares
Df Mean Square F Sig.
1 Regression 2789.383 9 309.931 4.104 .0367
b
Residual 75.526 1 75.526
Total 2864.909 10
a. Dependent Variable: Year
b. Predictors: (Constant), Total, Donkey, Cattle, Other, Horses ponies, Camel, Sheep, Buffalos, Goat
Source: calculated by author
Table 3 indicates that the regression model predicts the dependent variable significantly
well. Here, p =.03367, which is less than 0.05, and indicates that, overall, the regression model
statistically significantly predicts the outcome variable (i.e., it is a good fit for the data). The
Coefficients table provides us with the necessary information to predict livestock from year, as
well as determine whether livestock contributes statistically significantly to the model (by
looking at the "Sig." column). The significant value is less than 0.05 (p value). This means we
have to reject the null hypothesis and accept the alternative hypothesis that there is a
significant growth of Livestock population in Barmer, Nagaur and Jodhpur district during the
period of 1961 to 2012. Thus during last 5 decades livestock has grown up to a significant level
due to the combined efforts made by government and rural people. To find the trend line
equations and predicted values and also for their regression analysis following table and
graphs are used;
Table 04: Trend Line Equation and Predicted Value of Cattle in Barmer, Jodhpur and Nagaur
Source: Livestock census reports 1961-2012, Board of Revenue, Ajmer
Above table represents the cattle density for years ranging from period of 1961 to 2012,
the cattle population of Barmer, Nagaur and Jodhpur district along with its corresponding
predicted value is also shown. The predicated value is calculated on the basis of following trend
line equation;
Y = 0.0826X - 93.76652
Where Y= predicted value and X= year
A trend line is a line drawn on a chart based on data points on the chart and which
helps to determine a trend and help make trading decisions. Trend lines are commonly used to
decide entry and exit timing when trading securities. Trend lines are an important tool in
technical analysis for both trend identification and confirmation. It is a straight line that connects
two or more variable points and then extends into the future to act as a line of support or
resistance.
Uptrend Line
An uptrend line displays a positive slope and is formed simply by joining two or
more low points. To have a positive slope the second low must be higher than the first one for a
Year Area of B+J+N Cattle Density Predicted Values (Y=0.0826X - 93.76652)
1961 68525.5 74 68.212
1966 68525.5 84 68.625
1972 68738 58 69.121
1977 68738 70 69.534
1983 68955 74 70.029
1988 68955 49 70.442
1992 68955 63 70.773
1997 68955 76 71.186
2003 68955 62 71.681
2007 68955 71 72.012
2012 68955 93 72.425
231
line to have a positive slope. Uptrend lines act as support and indicate that net-increase
(increase in livestock) is increasing even as the year wise distribution displaying fluctuations.
Downtrend Line
A downtrend line shows a negative slope and is formed merely by joining two or
more high points. Here in this case the second high must be lower than the first for the line to
have a negative slope. Downtrend lines act as resistance, and indicate that net-increase
(increase in livestock) is decreasing even as the time increasing.
Graph 01: Trend Line Equation and Predicted Value of Cattle in Barmer, Jodhpur and Nagaur
Source: Calculated by author
R-squared is a statistical measure of how close the data are to the fitted trend line.
Just by looking at the regression line running up through the data, predictions can be done. For
2012, it looks like the line will be somewhere between 80 and 100 cattle density! That might be
โ€œgood enoughโ€, but regression also gives a useful equation, which for this chart is:
Y = 0.0826X - 93.76652
What that means is, we can plug in an x value (the year) and get a pretty good estimate of
cattle density for any year. For example, 2007:
Y = 0.0826(2007) - 93.76652= 74.018 density, which is exactly same as the actual figure of
72.012 cattle density for that year.
Best of all, we can use the equation to make predictions. For example, how much cattle density
will grow in 2017?
Y = 0.0826(2017) - 93.76652= 93.76 cattle density.
Regression also gives an R squared value, which for this graph is 1. This number tells
how good the model is. The values range from 0 to 1, with 0 being a terrible model and 1 being
a perfect model. As it can be probably seen, 1 is a fairly an excellent model so it can be fairly
confident in cattle density prediction!
Furthermore the trend line here has a positive slope showing an uptrend line but with a
very little slope displaying very less increase in net cattle density value for the course of time
and an increase in this value can also be predicted for the future. Thus to make the increment
in density significant combined effort needs to be made by the govt. as well as rural people.
Also it can be easily interpreted from the graph that cattle density is witnessing regular
fluctuations. From 1961 to 2012 cattle density can be viewed as fluctuating due to the
vulnerable climatic conditions of Barmer, Nagaur and Jodhpur districts. Regression also gives
an R squared value, which for this graph is 1. This number tells how good the model is. The
values range from 0 to 1, with 0 being a terrible model and 1 being a perfect model. As it can
probably be viewed, 1 is a fairly an excellent model so it can be fairly confident in total livestock
density prediction. Results show the combined density of livestock in all the three districts
taken for study viz. Barmer, Nagaur and Jodhpur districts that Goat density and Sheep density
are highest followed by cattle density at the third place. Additionally the trend line for total
livestock has a positive slope showing an uptrend line displaying increase in net total livestock
density value for the course of time and also for the future. Also it can be viewed from the graph
74
84
58
70 74
49
63
76
62
71
93
y = 0.0826x - 93.767
Rยฒ = 1
0
20
40
60
80
100
1950 1960 1970 1980 1990 2000 2010 2020
Cattle Density
Predicted Values (Y = 0.0826X -
93.76652)
Linear (Predicted Values (Y =
0.0826X - 93.76652))
232
that total livestock density in Barmer, Nagaur and Jodhpur district from the year 1961 to 2012 is
on an increasing trend with the lowest density recorded in the year 1988 and 2003.
Conclusion
The study of Changing Livestock scenario in Jodhpur, Barmer and Nagaur districts was proved
as important as Rajasthan is the largest state of India gifted with big livestock production and
the significance of agriculture and allied sector in the state gross domestic product is
considerably higher. Livestock was thus successfully proved to be life saviour in much distress,
especially in case of drought in the study area. Livestock provides a potentially significant
source of diversified income to smallholder operating in the difficult climatic condition in the
three districts under observation. Through this study significance and development of livestock
and specific approaches for the growth of the livestock were identified.
References
1. 19th
Indian livestock census All India Summery Report (2013) Govt. of India Ministry of
agriculture department of Animal husbandry and dairying โ€“ New Delhi.
2. Abhichandani and Ghosh, P.K. (1986) โ€œAnimal husbandry in Arid zone environment In:
Desert environment conservation and management (Ed.) โ€“ CAZRI
3. Annual Report 2012-13 Department of animal husbandry dairying and fisheries ministry of
agriculture, Govt .of India โ€“ New Delhi.
4. Annual Report. (2011-12) Department of Animal Husbandry, Dairying, and Fisheries.
Ministry of Agriculture, Govt. of India, New Delhi. (http://www.ijset.net/journal/956.pdf)
5. Baba, S.H., Wani, M.H. and Zargar, B.A. (2011) Dynamics and sustainability of the livestock
sector in Jammu & Kashmir., Agric. Econ. Res. Rev., 24: 119-132
6. Census Reports of Barmer, Jodhpur and Nagaur District 2012
7. Chander, M., Kumar, S., Rathore, R. S., Mukherjee, R., Kondaiah, N., & Pandey, H. N.
(2007) Organic vis-a-vis Conventional livestock production potential in India. In Papers
submitted to the International Conference on Organic Agriculture and Food Security, FAO,
Rome, Italy (pp. 48-49).
8. Gupta, Shweta- Livestock Revolution in India: Issues and Impacts on Small Scale
Producers
9. http://animalhusbandry.rajasthan.gov.in/livestock_census.aspx
10. https://www.researchgate.net
11. Islam, M. M., Anjum, S., Modi, R. J., & Wadhwani, K. N. (2016) The scenario of livestock
and poultry in India and their contribution to the national economy. International Journal of
Science, Environment and Technology, 5(3), 956-65.
12. Kohler-Rollefson, I. (2001) The livestock revolution and organic animal husbandry.
EcolFmg, 27, 10-11.
13. Kumar, A. (2010) Exports of Livestock Products from India: Performance, Competitiveness,
and Determinants. Agricultural Economics Research Review, 23(1).
14. National Accounts Division. Central Statistical Office. Ministry of statistics and
programme implementation.
15. Prabhu, M., Kumar, G. S., Pandian, A., Selvakumar, K. N., & Jayavarathan, B. (2012)
Dynamics of livestock population-India vis-ร -vis Tamil Nadu.
16. Raut, K. C. (2006) Research Priorities in Livestock Statistics. J. Ind. Soc. Agril. Statist,
60(1), 16-26.
17. Soju, S., & Meena, G. L. (2017) Dynamics of livestock population and output in Rajasthan:
A temporal analysis. Journal of Animal Research, 7(2), 345.

More Related Content

What's hot

The Integration of Livestock Production for Employment and Income Generation
The Integration of Livestock Production for Employment and Income GenerationThe Integration of Livestock Production for Employment and Income Generation
The Integration of Livestock Production for Employment and Income GenerationRHIMRJ Journal
ย 
โ€œFuture & Scope In Animal Husbandry Areasโ€™โ€™
โ€œFuture & Scope In Animal Husbandry Areasโ€™โ€™โ€œFuture & Scope In Animal Husbandry Areasโ€™โ€™
โ€œFuture & Scope In Animal Husbandry Areasโ€™โ€™Harsh Mishra
ย 
Current and Future Feed Requirement foe Livestock
Current and Future Feed Requirement foe LivestockCurrent and Future Feed Requirement foe Livestock
Current and Future Feed Requirement foe LivestockDSVCKV, DURG
ย 
Dimensions of agrarian crisis and underlying policies
Dimensions of agrarian crisis and underlying policiesDimensions of agrarian crisis and underlying policies
Dimensions of agrarian crisis and underlying policiesRamanjaneyulu GV
ย 
Importance of livestock production from grasslands for national and local foo...
Importance of livestock production from grasslands for national and local foo...Importance of livestock production from grasslands for national and local foo...
Importance of livestock production from grasslands for national and local foo...ILRI
ย 
Importance of livestock management Allah Dad Khan
Importance of livestock management Allah Dad KhanImportance of livestock management Allah Dad Khan
Importance of livestock management Allah Dad KhanMr.Allah Dad Khan
ย 
Trade in Indigenous Chickens and its Profitability in Eastern Chad
Trade in Indigenous Chickens and its Profitability in Eastern ChadTrade in Indigenous Chickens and its Profitability in Eastern Chad
Trade in Indigenous Chickens and its Profitability in Eastern ChadPremier Publishers
ย 
PH Lecture 4: Present Status of Poultry Sector 2011-12
PH Lecture 4: Present Status of Poultry Sector 2011-12PH Lecture 4: Present Status of Poultry Sector 2011-12
PH Lecture 4: Present Status of Poultry Sector 2011-12Osama Zahid
ย 
The Role of Livestock in Sustainable Rural Development, Poverty Reduction, an...
The Role of Livestock in Sustainable Rural Development, Poverty Reduction, an...The Role of Livestock in Sustainable Rural Development, Poverty Reduction, an...
The Role of Livestock in Sustainable Rural Development, Poverty Reduction, an...FAO
ย 
Dr.farooq tareen livestock balochistan prospects-initiative1 (1)
Dr.farooq tareen livestock balochistan prospects-initiative1 (1)Dr.farooq tareen livestock balochistan prospects-initiative1 (1)
Dr.farooq tareen livestock balochistan prospects-initiative1 (1)Farooq Tareen
ย 
Livestock and Poultry Sectors in Pakistan
Livestock and Poultry Sectors in PakistanLivestock and Poultry Sectors in Pakistan
Livestock and Poultry Sectors in PakistanILRI
ย 
SPEARHEADING DEVELOPMENT THROUGH EMPOWERING SMALLHOLDER FARMERS ALONG BEEF CA...
SPEARHEADING DEVELOPMENT THROUGH EMPOWERING SMALLHOLDER FARMERS ALONG BEEF CA...SPEARHEADING DEVELOPMENT THROUGH EMPOWERING SMALLHOLDER FARMERS ALONG BEEF CA...
SPEARHEADING DEVELOPMENT THROUGH EMPOWERING SMALLHOLDER FARMERS ALONG BEEF CA...ijmvsc
ย 

What's hot (14)

The Integration of Livestock Production for Employment and Income Generation
The Integration of Livestock Production for Employment and Income GenerationThe Integration of Livestock Production for Employment and Income Generation
The Integration of Livestock Production for Employment and Income Generation
ย 
โ€œFuture & Scope In Animal Husbandry Areasโ€™โ€™
โ€œFuture & Scope In Animal Husbandry Areasโ€™โ€™โ€œFuture & Scope In Animal Husbandry Areasโ€™โ€™
โ€œFuture & Scope In Animal Husbandry Areasโ€™โ€™
ย 
Current and Future Feed Requirement foe Livestock
Current and Future Feed Requirement foe LivestockCurrent and Future Feed Requirement foe Livestock
Current and Future Feed Requirement foe Livestock
ย 
Dimensions of agrarian crisis and underlying policies
Dimensions of agrarian crisis and underlying policiesDimensions of agrarian crisis and underlying policies
Dimensions of agrarian crisis and underlying policies
ย 
Importance of livestock production from grasslands for national and local foo...
Importance of livestock production from grasslands for national and local foo...Importance of livestock production from grasslands for national and local foo...
Importance of livestock production from grasslands for national and local foo...
ย 
Importance of livestock management Allah Dad Khan
Importance of livestock management Allah Dad KhanImportance of livestock management Allah Dad Khan
Importance of livestock management Allah Dad Khan
ย 
Trade in Indigenous Chickens and its Profitability in Eastern Chad
Trade in Indigenous Chickens and its Profitability in Eastern ChadTrade in Indigenous Chickens and its Profitability in Eastern Chad
Trade in Indigenous Chickens and its Profitability in Eastern Chad
ย 
Genetic resources for family poultry production in india 2
Genetic resources for family poultry production in india 2Genetic resources for family poultry production in india 2
Genetic resources for family poultry production in india 2
ย 
PH Lecture 4: Present Status of Poultry Sector 2011-12
PH Lecture 4: Present Status of Poultry Sector 2011-12PH Lecture 4: Present Status of Poultry Sector 2011-12
PH Lecture 4: Present Status of Poultry Sector 2011-12
ย 
The Role of Livestock in Sustainable Rural Development, Poverty Reduction, an...
The Role of Livestock in Sustainable Rural Development, Poverty Reduction, an...The Role of Livestock in Sustainable Rural Development, Poverty Reduction, an...
The Role of Livestock in Sustainable Rural Development, Poverty Reduction, an...
ย 
Ansc 107 lecture-lecture_1 (1)
Ansc 107 lecture-lecture_1 (1)Ansc 107 lecture-lecture_1 (1)
Ansc 107 lecture-lecture_1 (1)
ย 
Dr.farooq tareen livestock balochistan prospects-initiative1 (1)
Dr.farooq tareen livestock balochistan prospects-initiative1 (1)Dr.farooq tareen livestock balochistan prospects-initiative1 (1)
Dr.farooq tareen livestock balochistan prospects-initiative1 (1)
ย 
Livestock and Poultry Sectors in Pakistan
Livestock and Poultry Sectors in PakistanLivestock and Poultry Sectors in Pakistan
Livestock and Poultry Sectors in Pakistan
ย 
SPEARHEADING DEVELOPMENT THROUGH EMPOWERING SMALLHOLDER FARMERS ALONG BEEF CA...
SPEARHEADING DEVELOPMENT THROUGH EMPOWERING SMALLHOLDER FARMERS ALONG BEEF CA...SPEARHEADING DEVELOPMENT THROUGH EMPOWERING SMALLHOLDER FARMERS ALONG BEEF CA...
SPEARHEADING DEVELOPMENT THROUGH EMPOWERING SMALLHOLDER FARMERS ALONG BEEF CA...
ย 

Similar to 36. om prekash

Socio-economic determinants of small ruminant pastoralists in India.
Socio-economic determinants of small ruminant pastoralists in India.Socio-economic determinants of small ruminant pastoralists in India.
Socio-economic determinants of small ruminant pastoralists in India.Dr Pranav Kumar
ย 
Dairy intensification and grassland access for livestock: A comparative study...
Dairy intensification and grassland access for livestock: A comparative study...Dairy intensification and grassland access for livestock: A comparative study...
Dairy intensification and grassland access for livestock: A comparative study...ILRI
ย 
Role of Livestock in Indian Economy
Role of Livestock in Indian EconomyRole of Livestock in Indian Economy
Role of Livestock in Indian EconomyBalaraj BL
ย 
1. Economic Study of Cattle fattening
1. Economic Study of Cattle fattening1. Economic Study of Cattle fattening
1. Economic Study of Cattle fatteningDr. Paresh Kumar Sarma
ย 
PN24_Livestock_breeds_SF
PN24_Livestock_breeds_SFPN24_Livestock_breeds_SF
PN24_Livestock_breeds_SFMatthijs Kool
ย 
5.md. asif iqubal 48 56
5.md. asif iqubal 48 565.md. asif iqubal 48 56
5.md. asif iqubal 48 56Alexander Decker
ย 
Scope and Prospect of Dairy farming in North East India
Scope and Prospect of Dairy farming in North East IndiaScope and Prospect of Dairy farming in North East India
Scope and Prospect of Dairy farming in North East IndiaDrSapunii Hanah
ย 
Kadaknath BY :- Jayarajaha Arthigan
Kadaknath BY :- Jayarajaha ArthiganKadaknath BY :- Jayarajaha Arthigan
Kadaknath BY :- Jayarajaha ArthiganGanesalingamJayaraja
ย 
LIVELIHOOD DIVERSIFICATIN and Food Availability of farm households in kumaon ...
LIVELIHOOD DIVERSIFICATIN and Food Availability of farm households in kumaon ...LIVELIHOOD DIVERSIFICATIN and Food Availability of farm households in kumaon ...
LIVELIHOOD DIVERSIFICATIN and Food Availability of farm households in kumaon ...DrDhirendraKumar2
ย 
1 Demographic distribution of livestock historty INTRODUCTION TO AH.pptx
1 Demographic distribution of livestock historty INTRODUCTION TO AH.pptx1 Demographic distribution of livestock historty INTRODUCTION TO AH.pptx
1 Demographic distribution of livestock historty INTRODUCTION TO AH.pptxtsvanil1
ย 
Agro-Climatic Zones and Economic Development of Rajasthan
Agro-Climatic Zones and Economic Development of RajasthanAgro-Climatic Zones and Economic Development of Rajasthan
Agro-Climatic Zones and Economic Development of Rajasthaninventionjournals
ย 
Fodder value chains in Bihar
Fodder value chains in BiharFodder value chains in Bihar
Fodder value chains in BiharKrishna Singh
ย 
Livestock -Backbone of Rural India
Livestock -Backbone of Rural IndiaLivestock -Backbone of Rural India
Livestock -Backbone of Rural IndiaAYSHA NADA
ย 
Food production trends
Food production trendsFood production trends
Food production trendskeerthi kobaku
ย 
Demographic distribution of livestock 1.pptx
Demographic distribution of livestock 1.pptxDemographic distribution of livestock 1.pptx
Demographic distribution of livestock 1.pptxtsvanil1
ย 
Livestock in ladakh
Livestock in ladakhLivestock in ladakh
Livestock in ladakhSKUAST-Kashmir
ย 
Feed resources for livestock
Feed resources for livestockFeed resources for livestock
Feed resources for livestockPMAS-UAAR
ย 

Similar to 36. om prekash (20)

Socio-economic determinants of small ruminant pastoralists in India.
Socio-economic determinants of small ruminant pastoralists in India.Socio-economic determinants of small ruminant pastoralists in India.
Socio-economic determinants of small ruminant pastoralists in India.
ย 
Dairy intensification and grassland access for livestock: A comparative study...
Dairy intensification and grassland access for livestock: A comparative study...Dairy intensification and grassland access for livestock: A comparative study...
Dairy intensification and grassland access for livestock: A comparative study...
ย 
H0363040046
H0363040046H0363040046
H0363040046
ย 
Role of Livestock in Indian Economy
Role of Livestock in Indian EconomyRole of Livestock in Indian Economy
Role of Livestock in Indian Economy
ย 
1. Economic Study of Cattle fattening
1. Economic Study of Cattle fattening1. Economic Study of Cattle fattening
1. Economic Study of Cattle fattening
ย 
PN24_Livestock_breeds_SF
PN24_Livestock_breeds_SFPN24_Livestock_breeds_SF
PN24_Livestock_breeds_SF
ย 
5.md. asif iqubal 48 56
5.md. asif iqubal 48 565.md. asif iqubal 48 56
5.md. asif iqubal 48 56
ย 
Current_Status_Ornithofauna_Ambedkar_Nagar_Uttar_Pradesh.pdf
Current_Status_Ornithofauna_Ambedkar_Nagar_Uttar_Pradesh.pdfCurrent_Status_Ornithofauna_Ambedkar_Nagar_Uttar_Pradesh.pdf
Current_Status_Ornithofauna_Ambedkar_Nagar_Uttar_Pradesh.pdf
ย 
Scope and Prospect of Dairy farming in North East India
Scope and Prospect of Dairy farming in North East IndiaScope and Prospect of Dairy farming in North East India
Scope and Prospect of Dairy farming in North East India
ย 
Kadaknath BY :- Jayarajaha Arthigan
Kadaknath BY :- Jayarajaha ArthiganKadaknath BY :- Jayarajaha Arthigan
Kadaknath BY :- Jayarajaha Arthigan
ย 
Jahp 6 1_35-40
Jahp 6 1_35-40Jahp 6 1_35-40
Jahp 6 1_35-40
ย 
LIVELIHOOD DIVERSIFICATIN and Food Availability of farm households in kumaon ...
LIVELIHOOD DIVERSIFICATIN and Food Availability of farm households in kumaon ...LIVELIHOOD DIVERSIFICATIN and Food Availability of farm households in kumaon ...
LIVELIHOOD DIVERSIFICATIN and Food Availability of farm households in kumaon ...
ย 
1 Demographic distribution of livestock historty INTRODUCTION TO AH.pptx
1 Demographic distribution of livestock historty INTRODUCTION TO AH.pptx1 Demographic distribution of livestock historty INTRODUCTION TO AH.pptx
1 Demographic distribution of livestock historty INTRODUCTION TO AH.pptx
ย 
Agro-Climatic Zones and Economic Development of Rajasthan
Agro-Climatic Zones and Economic Development of RajasthanAgro-Climatic Zones and Economic Development of Rajasthan
Agro-Climatic Zones and Economic Development of Rajasthan
ย 
Fodder value chains in Bihar
Fodder value chains in BiharFodder value chains in Bihar
Fodder value chains in Bihar
ย 
Livestock -Backbone of Rural India
Livestock -Backbone of Rural IndiaLivestock -Backbone of Rural India
Livestock -Backbone of Rural India
ย 
Food production trends
Food production trendsFood production trends
Food production trends
ย 
Demographic distribution of livestock 1.pptx
Demographic distribution of livestock 1.pptxDemographic distribution of livestock 1.pptx
Demographic distribution of livestock 1.pptx
ย 
Livestock in ladakh
Livestock in ladakhLivestock in ladakh
Livestock in ladakh
ย 
Feed resources for livestock
Feed resources for livestockFeed resources for livestock
Feed resources for livestock
ย 

More from Journal of Global Resources

33. shyam sundhar, s. sanjeevi prasad and indrani mukherjee
33. shyam sundhar, s. sanjeevi prasad and indrani mukherjee33. shyam sundhar, s. sanjeevi prasad and indrani mukherjee
33. shyam sundhar, s. sanjeevi prasad and indrani mukherjeeJournal of Global Resources
ย 
21. paramita chaudhuri, pritam aitch and amit dutta
21. paramita chaudhuri, pritam aitch and amit dutta21. paramita chaudhuri, pritam aitch and amit dutta
21. paramita chaudhuri, pritam aitch and amit duttaJournal of Global Resources
ย 
19. sangita karmakar, bhupen barman and ranjan roy
19. sangita karmakar, bhupen barman and  ranjan roy19. sangita karmakar, bhupen barman and  ranjan roy
19. sangita karmakar, bhupen barman and ranjan royJournal of Global Resources
ย 

More from Journal of Global Resources (20)

Content page i to v
Content page i to vContent page i to v
Content page i to v
ย 
38. neha pandey and chilka sharma
38. neha pandey and chilka sharma38. neha pandey and chilka sharma
38. neha pandey and chilka sharma
ย 
37. madhusudan karmkar
37. madhusudan karmkar37. madhusudan karmkar
37. madhusudan karmkar
ย 
35. imran khan
35. imran khan35. imran khan
35. imran khan
ย 
34. sumana nand and tapas mistri
34. sumana nand and tapas mistri34. sumana nand and tapas mistri
34. sumana nand and tapas mistri
ย 
33. shyam sundhar, s. sanjeevi prasad and indrani mukherjee
33. shyam sundhar, s. sanjeevi prasad and indrani mukherjee33. shyam sundhar, s. sanjeevi prasad and indrani mukherjee
33. shyam sundhar, s. sanjeevi prasad and indrani mukherjee
ย 
32. indrani mukharji
32. indrani mukharji32. indrani mukharji
32. indrani mukharji
ย 
31. shoyab mohammad and nafeesa bano
31. shoyab mohammad and nafeesa bano31. shoyab mohammad and nafeesa bano
31. shoyab mohammad and nafeesa bano
ย 
30. z. t. khan and dipankar bera
30. z. t. khan and dipankar bera30. z. t. khan and dipankar bera
30. z. t. khan and dipankar bera
ย 
29. prem sonwal
29. prem sonwal29. prem sonwal
29. prem sonwal
ย 
28. vinay raikwar and pramod pagare
28. vinay raikwar and pramod pagare28. vinay raikwar and pramod pagare
28. vinay raikwar and pramod pagare
ย 
27. airtra basak and saddique
27. airtra basak and saddique27. airtra basak and saddique
27. airtra basak and saddique
ย 
25. shivani swarnkar
25. shivani swarnkar25. shivani swarnkar
25. shivani swarnkar
ย 
26. nafisa and saify
26. nafisa and saify26. nafisa and saify
26. nafisa and saify
ย 
24. ghanshyam prasad jhariya
24. ghanshyam prasad jhariya24. ghanshyam prasad jhariya
24. ghanshyam prasad jhariya
ย 
23. hasibur rahaman molla
23. hasibur rahaman molla23. hasibur rahaman molla
23. hasibur rahaman molla
ย 
22. maliga m riyaz and other
22. maliga m riyaz and other22. maliga m riyaz and other
22. maliga m riyaz and other
ย 
21. paramita chaudhuri, pritam aitch and amit dutta
21. paramita chaudhuri, pritam aitch and amit dutta21. paramita chaudhuri, pritam aitch and amit dutta
21. paramita chaudhuri, pritam aitch and amit dutta
ย 
20. asima nusruth and shruthi m b
20. asima nusruth and  shruthi m b20. asima nusruth and  shruthi m b
20. asima nusruth and shruthi m b
ย 
19. sangita karmakar, bhupen barman and ranjan roy
19. sangita karmakar, bhupen barman and  ranjan roy19. sangita karmakar, bhupen barman and  ranjan roy
19. sangita karmakar, bhupen barman and ranjan roy
ย 

Recently uploaded

RA 7942:vThe Philippine Mining Act of 1995
RA 7942:vThe Philippine Mining Act of 1995RA 7942:vThe Philippine Mining Act of 1995
RA 7942:vThe Philippine Mining Act of 1995garthraymundo123
ย 
VIP Model Call Girls Chakan ( Pune ) Call ON 8005736733 Starting From 5K to 2...
VIP Model Call Girls Chakan ( Pune ) Call ON 8005736733 Starting From 5K to 2...VIP Model Call Girls Chakan ( Pune ) Call ON 8005736733 Starting From 5K to 2...
VIP Model Call Girls Chakan ( Pune ) Call ON 8005736733 Starting From 5K to 2...SUHANI PANDEY
ย 
VVIP Pune Call Girls Moshi WhatSapp Number 8005736733 With Elite Staff And Re...
VVIP Pune Call Girls Moshi WhatSapp Number 8005736733 With Elite Staff And Re...VVIP Pune Call Girls Moshi WhatSapp Number 8005736733 With Elite Staff And Re...
VVIP Pune Call Girls Moshi WhatSapp Number 8005736733 With Elite Staff And Re...SUHANI PANDEY
ย 
Call Girls Service Pune โ‚น7.5k Pick Up & Drop With Cash Payment 8005736733 Cal...
Call Girls Service Pune โ‚น7.5k Pick Up & Drop With Cash Payment 8005736733 Cal...Call Girls Service Pune โ‚น7.5k Pick Up & Drop With Cash Payment 8005736733 Cal...
Call Girls Service Pune โ‚น7.5k Pick Up & Drop With Cash Payment 8005736733 Cal...SUHANI PANDEY
ย 
Environmental Science - Nuclear Hazards and Us.pptx
Environmental Science - Nuclear Hazards and Us.pptxEnvironmental Science - Nuclear Hazards and Us.pptx
Environmental Science - Nuclear Hazards and Us.pptxhossanmdjobayer103
ย 
Call Girls Talegaon Dabhade Call Me 7737669865 Budget Friendly No Advance Boo...
Call Girls Talegaon Dabhade Call Me 7737669865 Budget Friendly No Advance Boo...Call Girls Talegaon Dabhade Call Me 7737669865 Budget Friendly No Advance Boo...
Call Girls Talegaon Dabhade Call Me 7737669865 Budget Friendly No Advance Boo...roncy bisnoi
ย 
Plastic Bank Beyond EPR - Sustainability Programs
Plastic Bank Beyond EPR - Sustainability ProgramsPlastic Bank Beyond EPR - Sustainability Programs
Plastic Bank Beyond EPR - Sustainability Programsitadmin50
ย 
Call Girls Ramtek Call Me 7737669865 Budget Friendly No Advance Booking
Call Girls Ramtek Call Me 7737669865 Budget Friendly No Advance BookingCall Girls Ramtek Call Me 7737669865 Budget Friendly No Advance Booking
Call Girls Ramtek Call Me 7737669865 Budget Friendly No Advance Bookingroncy bisnoi
ย 
celebrity ๐Ÿ’‹ Kanpur Escorts Just Dail 8250092165 service available anytime 24 ...
celebrity ๐Ÿ’‹ Kanpur Escorts Just Dail 8250092165 service available anytime 24 ...celebrity ๐Ÿ’‹ Kanpur Escorts Just Dail 8250092165 service available anytime 24 ...
celebrity ๐Ÿ’‹ Kanpur Escorts Just Dail 8250092165 service available anytime 24 ...Call Girls in Nagpur High Profile
ย 
VIP Model Call Girls Wagholi ( Pune ) Call ON 8005736733 Starting From 5K to ...
VIP Model Call Girls Wagholi ( Pune ) Call ON 8005736733 Starting From 5K to ...VIP Model Call Girls Wagholi ( Pune ) Call ON 8005736733 Starting From 5K to ...
VIP Model Call Girls Wagholi ( Pune ) Call ON 8005736733 Starting From 5K to ...SUHANI PANDEY
ย 
DENR EPR Law Compliance Updates April 2024
DENR EPR Law Compliance Updates April 2024DENR EPR Law Compliance Updates April 2024
DENR EPR Law Compliance Updates April 2024itadmin50
ย 
Get Premium Hoskote Call Girls (8005736733) 24x7 Rate 15999 with A/c Room Cas...
Get Premium Hoskote Call Girls (8005736733) 24x7 Rate 15999 with A/c Room Cas...Get Premium Hoskote Call Girls (8005736733) 24x7 Rate 15999 with A/c Room Cas...
Get Premium Hoskote Call Girls (8005736733) 24x7 Rate 15999 with A/c Room Cas...MOHANI PANDEY
ย 
VIP Model Call Girls Hadapsar ( Pune ) Call ON 8005736733 Starting From 5K to...
VIP Model Call Girls Hadapsar ( Pune ) Call ON 8005736733 Starting From 5K to...VIP Model Call Girls Hadapsar ( Pune ) Call ON 8005736733 Starting From 5K to...
VIP Model Call Girls Hadapsar ( Pune ) Call ON 8005736733 Starting From 5K to...SUHANI PANDEY
ย 
Call Girls Moshi Call Me 7737669865 Budget Friendly No Advance Booking
Call Girls Moshi Call Me 7737669865 Budget Friendly No Advance BookingCall Girls Moshi Call Me 7737669865 Budget Friendly No Advance Booking
Call Girls Moshi Call Me 7737669865 Budget Friendly No Advance Bookingroncy bisnoi
ย 
๐Ÿ’š๐Ÿ˜‹ Mathura Escort Service Call Girls, 9352852248 โ‚น5000 To 25K With AC๐Ÿ’š๐Ÿ˜‹
๐Ÿ’š๐Ÿ˜‹ Mathura Escort Service Call Girls, 9352852248 โ‚น5000 To 25K With AC๐Ÿ’š๐Ÿ˜‹๐Ÿ’š๐Ÿ˜‹ Mathura Escort Service Call Girls, 9352852248 โ‚น5000 To 25K With AC๐Ÿ’š๐Ÿ˜‹
๐Ÿ’š๐Ÿ˜‹ Mathura Escort Service Call Girls, 9352852248 โ‚น5000 To 25K With AC๐Ÿ’š๐Ÿ˜‹nirzagarg
ย 
(NEHA) Call Girls Navi Mumbai Call Now 8250077686 Navi Mumbai Escorts 24x7
(NEHA) Call Girls Navi Mumbai Call Now 8250077686 Navi Mumbai Escorts 24x7(NEHA) Call Girls Navi Mumbai Call Now 8250077686 Navi Mumbai Escorts 24x7
(NEHA) Call Girls Navi Mumbai Call Now 8250077686 Navi Mumbai Escorts 24x7Call Girls in Nagpur High Profile Call Girls
ย 
VVIP Pune Call Girls Vishal Nagar WhatSapp Number 8005736733 With Elite Staff...
VVIP Pune Call Girls Vishal Nagar WhatSapp Number 8005736733 With Elite Staff...VVIP Pune Call Girls Vishal Nagar WhatSapp Number 8005736733 With Elite Staff...
VVIP Pune Call Girls Vishal Nagar WhatSapp Number 8005736733 With Elite Staff...SUHANI PANDEY
ย 
CSR_Tested activities in the classroom -EN
CSR_Tested activities in the classroom -ENCSR_Tested activities in the classroom -EN
CSR_Tested activities in the classroom -ENGeorgeDiamandis11
ย 
Introduction to heat waves and Heatwaves in Bangladesh.pptx
Introduction to heat waves and Heatwaves in Bangladesh.pptxIntroduction to heat waves and Heatwaves in Bangladesh.pptx
Introduction to heat waves and Heatwaves in Bangladesh.pptxNazmusSakibNS
ย 

Recently uploaded (20)

RA 7942:vThe Philippine Mining Act of 1995
RA 7942:vThe Philippine Mining Act of 1995RA 7942:vThe Philippine Mining Act of 1995
RA 7942:vThe Philippine Mining Act of 1995
ย 
Deforestation
DeforestationDeforestation
Deforestation
ย 
VIP Model Call Girls Chakan ( Pune ) Call ON 8005736733 Starting From 5K to 2...
VIP Model Call Girls Chakan ( Pune ) Call ON 8005736733 Starting From 5K to 2...VIP Model Call Girls Chakan ( Pune ) Call ON 8005736733 Starting From 5K to 2...
VIP Model Call Girls Chakan ( Pune ) Call ON 8005736733 Starting From 5K to 2...
ย 
VVIP Pune Call Girls Moshi WhatSapp Number 8005736733 With Elite Staff And Re...
VVIP Pune Call Girls Moshi WhatSapp Number 8005736733 With Elite Staff And Re...VVIP Pune Call Girls Moshi WhatSapp Number 8005736733 With Elite Staff And Re...
VVIP Pune Call Girls Moshi WhatSapp Number 8005736733 With Elite Staff And Re...
ย 
Call Girls Service Pune โ‚น7.5k Pick Up & Drop With Cash Payment 8005736733 Cal...
Call Girls Service Pune โ‚น7.5k Pick Up & Drop With Cash Payment 8005736733 Cal...Call Girls Service Pune โ‚น7.5k Pick Up & Drop With Cash Payment 8005736733 Cal...
Call Girls Service Pune โ‚น7.5k Pick Up & Drop With Cash Payment 8005736733 Cal...
ย 
Environmental Science - Nuclear Hazards and Us.pptx
Environmental Science - Nuclear Hazards and Us.pptxEnvironmental Science - Nuclear Hazards and Us.pptx
Environmental Science - Nuclear Hazards and Us.pptx
ย 
Call Girls Talegaon Dabhade Call Me 7737669865 Budget Friendly No Advance Boo...
Call Girls Talegaon Dabhade Call Me 7737669865 Budget Friendly No Advance Boo...Call Girls Talegaon Dabhade Call Me 7737669865 Budget Friendly No Advance Boo...
Call Girls Talegaon Dabhade Call Me 7737669865 Budget Friendly No Advance Boo...
ย 
Plastic Bank Beyond EPR - Sustainability Programs
Plastic Bank Beyond EPR - Sustainability ProgramsPlastic Bank Beyond EPR - Sustainability Programs
Plastic Bank Beyond EPR - Sustainability Programs
ย 
Call Girls Ramtek Call Me 7737669865 Budget Friendly No Advance Booking
Call Girls Ramtek Call Me 7737669865 Budget Friendly No Advance BookingCall Girls Ramtek Call Me 7737669865 Budget Friendly No Advance Booking
Call Girls Ramtek Call Me 7737669865 Budget Friendly No Advance Booking
ย 
celebrity ๐Ÿ’‹ Kanpur Escorts Just Dail 8250092165 service available anytime 24 ...
celebrity ๐Ÿ’‹ Kanpur Escorts Just Dail 8250092165 service available anytime 24 ...celebrity ๐Ÿ’‹ Kanpur Escorts Just Dail 8250092165 service available anytime 24 ...
celebrity ๐Ÿ’‹ Kanpur Escorts Just Dail 8250092165 service available anytime 24 ...
ย 
VIP Model Call Girls Wagholi ( Pune ) Call ON 8005736733 Starting From 5K to ...
VIP Model Call Girls Wagholi ( Pune ) Call ON 8005736733 Starting From 5K to ...VIP Model Call Girls Wagholi ( Pune ) Call ON 8005736733 Starting From 5K to ...
VIP Model Call Girls Wagholi ( Pune ) Call ON 8005736733 Starting From 5K to ...
ย 
DENR EPR Law Compliance Updates April 2024
DENR EPR Law Compliance Updates April 2024DENR EPR Law Compliance Updates April 2024
DENR EPR Law Compliance Updates April 2024
ย 
Get Premium Hoskote Call Girls (8005736733) 24x7 Rate 15999 with A/c Room Cas...
Get Premium Hoskote Call Girls (8005736733) 24x7 Rate 15999 with A/c Room Cas...Get Premium Hoskote Call Girls (8005736733) 24x7 Rate 15999 with A/c Room Cas...
Get Premium Hoskote Call Girls (8005736733) 24x7 Rate 15999 with A/c Room Cas...
ย 
VIP Model Call Girls Hadapsar ( Pune ) Call ON 8005736733 Starting From 5K to...
VIP Model Call Girls Hadapsar ( Pune ) Call ON 8005736733 Starting From 5K to...VIP Model Call Girls Hadapsar ( Pune ) Call ON 8005736733 Starting From 5K to...
VIP Model Call Girls Hadapsar ( Pune ) Call ON 8005736733 Starting From 5K to...
ย 
Call Girls Moshi Call Me 7737669865 Budget Friendly No Advance Booking
Call Girls Moshi Call Me 7737669865 Budget Friendly No Advance BookingCall Girls Moshi Call Me 7737669865 Budget Friendly No Advance Booking
Call Girls Moshi Call Me 7737669865 Budget Friendly No Advance Booking
ย 
๐Ÿ’š๐Ÿ˜‹ Mathura Escort Service Call Girls, 9352852248 โ‚น5000 To 25K With AC๐Ÿ’š๐Ÿ˜‹
๐Ÿ’š๐Ÿ˜‹ Mathura Escort Service Call Girls, 9352852248 โ‚น5000 To 25K With AC๐Ÿ’š๐Ÿ˜‹๐Ÿ’š๐Ÿ˜‹ Mathura Escort Service Call Girls, 9352852248 โ‚น5000 To 25K With AC๐Ÿ’š๐Ÿ˜‹
๐Ÿ’š๐Ÿ˜‹ Mathura Escort Service Call Girls, 9352852248 โ‚น5000 To 25K With AC๐Ÿ’š๐Ÿ˜‹
ย 
(NEHA) Call Girls Navi Mumbai Call Now 8250077686 Navi Mumbai Escorts 24x7
(NEHA) Call Girls Navi Mumbai Call Now 8250077686 Navi Mumbai Escorts 24x7(NEHA) Call Girls Navi Mumbai Call Now 8250077686 Navi Mumbai Escorts 24x7
(NEHA) Call Girls Navi Mumbai Call Now 8250077686 Navi Mumbai Escorts 24x7
ย 
VVIP Pune Call Girls Vishal Nagar WhatSapp Number 8005736733 With Elite Staff...
VVIP Pune Call Girls Vishal Nagar WhatSapp Number 8005736733 With Elite Staff...VVIP Pune Call Girls Vishal Nagar WhatSapp Number 8005736733 With Elite Staff...
VVIP Pune Call Girls Vishal Nagar WhatSapp Number 8005736733 With Elite Staff...
ย 
CSR_Tested activities in the classroom -EN
CSR_Tested activities in the classroom -ENCSR_Tested activities in the classroom -EN
CSR_Tested activities in the classroom -EN
ย 
Introduction to heat waves and Heatwaves in Bangladesh.pptx
Introduction to heat waves and Heatwaves in Bangladesh.pptxIntroduction to heat waves and Heatwaves in Bangladesh.pptx
Introduction to heat waves and Heatwaves in Bangladesh.pptx
ย 

36. om prekash

  • 1. 227 Journal of Global Resources Volume 6 (01) August 2019-January 2020 Page 227-232 UGCโ€“CARE Listed Journal in Group D ISSN: 2395-3160 (Print), 2455-2445 (Online) 36 CHANGING SCENARIO OF LIVESTOCK IN SELECTED DISTRICTS OF RAJASTHAN Om Prakash Assistant Professor, Department of Geography, JNV University Jodhpur (Rajasthan) Email: oprjnvu@gmail.com Abstract: Livestock population and productivity is greatly influenced by climatic conditions. The climate has a significant impact not only on cattle but also on other livestock. Along with climate livestock are also get influenced by the availability of good soil/land and rainfall supply. Rajasthan is a state of fluctuating local distinctiveness of land and climate. The cattle population of Rajasthan shows variations in different districts. As per the reports, Rajasthan and other parts country display poor livestock production. This article analyses the livestock of Total three districts with the help of study of total livestock available in these districts in different years since 1961 to 2012 including all the data for separate districts. The data is collected for different livestock that includes Cattle, Buffalo, Sheep, Goat, Horses & Ponies, Donkey, Camel and others. Introduction The rural population of India consists of more than 70 percent. Hence, probably land is pressurized more as almost the entire village population relies on agriculture, resulting in an unfavorable landman ratio. Merely agriculture cannot provide gainful employment to all the rural areas as the population is exploding resulting in the increasing pressure on land. Thus, allied activities like animal husbandry can be considered as an effective instrument for supplementing the income and providing employment to the weaker sections in rural areas. Domesticated animals are prominently known as โ€œlive banksโ€, are the significant contributors to our national wealth and therefore help in enhancing the living standards of rural people. The livestock population in Rajasthan has increased from 255.16 lacs in 1951 to 577.32 lacs; about 11.27 percent of Livestock population of country is available in Rajasthanโ€. In this way animal husbandry remains the Prime occupation in Rajasthan. 19th Enumeration of livestock was done in 2012 when the number of total domestic animal found to be 577.32 lacs and their density was 169 per sq. km. livestock sector provide consistent growth rate of over 6 percent per annum round the year employment opportunity with more than 50 percent of total house hold income in arid region as against national average of 22.5 percent and produce 11 percent milk, 30 percent wool and10 percent meat of the country. Rajasthan has Rank 1st in wool production, Rank 1st in live meat animals (goat, sheep, and buffalo) to the tune of about 40,000 heads per day Rank 2nd in milk production in country more than 80 percent rural households keep animals which continue to provide subsistence income during scarcity. In the arid and semi-arid zone livestock rearing is the primary occupation and the principal source of livelihood for the people and is only next to agriculture in importance. The study area (Jodhpur, Barmer and Nagaur Districts) is main part of this zone and has 12.60 percent of Rajasthanโ€™s total livestock. Barmer is one of leading district in having largest number of sheep (14.04lacs) goats (28.96 lacs), Horses (2591), donkeys and pony (17495), camels (43172) and total livestock (53.66lakh) according to 19th livestock census 2012. Study area is comparatively dry, rainless, hot and water scarcity area due to which the animal which can either survive on small quantity of water like sheep goats or prolong their life cycle for a longest period without water like camels and donkeys, livestock is the major source of livelihood for study area. Study Area The study area includes - Barmer, Jodhpur and Nagaur districts located between 24O 58' and 27O 40' North latitude and 70O 5' and 75O 15' East longitude. The study area is bounded on the north by Churu and Bikaner districts on the east by Sikar, Jaipur and Ajmer districts, on the south by Pali, Jalore districts and Gujrat state and on the west Jaisalmer district. The total geographical area of study area is 68,955 square kilometre.
  • 2. 228 Present Scenario of Livestock Rajasthan is majorly driven by the Service sector but farming and allied activities are still major sources of livelihood in villages. Livestock is the primary vocation of Rajasthan as 61.1 percent of the aggregate area is desert. The 19th Livestock census, 2012 (GOI, 2014) stated that one of the biggest livestock in the world is that of India with a holding of 11.6 percent of world livestock population which consists buffaloes (57.83 percent), cattle (15.06 percent), sheep (7.14 percent), goats (17.93 percent), camel (2.18 percent), equine (1.3 percent), pigs (1.2 percent), chickens (4.72 percent) and ducks (1.94 percent). India possesses a huge livestock population of 512 million nos. This mainly includes cattle, buffaloes, goats, sheep, and pigs. There was a decrease of 33 percent of the livestock population in India as compared to the previous census. The cattle, buffalo, sheep, goat, pig, and others contribute 37.28, 21.23, 12.71, 26.4, 2.01 and 0.5 percent, respectively in total livestock population. The livestock population India has substantially increased in Gujarat (15.36 percent), Uttar Pradesh (14.01 percent), Assam (10.77 percent), Punjab (9.57 percent), Bihar (8.56 percent), Sikkim (7.96 percent), Meghalaya (7.41 percent) and Chhattisgarh (4.34 percent). Adeline has been noted in the population of cattle, sheep, goats, and pigs by 4.1, 9.07, 3.82 and 7.54 percent, respectively while the population of buffalo and poultry increased by 3.19 and 19 percent, respectively in the last inter-censual period. A significant increase of 20.18 percent has been registered in the Exotic and crossbred cattle population while the indigenous cattle diminished by 8.94 percent. 729.21 million the total poultry population of India, which includes 692.65, 23.54 and 13.02 million chickens, duck and turkeys & other poultry, respectively There is a growth trend in total poultry population quite more as compared to the total livestock population (Islam, Anjum, Modi & Wadhwani, 2016) as per the observation. Objectives ๏‚ท Analyze the livestock population structure geographically. ๏‚ท To analyze the role of livestock in balancing against risks. ๏‚ท To identify the effect of modernization on livestock scenario.
  • 3. 229 Research Methodology The study area โ€œJodhpur, Barmer and Nagaurโ€ district is quite backward in socio โ€“ economic status as it lies in Western arid Rajasthan where people are chiefly engaged in livestock occupation. This geographical study aims at analysing present scenario of livestock which has emerged as one of the key components of agriculture growth in arid region in recent years. Causal research is conducted in order to identify the extent and nature of cause-and-effect relationships. Sampling Procedure The present study is confined to study of secondary data for the livestock population of Barmer, Nagaur and Jodhpur districts of Rajasthan and the factors affecting livestock productivity and livestock occupation of rural people of the three districts. Data Analysis Table 01: Density of Livestock in Barmer, Jodhpur and Nagaur Year Area of (B+J+N) Cattle Density Buffalo Density Sheep Density Goat Density Horses & Ponies Density Donkey Density Camel Density Other Density Total Livestock Density 1961 68525.5 74 9.70 65 62 0.27 1.32 5.8 0.048 218 1966 68525.5 84 10.65 91 79 0.23 1.29 7.3 0.059 273 1972 68738 58 10.30 95 110 0.14 1.33 8.5 0.100 283 1977 68738 70 13.86 122 113 0.18 2.03 9.0 0.114 331 1983 68955 74 17.52 160 139 0.14 2.19 8.3 0.233 401 1988 68955 49 16.94 100 96 0.15 1.52 6.9 0.400 271 1992 68955 63 24.68 143 110 0.11 2.16 8.6 0.653 391 1997 68955 76 37.26 194 184 0.13 2.13 7.5 0.716 502 2003 68955 62 58.35 118 158 0.15 1.48 4.7 1.021 404 2007 68955 71 41.47 135 214 0.14 1.06 4.0 0.281 468 2012 68955 93 52.32 114 259 0.29 0.90 2.9 0.469 524 Source: livestock census reports 1961-2012, Board of Revenue Ajmer * Population Density of livestock = Number of Livestock/Land Area. Table 1 shows the combined density of livestock in all the three districts taken for study viz. Barnmer, Nagaur and Jodhpur district. From above table it is quite evident that Goat density (259) and Sheep density (114) are highest followed by cattle density at the third place. We have already seen in the separate analysis of livestock densities of the three districts that goat, cattle and sheep are the highly maintained live stocks in the three districts. Also from the table it is clear that total livestock density from 1961 to 2012 is mainly increasing with only two declines noticed in the year 1988 and 2003. Thus the total livestock is witnessing an increase during the time period under consideration. To find the significance growth of livestock population in Barmer, Jodhpur and Nagaur districts during the period of 1961 to 2012 following hypothesis has been formulated and tested with the help of regression analysis. Table 02: Statistics for Livestock in Barmer, Jodhpur and Nagaur Category N Mean Std. Deviation Std. Error Mean Cattle 11 70.36 12.209 3.681 Buffalos 11 26.64 17.753 5.353 Sheep 11 121.55 35.691 10.761 Goat 11 138.55 60.120 18.127 Horses & Ponies 11 .18 .060 .018 Donkey 11 1.58 .466 .141 Camel 11 6.68 2.056 .620 Other 11 .37 .316 .095 Total 11 369.6364 102.32524 30.85222 Source: calculated by author H01:- There is no significant growth of Livestock population in Barmer, Jodhpur and Nagaur district during the period of 1961 to 2012. H1:- There is a significant growth of Livestock population in Barmer, Jodhpur and Nagaur district during the period of 1961 to 2012.
  • 4. 230 Table 2 presented the mean, standard deviation with standard error mean has been given in the table. Table above depicts that the mean score value of the Cattle (70.36 ยฑ 12.209), Buffalos (26.64 ยฑ 17.753), Sheep (121.55 ยฑ 35.691), Goat (138.55 ยฑ 60.12), Horses & Ponies (0.18 ยฑ 0.06), Donkey (1.58 ยฑ 0.466), Camel (6.68 ยฑ 2.056), other (0.37 ยฑ 0.316) and Total (369.6364 ยฑ 102.32524). Table 03: Regression for Livestock in Barmer, Nagaur and Jodhpur ANOVA a Model Sum of Squares Df Mean Square F Sig. 1 Regression 2789.383 9 309.931 4.104 .0367 b Residual 75.526 1 75.526 Total 2864.909 10 a. Dependent Variable: Year b. Predictors: (Constant), Total, Donkey, Cattle, Other, Horses ponies, Camel, Sheep, Buffalos, Goat Source: calculated by author Table 3 indicates that the regression model predicts the dependent variable significantly well. Here, p =.03367, which is less than 0.05, and indicates that, overall, the regression model statistically significantly predicts the outcome variable (i.e., it is a good fit for the data). The Coefficients table provides us with the necessary information to predict livestock from year, as well as determine whether livestock contributes statistically significantly to the model (by looking at the "Sig." column). The significant value is less than 0.05 (p value). This means we have to reject the null hypothesis and accept the alternative hypothesis that there is a significant growth of Livestock population in Barmer, Nagaur and Jodhpur district during the period of 1961 to 2012. Thus during last 5 decades livestock has grown up to a significant level due to the combined efforts made by government and rural people. To find the trend line equations and predicted values and also for their regression analysis following table and graphs are used; Table 04: Trend Line Equation and Predicted Value of Cattle in Barmer, Jodhpur and Nagaur Source: Livestock census reports 1961-2012, Board of Revenue, Ajmer Above table represents the cattle density for years ranging from period of 1961 to 2012, the cattle population of Barmer, Nagaur and Jodhpur district along with its corresponding predicted value is also shown. The predicated value is calculated on the basis of following trend line equation; Y = 0.0826X - 93.76652 Where Y= predicted value and X= year A trend line is a line drawn on a chart based on data points on the chart and which helps to determine a trend and help make trading decisions. Trend lines are commonly used to decide entry and exit timing when trading securities. Trend lines are an important tool in technical analysis for both trend identification and confirmation. It is a straight line that connects two or more variable points and then extends into the future to act as a line of support or resistance. Uptrend Line An uptrend line displays a positive slope and is formed simply by joining two or more low points. To have a positive slope the second low must be higher than the first one for a Year Area of B+J+N Cattle Density Predicted Values (Y=0.0826X - 93.76652) 1961 68525.5 74 68.212 1966 68525.5 84 68.625 1972 68738 58 69.121 1977 68738 70 69.534 1983 68955 74 70.029 1988 68955 49 70.442 1992 68955 63 70.773 1997 68955 76 71.186 2003 68955 62 71.681 2007 68955 71 72.012 2012 68955 93 72.425
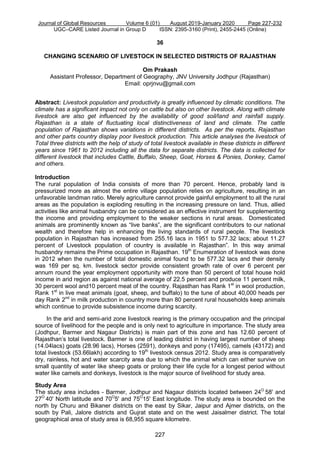
  • 5. 231 line to have a positive slope. Uptrend lines act as support and indicate that net-increase (increase in livestock) is increasing even as the year wise distribution displaying fluctuations. Downtrend Line A downtrend line shows a negative slope and is formed merely by joining two or more high points. Here in this case the second high must be lower than the first for the line to have a negative slope. Downtrend lines act as resistance, and indicate that net-increase (increase in livestock) is decreasing even as the time increasing. Graph 01: Trend Line Equation and Predicted Value of Cattle in Barmer, Jodhpur and Nagaur Source: Calculated by author R-squared is a statistical measure of how close the data are to the fitted trend line. Just by looking at the regression line running up through the data, predictions can be done. For 2012, it looks like the line will be somewhere between 80 and 100 cattle density! That might be โ€œgood enoughโ€, but regression also gives a useful equation, which for this chart is: Y = 0.0826X - 93.76652 What that means is, we can plug in an x value (the year) and get a pretty good estimate of cattle density for any year. For example, 2007: Y = 0.0826(2007) - 93.76652= 74.018 density, which is exactly same as the actual figure of 72.012 cattle density for that year. Best of all, we can use the equation to make predictions. For example, how much cattle density will grow in 2017? Y = 0.0826(2017) - 93.76652= 93.76 cattle density. Regression also gives an R squared value, which for this graph is 1. This number tells how good the model is. The values range from 0 to 1, with 0 being a terrible model and 1 being a perfect model. As it can be probably seen, 1 is a fairly an excellent model so it can be fairly confident in cattle density prediction! Furthermore the trend line here has a positive slope showing an uptrend line but with a very little slope displaying very less increase in net cattle density value for the course of time and an increase in this value can also be predicted for the future. Thus to make the increment in density significant combined effort needs to be made by the govt. as well as rural people. Also it can be easily interpreted from the graph that cattle density is witnessing regular fluctuations. From 1961 to 2012 cattle density can be viewed as fluctuating due to the vulnerable climatic conditions of Barmer, Nagaur and Jodhpur districts. Regression also gives an R squared value, which for this graph is 1. This number tells how good the model is. The values range from 0 to 1, with 0 being a terrible model and 1 being a perfect model. As it can probably be viewed, 1 is a fairly an excellent model so it can be fairly confident in total livestock density prediction. Results show the combined density of livestock in all the three districts taken for study viz. Barmer, Nagaur and Jodhpur districts that Goat density and Sheep density are highest followed by cattle density at the third place. Additionally the trend line for total livestock has a positive slope showing an uptrend line displaying increase in net total livestock density value for the course of time and also for the future. Also it can be viewed from the graph 74 84 58 70 74 49 63 76 62 71 93 y = 0.0826x - 93.767 Rยฒ = 1 0 20 40 60 80 100 1950 1960 1970 1980 1990 2000 2010 2020 Cattle Density Predicted Values (Y = 0.0826X - 93.76652) Linear (Predicted Values (Y = 0.0826X - 93.76652))
  • 6. 232 that total livestock density in Barmer, Nagaur and Jodhpur district from the year 1961 to 2012 is on an increasing trend with the lowest density recorded in the year 1988 and 2003. Conclusion The study of Changing Livestock scenario in Jodhpur, Barmer and Nagaur districts was proved as important as Rajasthan is the largest state of India gifted with big livestock production and the significance of agriculture and allied sector in the state gross domestic product is considerably higher. Livestock was thus successfully proved to be life saviour in much distress, especially in case of drought in the study area. Livestock provides a potentially significant source of diversified income to smallholder operating in the difficult climatic condition in the three districts under observation. Through this study significance and development of livestock and specific approaches for the growth of the livestock were identified. References 1. 19th Indian livestock census All India Summery Report (2013) Govt. of India Ministry of agriculture department of Animal husbandry and dairying โ€“ New Delhi. 2. Abhichandani and Ghosh, P.K. (1986) โ€œAnimal husbandry in Arid zone environment In: Desert environment conservation and management (Ed.) โ€“ CAZRI 3. Annual Report 2012-13 Department of animal husbandry dairying and fisheries ministry of agriculture, Govt .of India โ€“ New Delhi. 4. Annual Report. (2011-12) Department of Animal Husbandry, Dairying, and Fisheries. Ministry of Agriculture, Govt. of India, New Delhi. (http://www.ijset.net/journal/956.pdf) 5. Baba, S.H., Wani, M.H. and Zargar, B.A. (2011) Dynamics and sustainability of the livestock sector in Jammu & Kashmir., Agric. Econ. Res. Rev., 24: 119-132 6. Census Reports of Barmer, Jodhpur and Nagaur District 2012 7. Chander, M., Kumar, S., Rathore, R. S., Mukherjee, R., Kondaiah, N., & Pandey, H. N. (2007) Organic vis-a-vis Conventional livestock production potential in India. In Papers submitted to the International Conference on Organic Agriculture and Food Security, FAO, Rome, Italy (pp. 48-49). 8. Gupta, Shweta- Livestock Revolution in India: Issues and Impacts on Small Scale Producers 9. http://animalhusbandry.rajasthan.gov.in/livestock_census.aspx 10. https://www.researchgate.net 11. Islam, M. M., Anjum, S., Modi, R. J., & Wadhwani, K. N. (2016) The scenario of livestock and poultry in India and their contribution to the national economy. International Journal of Science, Environment and Technology, 5(3), 956-65. 12. Kohler-Rollefson, I. (2001) The livestock revolution and organic animal husbandry. EcolFmg, 27, 10-11. 13. Kumar, A. (2010) Exports of Livestock Products from India: Performance, Competitiveness, and Determinants. Agricultural Economics Research Review, 23(1). 14. National Accounts Division. Central Statistical Office. Ministry of statistics and programme implementation. 15. Prabhu, M., Kumar, G. S., Pandian, A., Selvakumar, K. N., & Jayavarathan, B. (2012) Dynamics of livestock population-India vis-ร -vis Tamil Nadu. 16. Raut, K. C. (2006) Research Priorities in Livestock Statistics. J. Ind. Soc. Agril. Statist, 60(1), 16-26. 17. Soju, S., & Meena, G. L. (2017) Dynamics of livestock population and output in Rajasthan: A temporal analysis. Journal of Animal Research, 7(2), 345.