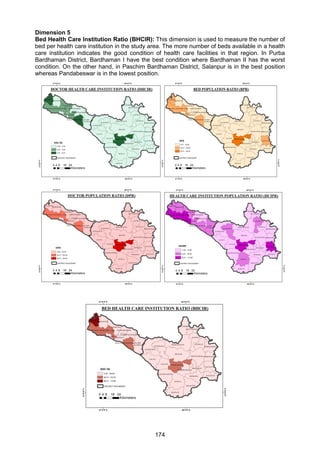
The document analyzes health care facility systems in Purba and Paschim Bardhaman districts of West Bengal, India. It identifies five dimensions to measure health care facilities: health care institution to population ratio, bed to population ratio, doctor to population ratio, doctor to health care institution ratio, and bed to health care institution ratio. It calculates these ratios for blocks in both districts and finds that Bardhaman-I block generally has the best ratios, while blocks like Pandabeswar typically have the worst. The analysis reveals disparities in health care access across the two districts.
VVIP Pune Call Girls Koregaon Park (7001035870) Pune Escorts Nearby with Comp...
ย
27. airtra basak and saddique
1. 170
Journal of Global Resources Volume 6 (01) August 2019-January 2020 Page 170-178
UGCโCARE Listed Journal in Group D ISSN: 2395-3160 (Print), 2455-2445 (Online)
27
AN ANALYSIS OF HEALTH CARE FACILITY SYSTEMS IN PURBA AND PASCHIM
BARDHAMAN DISTRICTS, WEST BENGAL, INDIA
Aritra Basakยน and Giyasuddin Siddiqueยฒ
ยนResearch Scholar, ยฒProfessor,
Department of Geography, The University of Burdwan, Burdwan, India
Email: gsbu2008@gmail.com, basakaritra5@gmail.com
Abstract: Human health has been globally considered as one of the key indicators of Human
Development. The general health condition of the people of an area is indicative of the quality
of the health care facilities available in that area. The present study strives to analyse different
dimensions of health care facilities to find out the status of health care system of the Purba and
Paschim Bardhaman Districts of West Bengal, India. To do so, Health Care Facility Index
(HCFI) has been measured to appraise the overall health care condition of these two districts.
The Paschim Bardhaman District has revealed comparatively better average HCFI value (0.34)
than the Purba Bardhaman District (0.13).
Key words: Dimension Index, Health, Health-care Facility, Human Development.
Introduction
In 1948, the World Health Organization (WHO) defined health as โHealth is a state of complete
physical, mental and social well-being and not merely the absence of diseases or infirmityโ
(WHO Constitution). In 1986, WHO redefined health as โA resource for everyday life, not the
objective of living. Health is a positive concept emphasizing social and personal resources, as
well as physical capacitiesโ (World Health Organization). This indicates that health is a
resource to support an individualโs activities in society (Husain, 1994). A healthy way of life
provides the means to direct a full life (Mishra, 2007). Health care system or health care
facilities of a region are obviously influenced by its social and economic conditions (Billings et
al., 1993; Bindman et al., 1995; Mishra, 2007; Anthamatten and Hazen, 2011). Health Care
Facilities vary across countries, communities and individuals (Joshi, 1997; Krishan, 2001;
Singh, 2006; Debapriya and Mahanti, 2000 and 2006; Meade and Earickson, 2006; Singh,
2006). Health Care Systems are the organizations or institutions established to provide health
care to the needy people (King and Crews, 2013). As per World Health Organization (WHO), a
good health care system deliver quality services to all the people when they need them and it
needs a well-trained workforce, well maintained health facilities to deliver quality medicines and
treatment (World Health Organization) A well-developed health care system can enhance a
countryโs economic conditions and overall well-being of its citizens (Lakshminarayanan, 2011;
Verma et all, 2018). Health care is considered as an important factor to promote the general
health and well-being of people across the globe. The present study is an endeavour to analyse
the Block wise health care facility system of Purba and Paschim Bardhaman District of West
Bengal.
Study Area
In the present study 23 C.D. Blocks in Purba Bardhaman and 8 C.D. Blocks and 2 Municipal
Corporation (M.C.) in Paschim Bardhaman has been considered for area under investigation.
The Geographical co-ordinates of the area thus delimited extend from 22ยบ56ยด North to 23ยบ53ยด
North latitudes and 86ยบ48ยด East to 88ยบ25ยด East longitudes (Bengal District Gazetteers, 1997).
Objectives
The main objectives of this study are:
1. To find out the Block wise disparity of Health Care Facility (HCF) of Purba and Paschim
Bardhaman District and
2. To make the study more in depth with formulation a composite index i.e., Health Care
Facility Index (HCFI) has been done and try to find the Blockโs positions within the
District.
2. 171
Figure 01: Location Map
Database
The study has been conducted on the basis of the secondary database collected from Census
of India, 2011 and District Statistical Handbook of Bardhaman, 2014. Total population of
Bardhaman, Memari, Kalna, Katwa, Dainhat and Gushkara Municipalities has been added to
the populations of respective C.D. Blocks in Purba Bardhaman District. All the Hospitals
including Rural Hospitals, Block Primary Health Centers (BPHC), Primary Health Centers
(PHC), other clinical Departments of Govt. of West Bengal including State Govt. Undertakings,
Local Bodies, and Govt. of India including Central Govt. undertaking, N.G.O. / Private Bodies
(Nursing Homes) have been considered as Health Care Institutions (HCI). Total number of
beds and total number of Doctors of each C. D. Blocks have been collected from District
Statistical Handbook of Bardhaman, 2014.
Methodology
The methodological steps followed in the present study are:
1. Identification of the Dimensions of Health Care Facility system.
2. Calculation of the identified Dimensions as indices (๐ ๐).
3. The Health Care Facility Index (HCFI) is calculated and analysed for the period of study.
In the present study, five dimensions have been selected to measure the extent of Health Care
Facility System. At first, Health Care Facility System of Purba and Paschim Bardhaman
Districts have been analysed on the basis of secondary data collected from District Statistical
Handbook, Bardhaman, 2014. Five basic Dimensions i.e., Health Care Institution Population
Ratio (HCIPR), Bed Population Ratio (BPR), Doctor Population Ratio (DPR), Doctor Health
Care Institution Ratio (DHCIR) and Bed Health Care Institution Ratio (BHCIR) of Health Care
Facility System have been identified and calculated using the following formulae.
Health Care Institution (HCI) ร 1, 00,000
HCIPR = ----------------------------------------------------------
Total Population โฆโฆโฆโฆโฆโฆโฆโฆโฆโฆโฆโฆโฆ (i)
Number of Bed in HCI ร 10,000
BPR = -------------------------------------------------
Total Population โฆโฆโฆโฆโฆโฆโฆโฆโฆโฆโฆโฆโฆโฆโฆโฆโฆ (ii)
Number of Doctor in HCI ร 1, 00,000
DPR = --------------------------------------------------
Total Population โฆโฆโฆโฆโฆโฆโฆโฆโฆโฆโฆโฆโฆโฆโฆโฆ.. (iii)
3. 172
Number of Doctor in HCI
DHCIR = -----------------------------------------------
Health Care Institution (HCI) โฆโฆโฆโฆโฆโฆโฆโฆโฆโฆโฆโฆโฆโฆโฆโฆ.. (iv)
Number of Bed in HCI
BHCIR = ---------------------------------------------
Health Care Institution (HCI) โฆโฆโฆโฆโฆโฆโฆโฆโฆโฆโฆโฆโฆโฆโฆโฆ... (v)
Table 01: Health Care Facilities of Purba Bardhaman
# C. D. Blocks
Total Population
(2011)
Health Care Delivery System
Health Care
Institution (HCI)
Total No. of
Beds
Total No. of
Doctors
1 Ausgram-I 154751 8 136 14
2 Ausgram-II 150896 6 39 7
3 Galsi-I 187588 6 53 7
4 Galsi-II 147177 3 29 3
5 Bardhaman-I 530208 66 2558 509
6 Bardhaman-II 152939 5 16 4
7 Bhatar 263064 9 84 10
8 Memari-I 259876 9 125 10
9 Memari-II 150252 4 32 5
10 Jamalpur 266338 8 98 8
11 Raina-I 180952 8 51 6
12 Raina-II 151401 6 39 8
13 Khandaghosh 189336 4 29 4
14 Mongalkote 263240 6 81 10
15 Ketugram-I 165408 3 28 5
16 Ketugram-II 118567 3 25 3
17 Katwa-I 279099 13 293 37
18 Katwa-II 136708 3 25 4
19 Purbasthali-I 206977 4 44 4
20 Purbasthali-II 212355 5 37 5
21 Kalna-I 263667 24 451 24
22 Kalna-II 167335 5 40 7
23 Monteswar 237398 5 47 5
Health Care Facilities of Paschim Bardhaman District
1 Kanksa 178125 8 39 4
2 Faridpur-Durgapur 115924 3 27 4
3 Pandabeswar 161891 2 6 1
4 Ondal 186915 12 274 40
5 Jamuria 123176 5 93 20
6 Raniganj 106441 9 107 8
7 Barabani 127542 6 35 7
8 Salanpur 163057 7 517 52
9 Durgapur M.C. 566517 37 1688 315
10 Asansol M.C. 1152443 97 3647 479
Source: Census of India, 2011; District Statistical Handbook- Bardhaman, 2014
Dimension 1
Health Care Institution Population Ratio (HCIPR): This dimension is used to find out the
number of population served by a single health care institution in the study area. In Purba
Bardhaman District, Bardhaman I C.D. Block enjoys the best position in this dimension
whereas, Ketugram I has the worst condition. On the other hand, in Paschim Bardhaman
District, Raniganj has the highest number of health care institution per one lakh of population
and Pandabeswar has the lowest number of health care institution per one lakh of population.
Dimension 2
Bed Population Ratio (BPR): Bed Population Ratio is used to measure the number of beds
available per 10000 populations. In Purba Bardhaman, Bardhaman I has the highest BPR
where Bardhaman II has the lowest being in very poor condition. On contrary, Salanpur C.D.
Block of Paschim Bardhaman District enjoys the best position in this dimension whereas
Pandabeswar occupies the last position with very poor BPR.
4. 173
Table 02: Health Care Facility Dimensions of Purba Bardhaman
# C. D. Blocks HCIPR BPR DPR DHCIR BHCIR
1 Ausgram-I 5.17 8.79 9.05 1.75 17
2 Ausgram-II 3.98 2.58 4.64 1.12 6.5
3 Galsi-I 3.20 2.82 3.73 1.17 8.83
4 Galsi-II 2.04 1.97 2.04 1 9.67
5 Bardhaman-I 12.45 48.24 96.00 7.71 38.76
6 Bardhaman-II 3.27 1.05 2.61 0.8 3.2
7 Bhatar 3.42 3.19 3.80 1.11 9.33
8 Memari-I 3.46 4.81 3.85 1.11 13.89
9 Memari-II 2.66 2.13 3.33 1.25 8
10 Jamalpur 3.00 3.68 3.00 1 12.25
11 Raina-I 4.42 2.82 3.31 0.75 6.37
12 Raina-II 3.96 2.57 5.28 1.33 6.5
13 Khandaghosh 2.11 1.53 2.11 1 7.25
14 Mongalkote 2.28 3.08 3.80 1.67 13.5
15 Ketugram-I 1.81 1.69 3.02 1.67 9.33
16 Ketugram-II 2.53 2.11 2.53 1 8.33
17 Katwa-I 4.66 10.50 13.26 2.85 22.54
18 Katwa-II 2.19 1.83 2.92 1.33 8.33
19 Purbasthali-I 1.93 2.12 1.93 1 11
20 Purbasthali-II 2.35 1.74 2.35 1 7.4
21 Kalna-I 9.10 17.10 9.10 1 18.79
22 Kalna-II 2.99 2.39 4.18 1.4 8
23 Monteswar 2.11 1.98 2.10 1 9.4
Health Care Facility Dimensions of Paschim Bardhaman
1 Kanksa 4.49 2.19 2.24 0.5 4.87
2 Faridpur-Durgapur 2.59 2.33 3.45 1.33 9
3 Pandabeswar 1.23 0.37 0.62 0.5 3
4 Ondal 6.42 14.66 21.40 3.33 22.83
5 Jamuria 4.06 7.55 16.24 4 18.6
6 Raniganj 8.45 10.05 7.52 0.89 11.89
7 Barabani 4.70 2.74 5.49 1.17 5.83
8 Salanpur 4.29 31.71 31.89 7.43 73.86
9 Durgapur M.C. 6.53 29.80 55.60 8.51 45.62
10 Asansol M.C. 8.42 31.64 41.56 4.94 37.60
Source: Census of India, 2011; District Statistical Handbook- Bardhaman, 2014 and authorโ calculation
Dimension 3
Doctor Population Ratio (DPR): This dimension indicates the number of doctors per one lakh
of population in the study area. The Planning Commission of India has suggested the Doctor
Population Ratio should be 1:1000 (Planning Commission of India, 2011) but here we find that
none of the Blocks in both Districts can achieve this critical limit of BPR. In Purba Bardhaman
District, Bardhaman I has the highest DPR where Purbasthali I has the lowest ratio. On the
other hand in Paschim Bardhaman District, Durgapur Municipal Corporation has the best
condition and Pandabeswar has the worst condition within the District.
Dimension 4
Doctor Health Care Institution Ratio (DHCIR): This dimension is used to find out the number
of doctor per health care institution in the study area. Here, after the analysis of dataset, we
have found out that in Purba Bardhaman District, Bardhaman I C.D. Block has the highest
number of doctor to attain a health care institution where Raina I has the worst condition. In
Paschim Bardhaman District Durgapur M.C. has the best condition whereas Kanksa and
Pandabeswar possess the last position.
5. 174
Dimension 5
Bed Health Care Institution Ratio (BHCIR): This dimension is used to measure the number of
bed per health care institution in the study area. The more number of beds available in a health
care institution indicates the good condition of health care facilities in that region. In Purba
Bardhaman District, Bardhaman I have the best condition where Bardhaman II has the worst
condition. On the other hand, in Paschim Bardhaman District, Salanpur is in the best position
whereas Pandabeswar is in the lowest position.
6. 175
Table 03: Health Care Facility Dimensions and their Domestic Goalpost of Purba and
Paschim Bardhaman District
Dimensions
Goalposts of the Dimensions
Minimum Value Maximum Value
Health Care Institution Population
Ratio (HCIPR)
1.81 (Ketugram-I) 12.45 (Bardhaman-I)
1.23 (Pandabeswar) 8.45 (Raniganj)
Bed Population Ratio (BPR)
1.05 (Bardhaman-II) 48.24 (Bardhaman-I)
0.37 (Pandabeswar) 31.71 (Salanpur)
Doctor Population Ratio (DPR)
1.93 (Purbasthali-I) 96.00 (Bardhaman-I)
0.62 (Pandabeswar) 55.60 (Durgapur M.C.)
Doctor Health Care Institution
Ratio (DHCIR)
0.75 (Raina-I) 7.71 (Bardhaman-I)
0.5 (Kanksa, Pandabeswar) 8.51 (Durgapur M.C.)
Bed Health Care Institution Ratio
(BHCIR)
3.2 (Bardhaman-II) 38.76 (Bardhaman-I)
3 (Pandabeswar) 73.85 (Salanpur)
Source: Authorsโ computation based on secondary data
The minimum and maximum values of Health Care Facilities observed among the Blocks are
noted down in Table No. 3. The dimension index (๐ ๐ ) is calculated in order to construct the
Health Care Facility Index (HCFI) based on the following formula:
๐ ๐ =
๐ด๐ โ ๐๐
๐๐ โ ๐๐
Where, ๐ ๐ = Dimension index of ๐ ๐กโ
dimension, ๐ด๐ = Actual value of ๐ ๐กโ
dimension, ๐๐ =
Maximum Value of ๐ ๐กโ
dimension and ๐๐ = Minimum Value of ๐ ๐กโ
dimension.
In UNDP Goal Post method, calculation is done with the predetermined values for the minimum
and maximum values. On the other hand, in this method, we have used the observed minimum
and maximum values for each dimension. The dimension (๐ ๐) value ranges between 0 to 1
(Goel and Sharma 2017). High dimensional value (๐ ๐)indicates higher success of the C.D.
Blocks/Municipal Corporation in ๐ ๐กโ
dimension.
Considering all the five dimensions, , ๐ ๐กโ
C. D. Block can be represented by a point (dโ, dโ, dโ)
in three-dimensional Cartesian space like 0 โค dโ, dโ, dโ โค1. In the three-dimensional Cartesian
space, the point โ0โ would indicate the worst condition whereas โ1โ would indicate the ideal or
perfect condition. HCFI is measured by the normalized inverse Euclidean distance of the point
(dโ, dโ, dโ) from the best or perfect point (1, 1, 1).
Therefore, taking into account the equal weight for each dimension we can explain the formula
for calculation of HCFI as follows.
๐ป๐ถ๐น๐ผ = 1 โ โ
(1 โ d1)2 + (1 โ d2)2 + (1 โ d3)ยฒ
5
The value of HCFI ranges from โ0โ to โ1โ. The value โ0โ indicates the worst health care facilities
system and โ1โ indicates the Perfect health care facilities. On the basis of the HCFI values, the
C. D. Blocks are classified into three categories. The range 0.5<HCFIโค1 indicates โHighโ or
โVery Goodโ health care facility system; 0.2<HCFIโค0.5 indicates โModerateโ health care facility
system and 0โคHCFIโค0.2 โLowโ or โPoorโ health quality facility system.
After the Block wise calculation of Health Care Facility Index (HCFI) of Purba and
Paschim Bardhaman District, we have placed each Blocks according to their rank. Table
number 4 and 5 portrays the rank wise distribution of each Block of two Districts. In Purba
Bardhaman District, Bardhaman I gets the first position with HCFI value of 1. So, we can say
that Bardhaman I has the perfect condition of health care facilities. Bardhaman I get the first
position due to the good health care facilities of Bardhaman Municipality which has been added
with this Block. Kalna I, Katwa I, and Ausgram I follow respectively with the 2nd
, 3rd
and 4th
position. These three Blocks are considered under the medium or moderate condition of health
care facilities. Whereas, rest of the 19 Blocks of this District fall under very poor condition of
health care facilities. The last three Blocks are in this list are Purbasthali II, Khandaghosh and
Bardhaman II.
7. 176
Table 04: Health Care Facility Index (HCFI) of Purba Bardhaman District, 2014
# Blocks HCFI Rank Remarks
1. Bardhaman-I 1.0000 1 High
2. Kalna-I 0.2744 2 Medium
3. Katwa-I 0.2725 3 Medium
4. Ausgram-I 0.2089 4 Medium
5. Memari-I 0.1159 5 Low
6. Mongalkote 0.1001 6 Low
7. Jamalpur 0.0897 7 Low
8. Raina-II 0.0873 8 Low
9. Bhatar 0.0861 9 Low
10. Ausgram-II 0.0812 10 Low
11. Galsi-I 0.0795 11 Low
12. Kalna-II 0.0772 12 Low
13. Raina-I 0.0730 13 Low
14. Memari-II 0.0639 14 Low
15. Ketugram-I 0.0631 15 Low
16. Katwa-II 0.0569 16 Low
17. Purbasthali-I 0.0543 17 Low
18. Ketugram-II 0.0540 18 Low
19. Monteswar 0.0498 19 Low
20. Galsi-II 0.0496 20 Low
21. Purbasthali-II 0.0440 21 Low
22. Khandaghosh 0.0372 22 Low
23. Bardhaman-II 0.0288 23 Low
Source: Authorsโ computation based on secondary data)
Table 05: Health Care Facility Index (HCFI) of Paschim Bardhaman District, 2014
# Blocks HCFI Rank Remarks
1. Durgapur M.C. 0.7838 1 High
2. Asansol M.C. 0.6756 2 High
3. Salanpur 0.6724 3 High
4. Ondal 0.4169 4 Medium
5. Jamuria 0.3066 5 Medium
6. Raniganj 0.2367 6 Medium
7. Barabani 0.1378 7 Low
8. Kanksa 0.0968 8 Low
9. Faridpur-Durgapur 0.0967 9 Low
10. Pandabeswar 0.0000 10 Low
Source: Authorsโ computation based on secondary data
8. 177
The Durgapur Municipal Corporation in Paschim Bardhaman District claims the first
position with HCFI value of 0.78. The next two ranks are hold by Asansol M.C. and Salanpur
C.D. Block. The first three positions are under very good condition of health care facilities.
Ondal, Jamuria and Raniganj Blocks have moderate condition of health care facilities with the
HCFI value ranging between 0.2-0.5. The rest four Blocks like Barabani, Kanksa, Faridpur-
Durgapur and Pandabeswar have very poor health care facilities. Pandabeswar has the worst
condition of health care facilities with the HCFI value of 0.
Table 06: Health Care Facility Dimensions of the Purba and Paschim Bardhaman District
District Statistics HCIPR BPR DPR DHCIR BHCIR HCFI
Purba
Bardhaman
District
Mean 3.70 5.68 8.17 1.52 11.49 0.13
Median 3.00 2.57 3.33 1.11 9.33 0.08
S.D. 2.47 9.98 19.34 1.41 7.41 0.20
C.V. 66.71 175.50 236.64 98.99 64.50 151.49
Skewness 2.63 3.91 4.64 4.14 2.56 4.01
Kurtosis 7.44 16.45 21.95 18.29 8.03 17.44
Min Value 1.81 1.05 1.93 0.75 3.2 0.03
Max Value 12.45 48.24 96.00 7.71 38.76 1.00
Paschim
Bardhaman
District
Mean 5.12 13.30 18.60 3.26 23.31 0.34
Median 4.60 8.80 11.87 2.33 15.24 0.27
S.D. 2.35 12.97 18.86 2.93 22.78 0.28
C.V. 45.83 97.53 101.40 89.89 97.74 82.19
Skewness 0.012 0.67 0.99 0.83 1.39 0.50
Kurtosis -0.60 -1.46 -0.10 -0.63 1.54 -1.38
Min Value 1.23 0.37 0.61 0.5 3 0.00
Max Value 8.45 31.71 55.6 8.51 73.85 0.78
Source: Authorsโ computation based on DSH data, 2014
Table No. 6 shows the descriptive statistics of different dimensions of Health Care
Facilities of Purba and Paschim Bardhaman Districts. In Purba Bardhaman District, the mean
value of Health Care Institution Population Ratio is 3.70 whereas in Paschim Bardhaman
District the mean value of HCIPR is 5.12. So, the number of Health Care Institution per lakh
population is more in Paschim Bardhaman District than Purba Bardhaman District. The number
of bed in health care institutions per 10000 populations is in better numbered in Paschim
Bardhaman District with 13.30/10000 population where in Purba Bardhaman District this
number is only 5.68/10000 population. The average Doctor Population Ratio is 8.17 in Purba
Bardhaman District per one lakh population whereas average DPR is 18.60 in Paschim
Bardhaman District. The average value of number of bed per Health Care Institutional Ratio is
23.31 in Paschim Bardhaman District whereas in Purba Bardhaman District the BHCIR is
11.49. Thus, in all respect, Paschim Bardhaman District possesses better position than Purba
Bardhaman in health care facility system.
Conclusion
Health care facility is one of the basic indicators to measure the wellbeing of a society. In this
study different dimensions of health care facilities have been measured to analyse the health
care system of Purba and Paschim Bardhaman District. Health Care Facility Index (HCFI) value
of each Block shows the health care facilities condition and position of those Blocks within the
District. The Mean HCFI value of Purba Bardhaman District is 0.13 which indicates very low
situation of health care facilities of this District. On the other hand, the mean value of HCFI of
Paschim Bardhaman District is 0.34 which indicates moderate health care facilities condition of
this District. The Government may look for a way to enhance the quality of health care facilities
from the grassroots level since wellbeing of a society is closely associated with the
improvement of the health care facilities of that region.
References
1. Anthamatten, P. and Hazen, H. (2011). The Geography of Health. Routledge. 144-164
2. Bengal District Gazetteers, 1997.
3. Billings J, Zeitel L, Lukomnik J, Carey TS, Blank AE, Newman L. (1993). Impact of
socioeconomic status on hospital use in New York City. Health Affairs 12(1):162โ173.
9. 178
4. Bindman AB, Grumbach K, Osmond D, Komaromy M, Vranizan K, Lurie N, Billings J,
Stewart A. (1995). Preventable hospitalizations and access to health care. Journal of the
American Medical Association 274:305โ311.
5. Census of India, 2011.
6. Debapriya, A. and Mohanty, M.K. (2000). Inter District Variation in the Level of Human
development in Orissa, Utkal Economic paper, vol-12, pp.50-53
7. Debapriya, A. and Mohanty, M.K. (2006). Inter District Variation in the level of Industrial
Development of Orissa: A Quantitative Analysis, Asian Economic Review, Vol. 48, No.1.
8. Goel, S. and Sharma, R. (2017). Developing a Financial Inclusion Index for India. Procedia
Computer Science, 122, 949-956. https://www.sciencedirect.com /science/
article/pii/S1877050917327102
9. Government of West Bengal (2014). District Statistical Handbook, Eastern Burdwan 2014.
Kolkata: Bureau of Applied Economics and Statistics.
10. https://www.who.int/about/who-we-are/constitution
11. Husain, M. (1994). Medical Geography. Anmol Publications Pvt Ltd, New Delhi, pp. 1-37
12. Joshi, Samir (1997). Regional Disparities in Industrial Development, Indian Journal of
Regional Science, Vol. 29, No.1.
13. King, B. and Crews, K. (2013). Ecologies and Politics of Health. Routledge, 13-54
14. Krishan, G. (2001). Presidential address:. Development, Environment and Decentralized
planning, Annals of NAGI, Vol. 21, No.1, Jan- 2001pp.2-22.
15. Lakshminarayanan, S. (2011). Role of government in public health: Current scenario in
India and future scope. J Family Community Med. 2011 Jan-Apr; 18(1): 26โ30.
https://dx.doi.org/10.4103%2F1319-1683.78635
16. Meade, M. and Earickson, R. (2006). Medical Geography. Rawat Publications. New Delhi.
310-342
17. Mishra, R. (2007). Geography of Health. Concept Publishing Company, New Delhi, 60-69
18. Singh R. (2006). Regional Disparities in level of socio-economic Development in post
Reforms Period: A District level Analysis, Annals of NAGI, Vol. 26, Dec., No.2, pp.87-94.
19. Verma, C. S.; Singh, S.; Ranjan, A. and Sundararaman, T. (2018). Social and Systematic
Determinants of Utilisation of Public Healthcare Services in Uttar Pradesh. Economic and
Political Weekly, LIII (45), 54-62.