An Approach To Consider The Impact Of Co-Designed Science Case Study Of Bayesian Networks To Set NRM Targets
•
0 likes•2 views

Paper Writing Service http://StudyHub.vip/An-Approach-To-Consider-The-Impact-Of-C 👈

Recommended
Recommended
More Related Content
Similar to An Approach To Consider The Impact Of Co-Designed Science Case Study Of Bayesian Networks To Set NRM Targets
Similar to An Approach To Consider The Impact Of Co-Designed Science Case Study Of Bayesian Networks To Set NRM Targets (20)
More from Joshua Gorinson
More from Joshua Gorinson (20)
Recently uploaded
Recently uploaded (20)
An Approach To Consider The Impact Of Co-Designed Science Case Study Of Bayesian Networks To Set NRM Targets
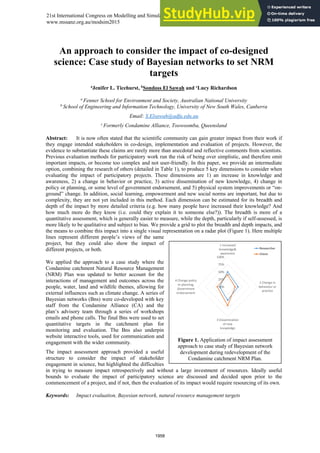
- 1. An approach to consider the impact of co-designed science: Case study of Bayesian networks to set NRM targets a Jenifer L. Ticehurst, b Sondoss El Sawah and c Lucy Richardson a Fenner School for Environment and Society, Australian National University b School of Engineering and Information Technology, University of New South Wales, Canberra Email: S.Elsawah@adfa.edu.au c Formerly Condamine Alliance, Toowoomba, Queensland Abstract: It is now often stated that the scientific community can gain greater impact from their work if they engage intended stakeholders in co-design, implementation and evaluation of projects. However, the evidence to substantiate these claims are rarely more than anecdotal and reflective comments from scientists. Previous evaluation methods for participatory work run the risk of being over simplistic, and therefore omit important impacts, or become too complex and not user-friendly. In this paper, we provide an intermediate option, combining the research of others (detailed in Table 1), to produce 5 key dimensions to consider when evaluating the impact of participatory projects. These dimensions are 1) an increase in knowledge and awareness, 2) a change in behavior or practice, 3) active dissemination of new knowledge, 4) change in policy or planning, or some level of government endorsement, and 5) physical system improvements or “on- ground” change. In addition, social learning, empowerment and new social norms are important, but due to complexity, they are not yet included in this method. Each dimension can be estimated for its breadth and depth of the impact by more detailed criteria (e.g. how many people have increased their knowledge? And how much more do they know (i.e. could they explain it to someone else?)). The breadth is more of a quantitative assessment, which is generally easier to measure, while the depth, particularly if self-assessed, is more likely to be qualitative and subject to bias. We provide a grid to plot the breadth and depth impacts, and the means to combine this impact into a single visual representation on a radar plot (Figure 1). Here multiple lines represent different people’s views of the same project, but they could also show the impact of different projects, or both. We applied the approach to a case study where the Condamine catchment Natural Resource Management (NRM) Plan was updated to better account for the interactions of management and outcomes across the people, water, land and wildlife themes, allowing for external influences such as climate change. A series of Bayesian networks (Bns) were co-developed with key staff from the Condamine Alliance (CA) and the plan’s advisory team through a series of workshops emails and phone calls. The final Bns were used to set quantitative targets in the catchment plan for monitoring and evaluation. The Bns also underpin website interactive tools, used for communication and engagement with the wider community. The impact assessment approach provided a useful structure to consider the impact of stakeholder engagement in science, but highlighted the difficulties in trying to measure impact retrospectively and without a large investment of resources. Ideally useful bounds to evaluate the impact of participatory science are discussed and decided upon prior to the commencement of a project, and if not, then the evaluation of its impact would require resourcing of its own. Keywords: Impact evaluation, Bayesian network, natural resource management targets Figure 1. Application of impact assessment approach to case study of Bayesian network development during redevelopment of the Condamine catchment NRM Plan. 0% 25% 50% 75% 100% 1 Increased knowledge& awareness 2 Change in behaviour or practice 3 Dissemination of new knowledge 4 Change policy or planning, Government endorsement Researcher Client 21st International Congress on Modelling and Simulation, Gold Coast, Australia, 29 Nov to 4 Dec 2015 www.mssanz.org.au/modsim2015 1958
- 2. Ticehurst et al., An approach to consider the impact of co-designed science: … 1. INTRODUCTION Researchers and model developers across many disciplines report that participatory research, and developing models and decision support systems (DSS)s leads to greater acceptance of research outcomes, model results, and greater use of the DSSs (e.g. Ticehurst, 2008). However, Cleaver (2001, in Nakamura, 2014) states that’s there is a lack of evidence of the long-term effectiveness from participation in general, we consider this particularly the case for participatory modelling. Carberry (2004) believes that researchers tend not to monitor the impact of their research because it is too difficult, too hard to attribute a single cause of impact, and the evaluation itself has little impact. He argues that the competing pressures for researchers to “provide innovative research” and make an impact on the ground, can lead to the measurement of the latter being neglected. Yet he still advocates for including participatory approaches in research projects. However, as funding bodies and employers make a greater push for researchers and government agencies to demonstrate their impact, rather than just report on activities completed, there is a growing need to measure the impact of research which involves stakeholders in a meaningful way. Researchers have presented different approaches to measure impacts. Bellamy et al (2001) provide a framework for the evaluation of Natural Resource Management (NRM) policy, while Jones et al (2009) developed a framework to evaluate participatory modelling. These frameworks provide great insight into the steps required to evaluate participatory work, but they also contain many less transferable steps that are specific to the purpose for which they were developed. Others provide a more general approach for evaluating participatory research in the integration of bio-physical and socio-economic research (Blackstock et al, 2007), but they provide a list of 21 criteria to evaluate the participatory research against. We argue that, although not all criteria are used at all stages of the project, this is still too many criteria to consider the impact againstparticularly in retrospective evaluation. Unless it was a dedicated study to measuring the impact, it is more likely that the impact would not be investigated at all, so we suggest a simpler approach. More recently, Jones et al (2014) represented the impact of stakeholder engagement by developing a two- dimensional framework to assess the outcome of a participatory plant breeding project in West Africa. They describe a scale of participation from consultative, to collaborative to collegial on one axis, while the outcomes on the other axis are to achieve the instrumental goals, empower the participants, or be considered manipulative. But as Bellamy et al (2001) notes, if the evaluation is too limited in its criterion, important benefits may be missed. This paper presents a compromise between the simplistic and complicated approaches to measure impact, which we believe will allow researchers to consider the depth and breadth of the impact of their work. We consolidate information from a literature review into a list of 5 dimensions, to measure impact of stakeholder engagement in science. We then suggest a way to semi-quantify the impact on each dimension, through criteria involving a qualitative or categorical reflection of the work. The impact from the stakeholder engagement can then be represented graphically in a single radar plot. Here we explore the usefulness of these criteria and this approach through a retrospective analysis of a participatory project to develop a Bayesian network (Bn) in the Condamine catchment, Queensland, Australia. 2. APPROACH TO EVALUATE IMPACT From the literature we summarised the key dimensions to measure the impact of participatory science in Table 1. The dimensions could be used at the beginning of the project to discuss the intended or desired impact of the project, which could be tested against the results from the evaluation. As part of this discussion, the current state of the knowledge base and practice would need to be specified, in order to put any future change into context. The proposed approach allows for the impact of participatory science to be made at different scales from the individual, to the group or community, or even the institution or the system. At the finest level, the impact could increase the knowledge and skills of an individual. This is known as a normative function of participatory processes (Blackstock et al, 2007). Increases in knowledge and awareness have been well linked to changes in behavior and/or practice (e.g. Vanclay, 1992). At the coarser group level, the collective learning from different people’s perspectives in the process can produce a common and better understanding of the issues, and therefore enable better solutions (Blackstock et al., 2007). This is known as the substantive function of participatory processes. An in-depth increase in knowledge could lead to individuals or groups disseminating the new information and skills to other colleagues, individuals, or groups, which in turn increases the number of individuals who have increased their knowledge and skills. The collaborative relationships which are built during participatory processes assist in diffusing conflicts, known as the instrumental function (Blackstock, et al, 2007). New knowledge and skills, plus public support, can lead to changes in policy and/or government support or endorsement. From either an individuals’, 1959
- 3. Ticehurst et al., An approach to consider the impact of co-designed science: … groups’ or community’s change in practice, or a change in policy, there can be a resultant change in the physical system, such as a change in the natural resource condition. The impact of an increase in knowledge and awareness is closely linked to social learning and empowerment (Nakamura, 2015), and with follow on effects to social norms. However, the social learning components are difficult to measure (Blackstock et al, 2007) without research beyond the scope of this conference paper. We suggest that a simple method to estimate the level of social learning and empowerment from a co-designed project is needed. 3. CASE STUDY BACKGROUND The Condamine River catchment is in southern Queensland, Australia. It is a complex mix of human and natural capital which needs to be managed in a holistic way, in order to ensure its sustainability into the future. The region’s NRM Plan is the collaborative guiding framework developed by the catchment community for protecting the natural assets. The 2010 Catchment Plan was developed using scientific assessment, and a series of community and stakeholder consultations to try and ensure that the defined land, water and wildlife targets were feasible and desirable by the community, industry and government partners. The plan needed to be revised and updated to address climate adaptation and emerging issues such as mining impact, but also to better coordinate actions and integrate system interactions across the land, water and wildlife themes. It was crucial to carry out a process that continued the engagement with the community, and also integrated the best current science to refine the natural resource targets and priorities for the catchment. The ANU developed 6 Bn models (Ticehurst, 2014), one for each of the water sub-catchment management areas in the Condamine catchment, which were used to assist in setting targets for the revised plan. The models can be used for ongoing exploration of the potential impact of changes in land use and climate upon the land, water and wildlife assets. From this, users can investigate the potential for land management and planning to mitigate any negative impacts and can use the information to inform the development of guidelines for land use and management in order to protect the catchments' natural resources and move towards achieving the targets. The models were developed following the typical iterative process in Bn development, as illustrated in Ticehurst et al. (2009). There were three stakeholder workshops with the advisory team, held throughout the course of the 14 month project. The advisory team was made up of 14 people from 11 organisations, who were consulted about the model conceptual frameworks, states used to describe the system components, potential sources of data, and how best to use the models to contribute to the planning process. More regular engagement occurred between three key staff members of CA, which built a greater level of trust between them and the key researcher. Through this communication the outcomes from the stakeholder workshops about the models were confirmed, the usefulness of various data sources and reports were discussed, input data was reviewed, options for overcoming model software constraints were discussed, training about model use occurred and some aspects of model testing were explored. In the end, the 6 Bns were run by CA staff Table 1. Dimensions to measure the impact of stakeholder engagement in science Impact dimensions Description for criteria development References 1. Increase in knowledge and awareness How many people have increased their knowledge, and how much detail do they now know? Enough to understand it, or enough to explain it to others? Carberry (2004), Bunyatta et al (2006), Ticehurst et al (2012), 2. Change in behaviour or practice How many people have changed their behaviour or practice, and how much of their possible practice have their changed? This includes the use of outputs, such as models, produced in the participatory process. Carberry (2004), Bunyatta et al (2006), Dalton et al, 2011 3. Active dissemination of new knowledge How many people are actively passing on the new knowledge, and what scale is the new knowledge being distributed? Bunyatta et al (2006), Tripp et al (2005) 4. Change in policy or planning, or government endorsement How many policies and/ or plans have been changed or updated? Has a government body provided endorsement of the outcomes? What level of government have these changes occurred at? Owenya et al (2011) 5. Physical system improvements or on-ground change To what extent has there been a change ‘on the ground’, other than a change in practice? For example has the water quality improved, agricultural production increased, soil erosion decreased? Bellamy et al (2001) 1960
- 4. Ticehurst et al., An approach to consider the impact of co-designed science: … Figure 2. Scales to consider the two dimensions of 4 framework criteria. Blue cross = researcher, Green dot = client 0% 100% Narrow Moderate Widespread Breadth of increase in knowledge 0% 100% Shallow Moderate In depth Depth of increase in knowledge 0% Narrow Moderate Widespread Breadth of change in practice 100% 0% 100% Extent of change in practice 0% Narrow Moderate Widespread Breadth of dissemination 100% 0% 100% Scale of dissemination 0% Narrow Moderate Widespread Breadth of new policy, planning, endorsement 100% 0% 100% Scale of new policy, plan, endorsement 1) Increase in knowledge 2) Change in practice 4) Change in policy, planning & government endorsement 3) Level of information dissemination with selected advisors, to assist in setting the land, water and wildlife targets in the revised NRM Plan. The Bns also underpin a suite of interactive tools on the internet (http://www.nrmplan.com.au/catchment_models) which are being used as communication and engagement tools with the wider community. 4. METHOD FOR APPLYING IMPACT EVALUATION Methods listed in the literature for collecting data on the impact of participatory research range from the purposeful completion of surveys and interviews (Bunyatta et al, 2006, Dalton et al, 2011, Clark and Seidu Jasaw, 2014, Ticehurst et al, 2012, Blackstock et al, 2007), to ‘softer’ approaches such as document analysis (Blackstock et al, 2007) and the review of diaries (Clark and Seidu Jasaw, 2014), and system conceptualizations (Henly-Shepherd et al., 2015). While the former can provide a strong quantitative method to measure the impact of participatory science, it is also more time consuming, which can make it less feasible in the practicalities of research. Others have found the differences in opinion of impact from different groups of stakeholders considered as ‘internal’ stakeholders (clients) and ‘external’ stakeholders (research community) (Blackstock et al., 2012). Consequently a more thorough evaluation should also consider the impact from multiple perspectives. Given this, applying this approach would ideally utilize the results from dedicated temporal surveys, administered by a third party, and completed by individual researchers, immediate clients, stakeholder representatives, and the wider community, about their experiences, before and throughout a project, and beyond its delivery. However, the aim of this paper is to provide a method which is not overly labour intensive, and hence more likely to be used. Therefore we suggest a two-dimensional ‘gauge’ to assist in structuring individuals’ reflections on a project, and enable a qualitative estimate of the depth and breadth of the impact for each criteria (see Table 1). For example, for a particular project a survey respondent would first consider any increase in knowledge and awareness of stakeholders, be it with regards to the breadth of knowledge (“how many people have increased their knowledge and awareness?”). This represents a range from 0% to 100% of their perceived feasible expectations for a project, which is plotted along the x- axis in Figure 2(1) in blue text. For those who are not comfortable in responding quantitatively, qualitative category descriptions are offered as “narrow” (i.e. a few people), “moderate” or “widespread” (a vast majority of the people whom the research could impact). Then a survey respondent would consider, of those people who have increased their knowledge and awareness, to what depth have they gained that insight? Again this could be considered on a scale from 0% to 100% of the perceived feasible expectations of depth to be gained, with qualitative category descriptors of “shallow” (i.e. they understand the concepts), “moderate” (i.e. they understand the principles behind the concepts), or “in depth” knowledge (they can explain that knowledge to others) to assist in interpretation. This informs selection against the vertical red text on the y-axis of Figure 2(1). Now the impact for knowledge can be marked using its xy co-ordinates. Reading off the parallel diagonal lines provides an impact to be assigned, where the bottom left corner has no impact (0%), increasing to the top right corner which has a maximum impact (100%), with any possible impact score in between. For example, the blue cross in Figure 2(1) shows a 33% (narrow to moderate) breadth in the increase in knowledge (i.e. the number of people increasing knowledge), with a moderate to in- depth understanding 1961
- 5. Ticehurst et al., An approach to consider the impact of co-designed science: … (marked as 66%), which sits the blue cross along the diagonal line of a 50% impact on knowledge. The single value for impact of that criteria is then plotted onto a radar plot (Figure 1). This is repeated for each of the criteria to give an integrated visual representation of the total impact of the project according to that source. If the criteria are believed to vary in importance, then the impact of the breadth compared to the depth (i.e. x and y co-ordinates) and/or the impact from one criteria compared to another can be scaled accordingly. By way of demonstration, and given the limited resources, the ANU researcher for the CA case study, and one of the key CA staff, both authors of this paper, used the approach provided in Figure 2 to independently reflect upon their perception of the impact of developing Bns with stakeholder engagement to assist in setting targets for the NRM Plan against criteria for four of the dimensions given in Table 1. Dimension 5 was not included because it was not feasible to see any change in natural resource condition given the time period for this paper. Both the researcher and the CA staff member self-assessed the impact based upon their perceptions of workshop participation. The researcher also used their previous 10 years’ experience in developing Bns with NRM staff. While the CA staff member also used insight into who workshop participants shared the information with, knowledge of the CA’s newsletter distribution, and feedback from workshop evaluation sheets completed by the advisory team, not focused upon measuring impact. Table 2. Evidence used to complete the engagement framework Impact Dimension ANU Researcher Condamine Alliance representative Evidence Impact score Evidence Impact score 1 Increase in knowledge 3 key CA staff thoroughly understand Bns to use independently. Advisory team familiar with development process and approach for setting targets. Number of people with increased knowledge was considered moderate. Moderate 50% Advisory team, scenario planners, flow- on discussion at home organisations, community feedback, reports reviewed by funding body staff = approx. 45 people. People started with a range of knowledge, but estimate that they all increased it by the same amount (e.g. Low to moderate, high to very high). 40% Moderate 2 Change in practice Bns used directly to inform the NRM Plan. NRM targets now quantitative, with measurable goals to gauge the progress. Low to Moderate 35% Project team (including consultants) changed practices in response to learnings. Estimate half of Advisory team, all of the project team, and some co-workers = approx. 10 people. Estimate small changes to practices for external stakeholders, Moderate changes in practice for project team and co-workers. Low to Moderate 25% 3 Dissemination of new knowledge 3 key CA staff could thoroughly explain Bns during workshops, and advocate for their use, benefits and limitations to others, but this is a small 30number of people. Moderate 45% Advisory team passed information on to co-workers during project. Project team passed knowledge on through conference presentations and posters, reports, via newsletters, workshops etc. Estimated approx. 900 people. Information generally on narrow topics in each instance, but covering fair depth over all instances. Very few covering true depth of knowledge. Moderate to High 63% 4 Change in policy, planning, or government endorsement Dramatic change in NRM planning process for the region, but only for this plan. Low to Moderate 27% The NRM plan itself. Slight change to CA policy to accommodate the new plan and its tools. Minor changes to Australian and Queensland government policies. Expect minimal changes to stakeholder policy and plans. Estimate 8 policies/plans changed to a minor extent, except for the NRM plan itself. Includes national to local policy changes, but largest at regional then local scales. Low to Moderate 35% NOTE: The authors did not include attendees at conferences or Queensland NRM groups who attended knowledge sharing workshops in Criteria 1. 1962
- 6. Ticehurst et al., An approach to consider the impact of co-designed science: … 5. RESULTS The ANU researcher and CA representative completed the assessment using the evidence presented in Table 2 to assign the respective impact values for each dimension shown in Figure 2. We assumed that each criteria of each dimension were valued equally, therefore no scaling was applied. The resultant radar plot of the total impact (Figure 1), visually shows a similar impact from the assessment of the researcher and the client, across the four criteria. Several possible reasons for the similarity in the responses include 1) they are the centering on the actual impact of the project, 2) they could be an indication of the strong working relationship built up between the researcher and client such that they both share similar opinions on the project outcomes 3) they could be a factor of the classification of the framework design that makes it difficult for widespread discrepancy. The three key differences in ratings (18% greater impact rating by the client for the dissemination of new information and 10% greater impact rating by the researcher for increases in knowledge, and changes in practice, 7% greater impact rating by the client on policy, may be due to different levels of access to the baseline/results by the two raters. The researcher may have under-estimated the pre- existing knowledge and practice of the stakeholders and the community, but as Blackstock et al (2012) also found, stakeholders may not put as much emphasis on improving knowledge as the research community does. Instead they believe that the implementation of a plan is more important (Blackstock et al 2012), which again aligns with the differences in policy impact estimates. This might also be an indication that the impact criteria presented here have unintentionally been scaled to the relative importance given to the criteria by the respondents. 6. DISCUSSION AND CONCLUSIONS We proposed a simple semi-quantified approach to assist in structuring reflection on the impact of stakeholder engagement in co-designed science projects. It was developed using a modest literature review, and would benefit from a more complete search of other published works, as well as a review and discussion by a wider scientific audience, as is proposed for this conference session. Our aim was to propose an approach which contained enough detail to capture the major components of the impact of stakeholder engagement, but was not overly complicated to hinder its utility. Hence we provided a grid to assist in transforming qualitative impacts into quantitative measures which can be plotted and compared on a radar plot. The approach provided a useful structure to reflect upon the impact of the project, but it also highlighted some strong limitations in trying to carry out such a simplified process retrospectively. The results presented here may indicate that a greater impact rating reflects a higher level of importance placed upon that criteria from the respondent, but also that different raters may have better access to, or different, information sources. It may be that some effort needs to be made to weight the criteria to reflect the relative importance, using the findings of other research such as Blackstock et al (2012) as a guide. However, this requires additional resources, mainly time and money. Dedicated target setting as well as data collection from surveys prior to commencement, throughout and beyond the completion of a project (to account for temporal variation), and conducted by a third party, would give a more rigorous measure of the impact of the co-designed science. However, do the additional resources required to complete such an evaluation, outweigh the benefits of the approach? This can only be answered once the reason for wanting to know about the impact of participatory science has been confirmed, and the balance between the analysis, implementation and evaluation of co-designed science is clarified with respect to the available resources (time and money). This would also force the project evaluation to be considered at the commencement of the project, which is not often the case. If the impact was discussed at the commencement of the project, then useful criteria to describe each dimension, how they should be represented, and the temporal boundaries could also be agreed upon, which would ensure that the appropriate criteria are included and they are commonly understood. This all leads towards the question about what are the useful bounds to place around measuring the impact of stakeholder engagement in science. If we attempt to be all-inclusive and scientifically rigorous, does the exercise become too unmanageable to be worth pursuing? Perhaps Carberry (2004) had it correct saying that researchers don’t measure their impact because it is too difficult. However, we suggest that the complexity and suitability of any given framework needs to be appropriate for the purpose. The intermediate approach presented here, can be applied to structure a reflective measure of the impact of co-designed science, but a more rigorous and quantitative approach requires considerably more resources and prior planning. 1963
- 7. Ticehurst et al., An approach to consider the impact of co-designed science: … ACKNOWLEDGEMENTS This project was funded by the Condamine Alliance, and supported by the Australian National Centre for Groundwater Research and Training. We would also like to thank Dr Wendy Merritt for her insight into the topic and framework. REFERENCES Bellamy, J.A., D.H. Walker, G.T. McDonald and G.J. Syme (2001). A systems approach to the evaluation of natural resource management initiatives, Journal of Environmental Management, 63: 407-423. Blackstock, K.L., G.J. Kelly and B.L. Horsey (2007). Developing and applying a framework to evaluate participatory research for sustainability. Ecological Economics, 60: 726-742. Blackstock, K.L., K.A. Waylen, J. Dunglinson and K.M. Marshall (2012), Linking process to outcomes – Internal and external criteria for a stakeholder involvement in River Basin Management Planning, Ecological Economics, 77: 113-122. Bunyatta, D.K., J. G. Mureith, C.A. Onyango and F.U. Ngesa (2006). Farmer Field School effectiveness for soil crop management technologies in Kenya." Journal of International Agricultural and Extension Education, 13(3): 47-63. Carberry, P. S. (2004). Crop scientists as change agents. International Crop Science Congress. Brisbane. Clark, G. and G. Seidu Jasaw (2014). Evaluating team project-work using triangulation: lessons from communities in northern Ghana. Journal of Geography in Higher Education, 38: 511-524. Cleaver, F. (2001). Institutions, agencies, and the limitations of participatory approaches to development. In B. Cooke and U. Kothari (eds), Participation: The new tyranny? London: Zed Books. pp. 36-55. Dalton, T.J, N.K. Lilja, N. Johnson and R. Howeler (2011), Farmer participatory research and soil conservation in Southeast Asian cassava systems. World Development, 39: 2176-2186. Jones N.A., P. Perez, T.G. Measham, G.J. Kelly, P. d’Aquino, K.A. Daniell, A. Dray and N. Ferrand (2009). Evaluating participatory modeling: Developing a framework for cross-case analysis. Environmental Management, 44: 1180-1195. Jones K, L.L. Glenna and E. Weltzien (2014). Assessing participatory processes and outcomes in agricultural research for development from participants’ perspectives. Journal of Rural Studies, 35: 91-100. Henly-Shepard S., S.A. Gray and L.J. Cox (2015). The use of participatory modeling to promote social learning and facilitate community disaster planning. Environmental science and policy, 45: 109-122. Nakamura N. (2015). What is a community’s desire? A critical look at participatory research projects with Indigenous communities, Social & Cultural Geography, 16: 165-182. Oweya, M.Z.,W. L. Mariki, J. Kienzle, T. Friedrich and A. Kassam (2011). ‘Conservation agriculture’ (CA) in Tanzania: the a case of the Mwangaza B CA farmer field school (FFS), Rhotia Village, Karatu District, Arusha." International Journal of Agricultural Sustainability 9(1): 145-152. Ticehurst, J.L. (2008), Evolution of an approach to integrated adaptive management: The Coastal Lake Assessment and Management (CLAM) tool, Ocean and Coastal Management, 51: 645-658. Ticehurst, J.L, A. Curtis & W. Merritt (2009). Can Bayesian networks compliment traditional analysis of social data? A case study on the adoption of current recommended practices (CRP) in the Wimmera region, Landscape Logic Technical report No. 13, http://www.landscapelogicproducts.org.au Ticehurst J.L, C.A. Pollino and W.S. Merritt (2012). Bayesian networks as integration tools in collaborative research. T. Lefroy, A. Curtis, A. Jakeman and J. McKee (Eds), Landscape Logic: Integrating science for landscape management, Collingwood, Australia, CSIRO Publishing. pp. 239 – 254. Ticehurst J.L. (2014). Condamine Alliance Bayesian network (CABn): Final report, Using Bayesian networks to assist in setting natural resource management targets, produced for the Condamine Alliance. Tripp R., M. Wijeratne, and V.H. Piyadasa (2005). What should we expect from Farmer Field Schools? A Sri Lanka case study." World development 33(10): 1705 - 1720. Vanclay, F., 1992. Barriers to adoption: a general overview of the issues. Rural Society 2 (2), 10e12. 1964