A virtual environment for formulation of policy packages

The interdependence and complexity of socio-technical systems and availability of a wide variety of policy measures to address policy problems make the process of policy formulation difficult. In order to formulate sustainable and efficient transport policies, development of new tools and techniques is necessary. One of the approaches gaining ground is policy packaging, which shifts focus from implementation of individual policy measures to implementation of combinations of measures with the aim of increasing efficiency and effectiveness of policy interventions by increasing synergies and reducing potential contradictions among policy measures. In this paper, we describe the development of a virtual environment for the exploration and analysis of different configurations of policy measures in order to build policy packages. By developing systematic approaches it is possible to examine more alternatives at a greater depth, decrease the time required for the overall analysis, provide real-time assessment and feedback on the effect of changes in the configurations, and ultimately form more effective policies. The results from this research demonstrate the usefulness of computational approaches in addressing the complexity inherent in the formulation of policy packages. This new approach has been applied to the formulation of policies to advance sustainable transportation.

Recommended
Recommended
More Related Content
What's hot
What's hot (19)
Similar to A virtual environment for formulation of policy packages
Similar to A virtual environment for formulation of policy packages (20)
More from Araz Taeihagh
More from Araz Taeihagh (20)
Recently uploaded
Recently uploaded (20)
A virtual environment for formulation of policy packages
- 1. A Virtual Environment for the Formulation of Policy Packages By Araz Taeihagh, René Bañares-Alcántara, and Moshe Givoni Full reference: Taeihagh, A., Bañares-Alcántara, R., & Givoni, M. (2014). A virtual environment for the formulation of policy packages. Transportation Research Part A: Policy and Practice, 60, 53 – 68. DOI: http://dx.doi.org/10.1016/j.tra.2013.10.017 Link to published article: http://www.sciencedirect.com/science/article/pii/S096585641300205X
- 2. 2 A Virtual Environment for the Formulation of Policy Packages Araz Taeihagh*, René Bañares-Alcántara*,1 and Moshe Givoni** * Department of Engineering Science, University of Oxford. Parks Road, Oxford OX1 3PJ, UK ** Transport Studies Unit, School of Geography and the Environment, University of Oxford, South Parks Road, Oxford OX1 3QY, UK Abstract. The interdependence and complexity of socio-technical systems and availability of a wide variety of policy measures to address policy problems make the process of policy formulation difficult. In order to formulate sustainable and efficient transport policies, development of new tools and techniques is necessary. One of the approaches gaining ground is policy packaging, which shifts focus from implementation of individual policy measures to implementation of combinations of measures with the aim of increasing efficiency and effectiveness of policy interventions by increasing synergies and reducing potential contradictions among policy measures. In this paper, we describe the development of a virtual environment for the exploration and analysis of different configurations of policy measures in order to build policy packages. By developing systematic approaches it is possible to examine more alternatives at a greater depth, decrease the time required for the overall analysis, provide real-time assessment and feedback on the effect of changes in the configurations, and ultimately form more effective policies. The results from this research demonstrate the usefulness of computational approaches in addressing the complexity inherent in the formulation of policy packages. This new approach has been applied to the formulation of policies to advance sustainable transportation. Keywords: Policy formulation, decision support systems, policy packaging, virtual environments, agent-based modelling, transport policy. 1 Introduction The complexity and interdependence of socio-economic systems require the development of new tools and techniques to support a better understanding of the intricacies in these systems and to formulate policies that address the problems associated with such systems. Unlike in the physical sciences and economics, the use of computational approaches in the public policy realm has been 1 Corresponding Author. Email: rene.banares@eng.ox.ac.uk, Tel.: +44 1865 27 31 78 Fax: +44 1865 28 32 73.
- 3. 3 mainly focused on the simulation and optimization of policy alternatives rather than on their synthesis and generation. Until recently policy analysis has mainly focused on impact of individual policy measures. Policy formulation is increasingly becoming more difficult due to the complexity of the systems and increase in the number of policy measures available for addressing the problems. An accepted trend is that formulation of integrated policy packages, rather than a loose combination of policy measures that are considered and deployed in isolation, increases the success of policies (May and Roberts, 1995; Banister et al., 2000; Feitelson, 2003; OECD, 2007, Givoni et al. 2013 and Givoni, this issue). Development of a systematic framework and methodologies for development of policy packages is very helpful. In this paper, we focus on the development of a virtual environment for the exploration and analysis of different configurations of policy measures in order to build policy packages. The virtual environment allows testing the effects of changing the policy measures and/or their properties on the performance of the policy packages using different criteria and provides means of exploring the effects of uncertainties in policy formulation. The approach utilizes and integrates techniques such as conceptual design, network analysis, Agent-Based Modelling (ABM) and multiple criteria decision analysis. Information about the policy measures’ internal properties and their interactions with other policy measures and the user2 preferences are used in the analysis and formulation of policies. The final decision on which policy to implement will rest with the decision makers who may decide to include additional policy measures or remove some of the measures recommended by the system. We believe that by developing systematic approaches for the formulation and analysis of policies it is possible to decompose the problem into subproblems with more manageable size, analyse different alternatives at a greater depth, examine more alternatives, and decrease the time required for the overall analysis. Moreover, it is possible to provide real-time assessment and feedback to the domain experts on the effect of changes in the configuration of policy measures included in the package. This ultimately will help in forming more effective policy packages with synergistic and reinforcing attributes while avoiding internal contradictions. The approach is based on a previously proposed six- step framework for policy formulation (Taeihagh et al., 2009a) and the OPTIC framework for policy packaging (Givoni et al. 2013, Justen et al., this issue). We showcase the system by applying the methodology to the formulation of a policy to increase walking and cycling (W&C) by using policy measures from the Visions 2030 project (Tight et al., 2011 - see Section 2.3 for more detail). The background information is discussed in Section 2. Section 3 describes the architecture, objectives and conceptual framework used in the modelling approach and Section 4 illustrates its 2 The term user in this paper always refers to the individual who is using the system, e.g. policy expert or planner.
- 4. 4 implementation. The results achieved are presented in Section 5 and conclusions and future work are described in Section 6. 2 Background Information 2.1 Policy Design, Formulation and Packaging A policy is a principle or guideline for action in a specific context (Pohl, 2008), and policy design is the task in which the components of a policy are selected and the overall policy is formulated. Currently, decisions on what to include in policies (their synthesis) are done manually, and considering the size of the space of alternative policies, a large portion of this space is left unexplored. Some aspects of a policy can be modelled mathematically, however, mathematical modelling is only part of the general policy-making process as decisions about desirable futures and the policies to attain them, are questions of social values and political choice (Robinson et al., 2006). In particular, simulation and optimization routines can be utilized for the selection of an appropriate alternative, however these techniques have difficulty in dealing with ‘wicked’ problems3 (Rittel and Webber, 1973, Bakshi 2011). The major challenge faced by policy makers is no longer a lack of understanding about possible solutions nor a lack of options to implement. Given the complexity of the problems we are facing, the challenge is how to analyse and explore a large number of complex options, and arrive at the best solutions given time, geographical, budgetary and a myriad of other constraints. It is apparent that without having a systematic approach and access to decision aid tools, the number and complexity of different policy alternatives jeopardize the identification of the best options. Research has already shown that capturing and processing large amounts of information is difficult for the human mind (McKee, 2003). Furthermore, Jones et al. (2009) point to evidence that excessive amounts of information can cause inertia and consideration of very few options. We believe that the traditional approach to policy-making can be enhanced to better address current shortcomings and help in addressing 21st century’s challenges. The methodology for the generation of alternatives can be greatly enhanced, and a systematic approach will accelerate the task of policy-making and improve policy effectiveness. 3 Rittel and Webber (1973) assigned 10 characteristics to wicked problems which have been further generalised by Conklin (2005) to the following six characteristics: 1. Wicked problem cannot be understood until a solution has been developed 2. Wicked problems have no stopping rules 3. Solutions to wicked problems are not right or wrong they are better or worse. 4. Every wicked problem is essentially unique and novel 5. Every solution to a wicked problem is a one-shot operation 6. Wicked problems have no given alternative solutions.
- 5. 5 We have proposed a six-step framework to facilitate policy formulation for achieving a set of user- defined goals and targets (for more information see Taeihagh et al.(2009a)). A software system has been implemented using this framework and the OPTIC framework for policy packaging (Givoni et al. 2013, Justen et al., this issue), with consideration for reusability and flexibility of use with different targets, sectors and geographical scopes. A wide range of options should be explored and implemented to increase the probability of policy success. Givoni et al. (2010) define a ‘policy package’ as “a combination of individual policy measures, aimed at addressing one or more policy goals; a package is created in order to improve the impacts of the individual policy measures, minimise possible negative side effects, and/or facilitate the interventions’ implementation and acceptability”. 2.2 Specification of relations among policy measures Once a library of policy measures has been developed, the next step in the analysis is to identify and formalise relations that capture the policy measure interactions. Five types of mutually exclusive relations among policy measures are considered in this study: Precondition, Facilitation, Synergy, Potential Contradiction and Contradiction (Taeihagh et al., 2009b). A definition of each term is provided in Table 1: Table 1: Description of policy measure relation types Source: Taeihagh et al., 2009b. The classification of the individual relations among policy measures is carried out by the domain experts and stored in an adjacency matrix. In the specific case study used in this paper, planners and transport specialist are considered as domain experts. The task of classifying the relations can be done individually or in a group setting. We believe since complex relations often exist between the policy measures and at times it can be difficult to clearly distinguish the relation type, using a collective Relation Description Precondition (P) A precondition relation is defined as a relation that is strictly required for the successful implementation of another policy measure. The precondition relation is a directed relation. Facilitation (F) In case where a policy measure ‘will work better’ if the outcome of another policy measure has been achieved, the relation is considered as facilitation. The facilitation relation is also a directed relation. Synergy (S) Synergy is a special case of facilitation relation in which the ‘will work better’ relation is bidirectional (undirected relation). The synergy relation is more desirable than facilitation as it is not constrained by a sequential order of implementation. Potential Contradiction (PC) Potential contradiction exist between policy measures if the policy measures produce conflicting outcomes or incentives under certain circumstances, hence the contradiction is ‘potential’. This relation is undirected. Contradiction (C) The contradiction relation is defined when “strictly” conflicting outcomes or incentives between policy measures are generated. This relation is undirected.
- 6. 6 decision making procedure for identifying the relations is advantageous and is likely to increase the robustness of the analysis. The method requires the analysis of only two measures at a time, in independence from the other measures in the inventory, thus simplifying the task for the analyst. Using an iterative approach where at least one iteration is performed for the identification of each type of relation is recommended and helps in identification of inconsistencies and errors (for more information see Taeihagh et al. 2013). To store the relations in a network consisting of n nodes, an n by n adjacency matrix is created in which each element represents a relation between the corresponding row and column nodes. An edge, which could be directed or undirected, exists between two nodes a and b if element (a,b) of the matrix is equal to 1, and there is no edge between a and b if element (a,b) is equal to 0. In this study, the relations between policy measures (edges) are not weighted. Changing to a weighted network would result in differentiation of the level in which measures relate to each other, thus better capturing the real-life interactions among the measures. However, the extent to which a relationship can be quantified, e.g. the degree to which facilitation can increase effectiveness, is questionable. That said, if models exist that could provide estimations of the effects or the experts are confident in their detailed assessment of how measures affect each other, such information should be considered in the analysis. The multi-relational adjacency matrix formed is then decomposed into individual adjacency matrices that only entail a single type of relation (in the case under study, five networks) and are visualised and used in the formulation and analysis of policy packages. The visualisation also serves as a final check on the integrity and validity of the defined relations. 2.3 Walking and Cycling in Cities The importance and nature of transport policy makes it especially difficult to address (e.g. Ney, 2009). One approach currently advocated to improve the balance between the benefits and the costs of society’s mobility needs is sustainable transport or “sustainable mobility” (Banister, 2008). In sustainable transport policy, a major objective is to facilitate a shift from the use of motorised to non- motorised transportation. This can be translated to increasing the level of W&C (see for example Boarnet (2006) and Rietveld and Daniel (2004)). The increase of W&C can be substantial; however, in Britain, where the majority of trips in urban areas are suitable for W&C, the trend has been declining (DfT, 2009). In contrast, some countries have been successful in the reversal of this trend by using policies that have promoted W&C (Pucher and Buehler, 2008, 2010). In this context, the “Visions of the role of W&C in 2030” research project (Tight et al., 2011) seeks to develop and evaluate alternative visions in which W&C play a more central role in urban transportation by the year 2030, moving away from the situation in 2010 where W&C represent 26% of trips in urban areas
- 7. 7 to 70% in 2030 (Tight et al., 2011). To achieve this a policy package is needed. In the rest of the paper, we describe the approach we have taken in the development of a virtual environment to build and assess policy packages for the promotion of W&C. 3 Modelling Approach 3.1 Agent-Based Modelling: A Brief Overview Gilbert (2008) defines Agent-Based Modelling (ABM) as a computational method that enables a researcher to create, analyse, and experiment with models composed of agents that interact within an environment. ABM allows modelling complex actions by the agents and reactions to other agents and to the environment, and enables observation of the outcomes and system effects given a set of parameters (North and Macal, 2007). These considerations can make decision making more successful and allow observing these systems effects and anticipating them prior to the implementation of policies. As Lesser (1999) points out, multi-agent systems are reliable, scalable and modular, which are all desirable features to have when formulating policies. 3.2 Objectives of the Virtual Environment for Policy Formulation Virtual environments have been used for the analysis and improved understanding of complex systems in different domains such as energy (Wittmann, 2008), health (Thomas, 2010), food (Henane et al., 2010), transport (Gaud et al., 2008) or markets (North et al., 2002). For instance, in the case of markets, developing such virtual laboratories enables testing of different regulatory and market structures, e.g. the Electricity Markets Complex Adaptive Systems (EMCAS) model, developed by Argonne National Laboratory (North et al., 2002). The focus of this paper is on the development of a virtual environment for the exploration and analysis of different combinations of policy measures to build and assess policy packages, and to carry out tests to observe the effects of changes and uncertainties during policy formulation. The reasons for adopting an ABM approach are: (a) the possibility to combine top-down and bottom- up approaches4 ; (b) the possibility to develop a flexible system that can handle incremental discovery, design and development (North and Macal, 2007); (c) the ability to decompose the overall problem, and through the use of a multi-layered approach, accommodate abstraction and the use of hierarchical 4 In the top-down approach, the problem is solved by starting from a top-level structure and then decomposed into subproblems which are simpler to solve. Bottom-up approach is when the reverse happens and the solution is synthesised from the individual building block components by forming more complex structures until the design problem is solved. Sudeikat et al. (2012) explain in detail how ABM methodology can enable these approaches.
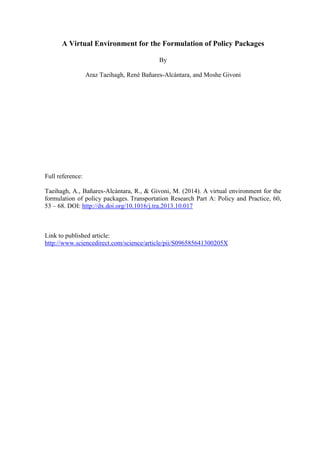
- 8. 8 structures (similar to the hierarchical design procedure (Douglas, 1988)); and (d) the ability to deal with organisational relationships such as those found in complex systems (Jennings, 2000). In addition, ABM provides the flexibility to deal with different types of data. This is especially important in cases where qualitative information is abundant and when its quantification and use is not possible or is, perhaps, questionable. Some of the shortcomings of the approach taken include: (a) requirement of expertise in development and use of the system; (b) cost of building the model; (c) reliance on subjective input data; and (d) lack of differentiation among the policy measures relations defined. ABM formalism was used as an implementation methodology and for the rest of the paper the term “agent” should be understood as a modular piece of code and not as an autonomous entity nor as an avatar of a human or an institution. The authors are more interested in exploring and tackling the technical problems resulting from the complexity in policy formulation and to showcase the use of a computational framework rather than in exploring or simulating human behaviour in decision-making. Therefore, using agent architectures such as Belief-Desire-Intention (BDI - Bratman et al., 1988 and Rao and Georgeff, 1995) or Physical conditions, Emotional states, Cognitive capabilities and Social status (PECS - Urban, 2000) is not the focus of this research, although they are relevant from a social science perspective. 3.3 Conceptual Framework In the system, a Model Initialiser carries out the task of reading the required information to generate different agents and develop networks that represent the interactions among them. Policy Packer agents undertake the selection of policy measures to create the policy packages. Assessor agents evaluate the alternatives based on the given criteria, rank them at different hierarchical levels and provide real-time feedback to agents to help them in their decision making process. Figure 1 illustrates a conceptual ABM framework for the formulation of policies. The initial data required are the details of the available policy measures and their interactions and a set of preferences that are acquired from the user as global parameters and through a graphical user interface.
- 9. 9 Policy Measures Policy Packers Network generation Package selection algorithm Assessor(s) Model initialiser Policy Packages Figure 1: Conceptual ABM framework for policy formulation 4. Application of the Virtual Environment: Promotion of Walking and Cycling in Cities This section describes the approach we have taken in the implementation of a virtual environment to build and assess policy packages for the promotion of W&C5 . Section 4.1 highlights the input data used and the initialisation process. Section 4.2 details the policy measure selection process for creation of policy packages. Section 4.3 illustrates the policy package assessment procedure and Section 4.4 details visualizations and graphical user interface. Subsequently Sections 5.1-5.4 further illustrate various functions of the system. 4.1 Input Data and Initialisation Process Thirty-eight policy measures that promote W&C constitute the core of the library of policy measures used in this study (see Appendix A.1 for the list of policy measures). The repository was created from the Visions 2030 project (Tight et al., 2011) through participation of domain experts and the use of scientific literature. These policy measures have different nature and characteristics; some can be expressed quantitatively but the majority have a qualitative nature. Policy measure properties considered were Cost, Effectiveness, Timescale of implementation, Delay, Timescale of Effect, Technical Complexity, Public Unacceptability and Institutional Complexity (Taeihagh et al., 2013). 5 The implementation of the decision support system (DSS) has been carried out using Repast Simphony (Recursive Porous Agent Simulation Toolkit, North et al., 2005). For system architecture and technical implementation details see Taeihagh (2011).
- 10. 10 Five types of interactions between the policy measures were identified: Precondition, Facilitation, Synergy, Potential Contradiction and Contradiction (see Section 2.2 for definitions). These interactions were stored and later retrieved during the initialisation phase of the system to form network structures. Aside from the use in the virtual environment, the information described above is used for ranking of policy measures during the initialisation step to differentiate between policy measures (for more information see Taeihagh et al., 2013). At the beginning of the simulation run, the initialisation process is carried out by the Model Initialiser. These tasks include the creation of the agents, assignment of their properties, creation of networks of interactions among policy measures (i.e. network projections) and the definition of the structural relations between different agents and networks in the system. Repast Simphony’s runtime agent editor provides a range of facilities that includes (North et al., 2005): (a) Creation, cloning and deletion of different types of agents during runtime. (b) Providing lists of existing agents and their connections. (c) Selection of the agents and change of their properties during runtime. (d) Providing the ability to take snapshots or video while the system is running. (e) Creation or deletion of links in different network structures. 4.2 Selection of Policy Measures Policy Packer agents undertake the selection of policy measures to create the policy packages. These agents can formulate policy packages using only global parameters or user inputs. The main tasks carried out by a Policy Packer agent include: (a) Identification and consideration of preconditions relations of the policy measures under analysis. (b) Consideration of the different constraints imposed on the system through global parameters, such as financial cost, or via the contradiction and potential contradiction networks. (c) Utilization of the synergy and facilitation networks to create synergy within the policy packages. (d) Utilization of user inputs during runtime for the formulation of policy packages. (e) Assessment and update at each iteration step of the policy package properties based on the policy measures they contain. This information is used by the Assessor agent to compare the packages.
- 11. 11 Each Policy Packer agent starts with a top policy measure, selected on the basis of its score which is calculated through a policy measure ranking methodology (Taeihagh et al., 2013)6 . It is possible for the user to add additional Policy Packer agents to the system at any time. Policy Packer agents check to see if the selected policy measure has any preconditions and in the case that it does, they are added to the package. In the next step, the highest ranked policy measure that has positive interactions (synergy or facilitation) with the measures in the package or its preconditions are identified and added. This addition (with a variety of options available to the user) can continue in successive iterations to expand the size of the packages, allowing the user to experiment with different configurations and observe the effects on the performance of the packages. Figure 2 depicts a simplified version of the decision process of the Policy Packer agents. It can be seen that certain behaviours are performed when a particular circumstance is reached. In those cases where distinguishing these conditions is difficult, the desired changes in the behaviour of the agents are implemented through “watchers”. Watchers trigger certain agent behaviours when an expected circumstance occurs and can have complex scheduling and/or analysis processes to identify these circumstances. For instance, one of these watchers monitors the state of all the Policy Packer agents when they are in the precondition analysis phase. Once all of the agents have carried out their precondition analyses then the watcher triggers a change in the state of the agent that allows it to consider other aspects of the policy measure analysis. 6 As we can identify measures that perform well against a chosen set of criteria, it seems logical to start forming policy packages using these best performing policy measures.
- 12. Beginning of Policy Packer’s Algorithm in each iteration* Preconditions check? Check if there is a potential contradiction in the package Point out the contradiction to the user by a message Yes Ask user if the package should be penalised Yes Update the penalisation data (used by Assessor agent) Check Cost > threshold specified No Check time > threshold specified No Message user and ask what to do (deactivate/ignore) Yes Yes Check if there is a contradiction in the core of the package No No Yes Check if the package is still active Yes No Add Synergy/ Facilitations to the package? No No Add the measure & its preconditions to the package Initial precondition check? Yes No Any policy measure in the queue No Find preconditions for the measure under analysis by checking the nodes it is connected to in the precondition network Yes Add the preconditions to the queue to be analysed in next steps Add the first element of the queue to the package and remove it from the queue Precondition check for the policy measure under analysis Yes Acquire the percentage the package should be penalised from user No Contradiction with core measures Contradiction/ potential cont. with measures Remove the top measureYes No Check time/ cost>treshhold specified NoNo Message user and ask what to do Yes Deactivate package Yes No Ignore Yes No YesAcquire penalisation percentage from user and apply By using network data find all measures with Synergy or Synergy/Facilitation depending on user preference Find top ranked measure and its preconditions from the pool of measures found in previous step Assess content of the package and update properties End START Assess content of the package and update properties Decision Process Subprocess Start/End Data Reference Legend External Data *when there is a reference back to the start of the algorithm the continuation of the analysis happens in the next iteration step. Figure 2: Simplified version of the Policy Packers selection process.
- 13. 4.3 Policy Package Assessment The Assessor agent evaluates the alternative policy packages based on two sets of criteria: performance (Total Cost, Total Implementation Time and Total Effect) and difficulty of implementation (Public Unacceptability, Technical and Institutional Complexity). The ranking of the packages is carried out using multiple criteria decision methods and the weighted summation of the scores with respect to different criteria specified by the user through the user interface (discussed in Section 4.4). The assessor agent provides real-time feedback to the user through the graphical user interface, and helps to identify the more promising packages and understand the implications of changes in different packages. Moreover, the scores are communicated to the Policy Packer agents to help them in their decision making process. The Assessor agent retrieves information regarding the packages from the Policy Packer agents and uses it to rank the packages. The retrieved information includes: (a) Total Cost: sum of the direct cost of all of the policy measures in a package. (b) Total Implementation Time: sum of the Timescale of Implementation (TI) and the Delay (D) for the policy measures in a package7 . (c) Total Effect: defined as summation of the values obtained from multiplication of the Timescale of Effect (TE) of the policy measures by their Effectiveness (E). (d) In the case of Public Unacceptability, Technical Complexity and Institutional Complexity the value associated with the package is the sum of the scores of the individual policy measures it contains. The ranking is based on the weighted summation of the scores of the policy measures. Weights used for the criteria in each set are specified as global parameters defined by the user and can be changed at any time during the simulation8 . All the criteria in each set were assigned positive weights fixed to a sum of 1.0. Every individual criterion within each set falls into one of the two categories of desirable and undesirable. A criterion is desirable when a high score is considered better (e.g. Total Effect) and is undesirable when a lower score is considered better (i.e. Cost, Total Implementation Time, Public Unacceptability, and Technical and Institutional Complexities). In the first set (performance criteria), 7 It cannot be generically prescribed that all of the policy measures in a package can be implemented concurrently (in parallel). Therefore, in the various calculations related to timescales, the total time required for implementation is the sum of the implementation times of the policy measures (i.e. the upper bound of the implementation time). 8 The weights assigned to the criteria were based on the authors’ judgment and expertise. The weights used were: Performance ranking: Total Implementation Time 20%, Total Effect 40%, Cost 40%. Difficulty of Implementation ranking: Technical Complexity 20%, Public Unacceptability 40%, Institutional Complexity 40%.
- 14. 14 a mix of desirable and undesirable criteria are present. All the scores were transformed to desirable by using the reciprocal of the values associated with undesirable criteria (Grunig and Kuhn (2009)). The resulting scores were normalised and then were multiplied by their corresponding weight (see Appendix A.2 Eq.1 and 2 for desirable and undesirable criteria). The performance score is calculated by adding the policy package’s scores across both the desirable and undesirable categories. Hence, the policy package with the highest score in the first set is ranked as the top policy package in terms of performance (Appendix A.2 Eq.3). As all of the criteria in the second set (difficulty of implementation criteria) are undesirable, there is no need to convert the undesirable criteria to desirable and simply the package with the lowest score (lowest level of difficulty of implementation) is the top ranked policy package with respect to difficulty of implementation (Appendix A.3 Eq.4). 4.4 Visualisation and Graphical User Interface Provision for a variety of visualisation options was considered essential due to the level of complexity in the interactions among policy measures in different networks. Different visualisations illustrate the networks of policy measure interactions and the policy packages with their constituent policy measures. Various charts depicting the evolution of various properties of the policy packages during their formulation can be generated. Figure 3 is a screenshot of the Graphical User Interface (GUI) of the system. Figure 3: Screenshot of the Graphical User Interface
- 15. 15 The development of complex technical systems is often not the main expertise of policy makers. This fact should not be neglected when developing decision support systems in this domain. Based on the experience of the authors, an important factor in the acceptance and use of such systems is their level of transparency. This issue depends strongly on gaining the trust of the policy makers by ensuring that there are no hidden parameters/features that affect the outcome produced by the system and that they are in control, not the machine. Furthermore, two additional features that help in the adoption and use of a system are the provision of detailed explanation of the steps taken, and the ability to interact with the system. The ability to make changes to the assumptions and data “on the fly” and the provision of various override features to carry out adjustments on different aspects of the decision algorithm are crucial, and essential in those cases where the policy measure’s properties or its requirements are context specific. Aside from the features provided by the Repast Simphony’s runtime agent editor, a custom panel was added using the feedback from the domain experts. This panel provides detailed information about individual packages, the policy measures they contain and those outside the package. Moreover, an interactive mode has also been developed. In this mode agents rely on the user input for a variety of decisions. For instance, when the cost, time or size of a policy package has exceeded the acceptable threshold or a policy package is considered for penalisation (e.g. because some of its constituent policy measures are partially contradicting), the agents prompt the user for input on whether to deactivate or penalise a package (and by what percentage) instead of using the default values. 5 Results 5.1 Development of Policy Packages The virtual environment provides the ability to explore, formulate and analyse different configurations of policy measures in order to build policy packages. The outputs from the system are the formulated policy packages which can be used independently or in the development of policies that address broader policy objectives. Figure 4 depicts an illustrative example of a set of policy packages that has been formulated by the system. Each green (light coloured) circle represents a policy package and the blue (dark coloured) circles connected to it represent the policy measure that has been selected to build a package. In order to simplify the explanation and visualisation of the policy packages in this example, the number of policy packages has been limited to five and the number of time steps to three. Table 2 presents the top policy measures.
- 16. 16 Table 2: List of top policy measures used by Policy Packer agents For example, policy measure 14 (Green belts) is the starting point of Package 3 because it is the highest ranking measure available (after the first two have been used by Packages 1 and 2 it was decided to start each policy package with a different policy measure, but this decision can be modified). Policy measure 14 is ranked highly because of its low cost, high effectiveness, high duration of effects after implementation, and because it has no preconditions. It is evident that Policy Packer number Top policy measure in the package 1 Policy measure 28 City-wide 20mph speed limit 2 Policy measure 16 Mandatory ring fencing of WaC funds 3 Policy measure 14 Green belt 4 Policy measure 18 Removal of 'rat runs' for motorised vehicles 5 Policy measure 11 Strict liability legislation Figure 4: A sample of policy packages created by the Policy Packer agents
- 17. 17 introduction of green belts can play an important role in the promotion of W&C as they stops the expansion of the cities and thus help in stopping the increase of average travel distances. Other measures are then added to the package because they either have synergy or facilitation relations with the policy measures already in it. Policy measure 35 (introduction of private motor vehicle ownership restrictions) was selected on this basis. Policy measures added to a package are checked for their preconditions, and if such relations exist, they are also added to the packages. Policy measures 26 (Mandatory 'core' W&C networks) and 1 (All public transport fully accessible) were identified as preconditions to policy measure 35 and were added to the package. This process is carried out recursively until no further precondition exists for the measures within a package. It is for this reason that policy measures 16 (Mandatory ring fencing of WaC funds), 23 (On-road cycle paths) and 24 (Pavement widening) were added following the addition of policy measures 26 and 1. Lastly, after addition of policy measure 35 and its preconditions, the next best policy measure with synergistic relation is policy measure 28 (20 mph speed limit), which has no preconditions. A 20 mph speed limit makes it safer to walk and cycle and inhibits the use of private vehicles. Figure 4 also illustrates that packages 1 and 4 are identical. Package 1 was started by considering policy measure 28 (City-wide 20 mph speed limit) and package 4 by considering policy measure 18 (Removal of 'rat runs' for motorised vehicles). After the selection of the top policy measure the Policy Packer agents look for synergistic relations with the top policy measures and choose the highest ranked to enhance the package. These two top policy measures for both of these packages are synergistic and thus they are added (policy measure 18 to package 1 and policy measure 28 to package 4). Furthermore, at the next iteration step both packages have had the same set of synergy options and have chosen policy measure 23 (On-road cycle paths) to be added. As a result these two packages have converged to the same set of nodes. 5.2 Visualisation of the Assessment Data At every iteration step the Assessor agent calculates the performance and difficulty of implementation scores of the packages9 . Figure 5 presents the evolution of the performance scores of the five policy packages in the example over three iterations. Figure 5 shows that the addition of policy measures in the second iteration greatly increased the performance of policy package 3, however further additions in the third iteration decreased its performance because of the increase in temporal requirements of the policy package. 9 The performance score is based on cost, implementation time and effectiveness of the policy measures and the difficulty of implementation score is based on level of public unacceptability, and technical and institutional complexity.
- 18. Figure 5: Package Performance Scores at every iteration, step (t= 1, 2, 3) Package 2 is a special case. Its top policy measure does not have preconditions nor synergistic relations. Therefore, it has remained isolated during the first three cycles (its number of policy measures may increase in future cycles when facilitating policy measures are added). Although it is evident that policy package 2 has had no addition of policy measures during the iteration steps (visible in Figure 4), it displays a change in performance. The reason is that the performance score of the policy packages is relative to other packages. Figure 6 illustrates the difficulty of implementation versus the performance scores for the packages. Unlike performance scores, the difficulty of implementation scores can only increase with the addition of policy measures. The best policy packages will be located in the bottom right corner where performance is maximum and difficulty of implementation minimum. This visualisation enables the user to quickly identify the effect of changes to the packages and the package “sweet-
- 19. 19 spots”. Using this and other relevant information, experts can form better opinions on the optimal size of a package. It is evident from Figure 6 that policy package 3 has the highest performance but that this comes at the cost of an excessive level of institutional complexity. Furthermore by analysing the final step, step 3, it is evident that it has a negative effect in the performance score and also results in an increase of the difficulty of implementation of policy package 3. In order to provide more visual cues the performance and difficulty of implementation scores can be incorporated in the visualisation of the policy packages. The size of the green (light coloured) circles (Policy Packer agents) in Figure 7 is adjusted based on the performance scores of the individual packages. The size is based on a scaling factor, for instance, a scaling factor of 15 would result in the Policy Packer with the highest score having an icon size 15 times the smallest one. 5.3 Scalability of the System One of the benefits of using the system is the ability to analyse and explore a larger number of options in parallel at no extra cost as shown in Figure 7. This is particularly important in tasks such as policy formulation where complex interactions exist and experts are not able to recall all the crucial Figure 6: Evaluation of Difficulty of Implementation vs. Performance scores during policy package formulation
- 20. 20 information at the right time and have difficulties judging the effects of changes in the packages, attributes of the policy measures. Figure 7: Generation of a large number of policy packages. Figure 8 highlights how the visual cues and the feedback from the Assessor agent can be used to inform the experts exploring large and/or complex sets of policy packages. The visualisation was done using the Fruchterman and Reingold algorithm (1991) that positions the most connected nodes in the centre of the visualisation. The policy measures (blue/dark coloured nodes) that are highly connected to the Policy Packer agents (green/light coloured nodes) are placed in the centre of the network; they play a crucial role in the implementation of a large number of policy packages. For example, pavement widening is one such policy measure that has been selected by half of the policy packages in Figure 8. In turn, Policy Packer agents (green/ light coloured nodes) that are centrally located depend on a larger number of policy measures and typically have a high level of difficulty of implementation. As mentioned earlier, the size of the green/light coloured nodes (policy packer agents) is dependent on their performance scores. Use of the Fruchterman and Reingold algorithm (1991) when large number of packages are under analysis helps in identifying those that are closely related to each other and share similar nodes. A look at the upper right corner of Figure 8 very quickly identifies two packages (6 and 9) that have
- 21. 21 identical scores (sizes) and contain the same policy measures. On the left side packages 8, 18 and 15 are closely related; however, in this instance it is evident that package 15 has the lowest performance score. 5.4 User Panel and User 5.4 User Panel and Real-time Feedback Additional information about individual policy packages and full detail of the policy measures within and outside each package can be obtained using the custom defined user panel. Figure 9 illustrates the use of the User Panel in the analysis of policy package 17 shown in Figure 8. All of the policy measures within the package are displayed and, by selecting an individual one, it is possible to probe its relations in the five pre-defined networks. Policy package 17 has six policy measures, and Policy Measure 35 (Private motor vehicle ownership restrictions) does not have any contradiction or potential contradiction relations; however, it has two preconditions, ten synergies and one facilitation. At the bottom of the User Panel, a Legend button will display the full detail of any policy measure Figure 8: Use of the Fruchterman and Reingold algorithm and of scaling based on the policy package performance scores.
- 22. 22 (Full name, ID, properties and score) and there is also a facility to add or remove policy measures to/from policy packages manually. Figure 9: Package analysis and manipulation in the User Panel Note: PM – Policy Measure. As illustrated in Figure 2, at different stages of each iteration step Policy Packer agents perform a set of operations to check the viability of the policy packages being developed. These evaluations include estimating their cost, time required for implementation and the existence of contradictions or potential contradictions within the packages. Running in default mode, the Policy Packer agents can also perform actions based on the values of the global parameters provided by the user. These actions may include issuing notifications to the user, rejecting the addition of a policy measure to a package or penalising the score of a policy package (e.g. due to contradictions between its constituent policy
- 23. 23 measures). Under the interactive mode the system relies on the user judgment for performing these critical steps. For instance, if the maximum cost allowed in a package is exceeded a dialogue box is presented to the user to whether remove the package or not. If contradictions exist within the core of a package (top policy measure and its preconditions) the package will be deactivated, and in the case of the interactive mode, a message is presented to the user to decide whether to keep the package or deactivate it. In cases where contradiction appears due to the addition of new policy measures (not within the core of the package) then the system can skip those policy measures or seek expert judgement (depending on whether the default or the interactive mode has been selected). In all the cases when potential contradictions arise within the package the score of the packages can be penalised by a default percentage based on the number of potential contradictions or, in the interactive mode, based on user input. The system developed can assist the experts in exploring different aspects of the packages or policy measures, perform sensitivity analyses and get real-time feedback. The system can support: changes to the properties of the policy measures and/or their interactions, performing manual addition or removal of policy measures to/from different policy packages, or changing the criteria weights assigned for the assessment of the packages during runtime. 6 Conclusions and Future Work The complex nature of many policy problems is making the task of policy making increasingly difficult. Our efforts are focused towards developing methodologies and support tools to improve policy design and formulation. We have explored the potential of a virtual environment for the exploration and analysis of different policy measure configurations in order to formulate and assess alternative policy packages for the promotion of W&C in cities. The purpose of the research is to facilitate the design of policies and help in forming more effective, synergistic and reinforcing policies while avoiding internal contradiction and is based on ideas that originate in engineering design and complexity science. The resulting formulation support system utilizes the information about the internal properties of policy measures, their interactions with each other, and of user preferences for the analysis and formulation of policies. The approach integrates techniques such as conceptual design, network analysis, ABM and multiple criteria decision analysis, and offers an interactive mode in which the system relies on the user input for a variety of decisions. The approach enhances the ability of the policy makers to systematically consider a large number of policy measures, configure and analyse different policy packages in a shorter period and at a greater
- 24. 24 depth and provides real-time feedback and a variety of visualisation options to help them grasp the implications of their choices. The results from this research demonstrate the use of computational approaches in addressing generic complexities inherent in the formulation of policies and are applicable to different sectors aiming to achieve environmental, energy, water, food or health targets for different geographical scopes. We plan to enhance the generation and evaluation procedures of the system and further improve it by considering: Temporal analysis: Detailed consideration of the temporal aspects of policies has not been the focus of the current work. It is important to address the temporal elements and consider the effects of failed implementation of policy measures to address the risks and uncertainties that could arise and affect the policies. Multiple goals: The current prototype only considers a single type of a goal (e.g. promotion of W&C). We intend to explore multiple competing goals and consider their effect on the ranking and development of different policies. Consideration of multiple and concurrent stakeholders: We intend to develop a methodology that considers multiple and concurrent stakeholder involvement in the policy formulation process. Currently we assume that their differences are resolved before the data is provided to the system. Acknowledgements This research was partly funded by the Visions of the Role of Walking and Cycling in 2030 EPSRC project (Ref: EP/G000468/1) and was linked to the OPTIC project, funded by the European Union's Seventh Framework Programme (FP7/2007-2013, see http://optic.toi.no/).
- 25. 25 Appendix A.1 List of Policy Measures A.2 Calculation of the Performance Score Policy Measure No. Policy Measure 1 All Public Transport fully accessible 2 Maintenance of Walking and Cycling infrastructure 3 Regular public realm maintenance/cleaning 4 Widespread Sheffield stands bike parking 5 Opt-out travel training for all school children 6 Fine-grained provision of quality public space 7 Raised pedestrian crossings instead of dropped kerbs 8 Tree planting/ greenery 9 Minimum cycle parking in new developments 10 Freight windows 11 Strict liability legislation 12 Workplace crèches 13 Flexible working hours 14 Green belt planning restrictions around cities 15 Smart 'oyster-style' public transport smart-cards for all mobility 16 Mandatory ring fencing of Walking and Cycling funds 17 All city parking for private car to be pay and display or permit 18 Removal of 'rat runs' for motorised vehicles 19 Velib-style cycle hire scheme (including 'accessible' bikes) 20 Dutch-style railway parking facilities for bicycle 21 Community leisure walks and bicycle rides 22 Walking buses to school for young children 23 On-road cycle paths 24 Pavement widening 25 Dutch-style segregated cycle paths 26 Mandatory 'core' Walking and Cycling networks 27 Widespread private car-sharing schemes 28 City-wide 20mph speed limit 29 Limits on car advertising 30 Contra-flow bicycle lanes in one way streets 31 Public fitness campaign 32 Smart bicycle storage units 33 Cycle traffic enforcement 34 Retrofitting cul-de-sacs for Walking and Cycling connectivity 35 Private motor vehicle ownership restrictions 36 Car free housing developments 37 Consolidated neighbourhood goods delivery 38 Orange NEV/HPV routes 20mph coloured bike lanes for fast cycling
- 26. 26 ∑ ∑ Eq. 1 where: sd(k): Score of the policy package k with respect to the desirable criteria d: Number of desirable criteria p: Number of policy packages ci,j: Score of the policy package i with respect to criterion j wj: Weight assigned to criterion j ∑ ( ∑ ) Eq. 2 where: su(k): Score of the policy package k with respect to the undesirable criteria u: Number of undesirable criteria p: Number of policy packages ci,j: Score of the policy package i with respect to criterion j wj: Weight assigned to criterion j Eq. 3 A.3 Calculation of the Difficulty of Implementation Score ∑ ∑ Eq. 4 where: m: Number of criteria ci,j: Score of the policy package i with respect to criterion j p: Number of policy packages wj: Weight assigned to criterion j References Bakshi, B. R. (2011). The path to a sustainable chemical industry: progress and problems. Current Opinion in Chemical Engineering, 1(1), p.64-68. Banister D. (2008). The sustainable mobility paradigm. Transport Policy, 15, p.73-80.
- 27. 27 Banister, D., Stead, D., Steen, P., Åkerman, J., Dreborg, K., Nijkamp, P. and Schleicher-Tappeser, R. (2000). European Transport Policy and Sustainable Mobility, London: Spon. Boarnet M.G. (2006). Planning’s role in building healthy cities. Journal of the American Planning Association, 72(1), p.5-9. Bratman, M.E. Israel, D.J. and Pollack, M.E. (1988). Plans and resource-bounded practical reasoning. Computational Intelligence. 4, p.349-355. Conklin, J. (2005). Dialogue mapping: Building shared understanding of wicked problems. John Wiley & Sons, Inc. DfT, Department for Transport, (2009). Transport Statistics Bulletin, 2008 edition. Douglas, J.M. (1988). Conceptual design of chemical processes. McGraw-Hill New York. Feitelson, E. (2003). ‘Packaging policies to address environmental concerns’, in: Hensher, D. A. and Button, K. J. (eds.) Handbook of Transport and the Environment, Amsterdam: Elsevier. p.757–769. Fruchterman, T.M.J., and Reingold E.M. (1991). Graph drawing by force-directed placement, Software: Practice and Experience, Vol 21(11), p.1129-1164 Gaud, N., Galland, S., Gechter, F., Hilaire, V., and Koukam, A. 2008. Holonic multilevel simulation of complex systems: Application to real-time pedestrians simulation in virtual urban environment. Simulation Modelling Practice and Theory, 16(10), p.1659-1676. Gilbert, N. (2008). Agent-Based Models. Quantitative Applications in the Social Sciences. SAGE Publications. Givoni, M., Macmillen, J., Banister, D. and Feitelson, E. (2013). From policy measures to policy packages. Transport Reviews, 33(1), p. 1-20. Grunig, R. and Kuhn R. (2009). Successful Decision-Making: A systematic approach to complex problems, 2nd Ed., Springer. Henane, I., Said, L., Hadouaj, S., and Ragged, N. (2010). Multi-agent based simulation of animal food selective behavior in a pastoral system. Agent and Multi-Agent Systems: Technologies and Applications, p.283-292. Jennings, N.R. (2000). On agent-based software engineering, Artificial Intelligence, 117, p.277-296.
- 28. 28 Jones P, Kelly C, May A and Cinderby S (2009) Innovative Approaches to Option Generation. European Journal of Transport and Infrastructure Research, 9(3), p.237-258. Justen, A. Fearnley, N. Givoni, M. Macmillen, J. (this issue) A process for policy packaging: ideals and realties. Transportation Research A, this issue. Lesser, V. (1999). Cooperative multiagent systems: a personal view of the state of the art, IEEE Transactions on Knowledge and Data Engineering 11(1), p.133-142 May A.D. and Roberts M. (1995). The design of integrated transport strategies. Transport Policy, 2(2), p.97-105. McKee, T.E. (2003). Rough sets bankruptcy prediction models versus auditor signalling rates, Journal of Forecasting 22, p.569–586. Ney, S. (2009). Resolving Messy Policy Problems: handling conflict in environmental, transport, health and ageing policy, London: Earthscan. North, M.J Howe, T. Collier, N. and Vos, J. (2005). The Repast Symphony Runtime System, In Proceedings of the Agent 2005 Conference on Generative Social Processes, Models, and Mechanisms. Chicago, USA. North, M.J. and Macal, C.M. (2007). Managing business complexity: Discovering strategic solutions with agent-based modelingmodelling and simulation. Oxford University Press, New York. North, M.J., Conzelmann, G. Koritarov, V.S. Macal, C.M. Thimmapuram, P. and Veselka, T.D. (2002), “E-Laboratories: Agent-Based Modeling of Electricity Markets,” Proceedings of the 2002 American Power Conference, Apr. 2002, Chicago. OECD (2007). Instrument Mixes for Environmental Policy, Paris: Organisation for Economic Cooperation and Development. Pohl, C. (2008) From science to policy through transdisciplinary research. Environmental Science and Policy, 11(1), p.46-53. Pucher J. and Buehler R. (2008). Making cycling irresistible: lessons from the Netherlands, Denmark and Germany. Transport Reviews, 28, p.495-528. Pucher J. and Buehler R. (2010). Walking and cycling for healthy cities. Built Environment, 36(4), p.391-414.
- 29. 29 Rao A.S. and Georgeff, M.P. (1995). BDI agents: From theory to practice. In proceedings of the first international conference on multi-agent systems (ICMAS-95), San Francisco, USA. Rietveld P. and Daniel V, (2004). Determinants of bicycle use: do municipal policies matter? Transportation Research Part A: Policy and Practice, 38, p.531-50. Rittel, H. and Webber, M. (1973). ‘Dilemmas in a General Theory of Planning,’ Policy Sciences, 4, p.155-169. Robinson, J., Bradley, M., Busby, P., Connor, D., Murray, A., Sampson, B. and Soper W. (2006). Climate change and sustainable development: Realizing the opportunity. Ambio, 35(1), p.2-8 Sudeikat, J., Steghöfer, J. P., Seebach, H., Reif, W., Renz, W., Preisler, T., and Salchow, P. (2012). On the combination of top-down and bottom-up methodologies for the design of coordination mechanisms in self-organising systems. Information and Software Technology, 54(6), 593-607 Taeihagh, A. (2011). A novel approach for the development of policies for socio-technical systems. Doctoral Dissertation, University of Oxford, http://ora.ox.ac.uk/objects/uuid:0183f800-51bf-4e4d- abba-cd91b7bf48f0 Taeihagh, A., Bañares-Alcántara, R. and Millican, C. (2009a). Development of a novel framework for the design of transport policies to achieve environmental targets, Computers and Chemical Engineering, 33, 1531–1545, http://dx.doi.org/10.1016/j.compchemeng.2009.01.010 Taeihagh, A., Givoni, M., & Bañares-Alcántara, R. (2013). Which policy first? A network-centric approach for the analysis and ranking of policy measures. Environment and Planning B: Planning and Design, 40(4), 595-616. http://dx.doi.org/10.1068/b38058 Taeihagh, A., Wang, Z. and Bañares-Alcántara, R. (2009b). Why conceptual design matters in policy formulation: A case for an integrated use of complexity science and engineering design, European Conference on Complex Systems (ECCS2009), University of Warwick, UK. Thomas, R. (2010). Agent Based Systems for Prediction and Prevention of Infectious diseases. Tight M., Timms P., Banister D., Bowmaker J., Copas J., Day A., Drinkwater D., Givoni, M., Gühnemann A., Lawler M., Macmillen J., Miles A., Moore N., Newton R., Ngoduy D., Ormerod M., O’Sullivan M. and Watling D. (2011) Visions for a walking and cycling focussed urban transport system. Journal of Transport Geography, 19(6), p. 1580-1589.
- 30. 30 Urban C. (2000). PECS: A Reference model for the simulation of multi-agent systems. In R. Suleiman, K.G. Troitzsch and N. Gilbert, editors, Tools and Techniques for Social Science Simulation. Physica-Verlag, Heidelberg. Wittmann, T. (2008). Agent-based models of energy investment decisions. Physica-Verlag HD.