SlideShare a Scribd company logo
1 of 2
ESSB3134 Statistics in Social Sciences
Name:
Matric number:
Tutorial Topic 3
Question 1
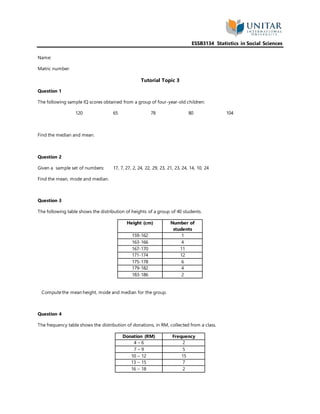
The following sample IQ scores obtained from a group of four-year-old children:
120 65 78 80 104
Find the median and mean.
Question 2
Given a sample set of numbers: 17, 7, 27, 2, 24, 22, 29, 23, 21, 23, 24, 14, 10, 24
Find the mean, mode and median.
Question 3
The following table shows the distribution of heights of a group of 40 students.
Height (cm) Number of
students
159-162 1
163-166 4
167-170 11
171-174 12
175-178 6
179-182 4
183-186 2
Computethe mean height, mode and median for the group.
Question 4
The frequency table shows the distribution of donations, in RM, collected from a class.
Donation (RM) Frequency
4 – 6 2
7 – 9 5
10 – 12 15
13 – 15 7
16 – 18 2
ESSB3134 Statistics in Social Sciences
19 - 21 1
Computethe mean, mode and median.
Question 5
The hourly wages for a sample of part-time employees at Home Depot are:
$12 $20 $16 $18 $19
Find the median and mean.
Question 6
The number of accident reported during the last twelve months in Klang Valley is shown below:
19 17 22 18 28 34
45 39 38 44 34 10
Find the median and mean.
Question 7
The frequency table shows the mass in kilogram, collected from a class.
Mass (kg) No. of students
45 – 49 5
50 – 54 12
55 – 59 25
60 – 64 6
65 - 69 2
Computethe mean, mode and median.

More Related Content

What's hot

Subtraction with zeros
Subtraction with zerosSubtraction with zeros
Subtraction with zeros
Mylady Ramos
 
Adding Subtracting Integers
Adding Subtracting IntegersAdding Subtracting Integers
Adding Subtracting Integers
Mr. M
 
Adding integers
Adding integersAdding integers
Adding integers
bweldon
 

What's hot (18)

INNOVATIVE LESSON TEMPLATE
INNOVATIVE LESSON TEMPLATEINNOVATIVE LESSON TEMPLATE
INNOVATIVE LESSON TEMPLATE
 
4-digit Numbers in words
4-digit Numbers in words4-digit Numbers in words
4-digit Numbers in words
 
lesson plan on Addition & subtraction of integers
lesson plan on Addition & subtraction of integerslesson plan on Addition & subtraction of integers
lesson plan on Addition & subtraction of integers
 
Pie chart - qualitative aptitude
Pie chart - qualitative aptitude Pie chart - qualitative aptitude
Pie chart - qualitative aptitude
 
Addition of Integers
Addition of IntegersAddition of Integers
Addition of Integers
 
Integer Lesson Plan
Integer Lesson Plan Integer Lesson Plan
Integer Lesson Plan
 
Math Trivia
Math TriviaMath Trivia
Math Trivia
 
Subtraction with zeros
Subtraction with zerosSubtraction with zeros
Subtraction with zeros
 
Day #1
Day #1Day #1
Day #1
 
Math reading and writing (2 digits)
Math  reading and writing (2 digits)Math  reading and writing (2 digits)
Math reading and writing (2 digits)
 
Word problems
Word problemsWord problems
Word problems
 
ROUNDING OFF NUMBERS
ROUNDING OFF NUMBERSROUNDING OFF NUMBERS
ROUNDING OFF NUMBERS
 
Photography ppt
Photography pptPhotography ppt
Photography ppt
 
Integers in real world
Integers in real worldIntegers in real world
Integers in real world
 
Probability Trivia
Probability TriviaProbability Trivia
Probability Trivia
 
Adding Subtracting Integers
Adding Subtracting IntegersAdding Subtracting Integers
Adding Subtracting Integers
 
Adding integers
Adding integersAdding integers
Adding integers
 
Mathematics - Writing in words
Mathematics - Writing in wordsMathematics - Writing in words
Mathematics - Writing in words
 

Similar to L3_Tutorial_Topic_3.docx

Grade 5 PPT_Math_Q1_W4_Day 1-512345678.pptx
Grade 5 PPT_Math_Q1_W4_Day 1-512345678.pptxGrade 5 PPT_Math_Q1_W4_Day 1-512345678.pptx
Grade 5 PPT_Math_Q1_W4_Day 1-512345678.pptx
michellecatalan7
 
Kumpulan soal statistik dalam Bahasa Inggris
Kumpulan soal statistik dalam Bahasa InggrisKumpulan soal statistik dalam Bahasa Inggris
Kumpulan soal statistik dalam Bahasa Inggris
Retna Rindayani
 
Outreach p6-math.#
Outreach p6-math.#Outreach p6-math.#
Outreach p6-math.#
Azis Ibrahim
 
1. What type of research uses numeric measurement data (Points .docx
1. What type of research uses numeric measurement data (Points  .docx1. What type of research uses numeric measurement data (Points  .docx
1. What type of research uses numeric measurement data (Points .docx
paynetawnya
 

Similar to L3_Tutorial_Topic_3.docx (20)

Grade 5 PPT_Math_Q1_W4_Day 1-512345678.pptx
Grade 5 PPT_Math_Q1_W4_Day 1-512345678.pptxGrade 5 PPT_Math_Q1_W4_Day 1-512345678.pptx
Grade 5 PPT_Math_Q1_W4_Day 1-512345678.pptx
 
Measures of Central tendency
Measures of Central tendencyMeasures of Central tendency
Measures of Central tendency
 
Kumpulan soal statistik dalam Bahasa Inggris
Kumpulan soal statistik dalam Bahasa InggrisKumpulan soal statistik dalam Bahasa Inggris
Kumpulan soal statistik dalam Bahasa Inggris
 
Chapter 3.2
Chapter 3.2Chapter 3.2
Chapter 3.2
 
Outreach p4-math
Outreach p4-mathOutreach p4-math
Outreach p4-math
 
C24
C24C24
C24
 
(7) Lesson 4.2 - Compare and order Rational Numbers
(7) Lesson 4.2 - Compare and order Rational Numbers(7) Lesson 4.2 - Compare and order Rational Numbers
(7) Lesson 4.2 - Compare and order Rational Numbers
 
data handeling.pptx
data handeling.pptxdata handeling.pptx
data handeling.pptx
 
central tendency
central tendency central tendency
central tendency
 
Data Presentation
Data PresentationData Presentation
Data Presentation
 
Data handling class 8
Data handling class 8 Data handling class 8
Data handling class 8
 
Measures of Central Tendency Final.ppt
Measures of Central Tendency Final.pptMeasures of Central Tendency Final.ppt
Measures of Central Tendency Final.ppt
 
Measures of Central Tendency Final.ppt
Measures of Central Tendency Final.pptMeasures of Central Tendency Final.ppt
Measures of Central Tendency Final.ppt
 
Outreach p6-math.#
Outreach p6-math.#Outreach p6-math.#
Outreach p6-math.#
 
Outreach p6-math@
Outreach p6-math@Outreach p6-math@
Outreach p6-math@
 
Measures of central tendecy
Measures of central tendecyMeasures of central tendecy
Measures of central tendecy
 
9 Data Handling.pptx
9 Data Handling.pptx9 Data Handling.pptx
9 Data Handling.pptx
 
1. What type of research uses numeric measurement data (Points .docx
1. What type of research uses numeric measurement data (Points  .docx1. What type of research uses numeric measurement data (Points  .docx
1. What type of research uses numeric measurement data (Points .docx
 
Lesson Plan- Measures of Central tendency of Data
Lesson Plan- Measures of Central tendency of DataLesson Plan- Measures of Central tendency of Data
Lesson Plan- Measures of Central tendency of Data
 
Module 2 statistics
Module 2   statisticsModule 2   statistics
Module 2 statistics
 

Recently uploaded

Beyond the EU: DORA and NIS 2 Directive's Global Impact
Beyond the EU: DORA and NIS 2 Directive's Global ImpactBeyond the EU: DORA and NIS 2 Directive's Global Impact
Beyond the EU: DORA and NIS 2 Directive's Global Impact
PECB
 
1029-Danh muc Sach Giao Khoa khoi 6.pdf
1029-Danh muc Sach Giao Khoa khoi  6.pdf1029-Danh muc Sach Giao Khoa khoi  6.pdf
1029-Danh muc Sach Giao Khoa khoi 6.pdf
QucHHunhnh
 

Recently uploaded (20)

Beyond the EU: DORA and NIS 2 Directive's Global Impact
Beyond the EU: DORA and NIS 2 Directive's Global ImpactBeyond the EU: DORA and NIS 2 Directive's Global Impact
Beyond the EU: DORA and NIS 2 Directive's Global Impact
 
Disha NEET Physics Guide for classes 11 and 12.pdf
Disha NEET Physics Guide for classes 11 and 12.pdfDisha NEET Physics Guide for classes 11 and 12.pdf
Disha NEET Physics Guide for classes 11 and 12.pdf
 
microwave assisted reaction. General introduction
microwave assisted reaction. General introductionmicrowave assisted reaction. General introduction
microwave assisted reaction. General introduction
 
INDIA QUIZ 2024 RLAC DELHI UNIVERSITY.pptx
INDIA QUIZ 2024 RLAC DELHI UNIVERSITY.pptxINDIA QUIZ 2024 RLAC DELHI UNIVERSITY.pptx
INDIA QUIZ 2024 RLAC DELHI UNIVERSITY.pptx
 
Mattingly "AI & Prompt Design: Structured Data, Assistants, & RAG"
Mattingly "AI & Prompt Design: Structured Data, Assistants, & RAG"Mattingly "AI & Prompt Design: Structured Data, Assistants, & RAG"
Mattingly "AI & Prompt Design: Structured Data, Assistants, & RAG"
 
The Most Excellent Way | 1 Corinthians 13
The Most Excellent Way | 1 Corinthians 13The Most Excellent Way | 1 Corinthians 13
The Most Excellent Way | 1 Corinthians 13
 
Z Score,T Score, Percential Rank and Box Plot Graph
Z Score,T Score, Percential Rank and Box Plot GraphZ Score,T Score, Percential Rank and Box Plot Graph
Z Score,T Score, Percential Rank and Box Plot Graph
 
Código Creativo y Arte de Software | Unidad 1
Código Creativo y Arte de Software | Unidad 1Código Creativo y Arte de Software | Unidad 1
Código Creativo y Arte de Software | Unidad 1
 
Paris 2024 Olympic Geographies - an activity
Paris 2024 Olympic Geographies - an activityParis 2024 Olympic Geographies - an activity
Paris 2024 Olympic Geographies - an activity
 
Mattingly "AI & Prompt Design: The Basics of Prompt Design"
Mattingly "AI & Prompt Design: The Basics of Prompt Design"Mattingly "AI & Prompt Design: The Basics of Prompt Design"
Mattingly "AI & Prompt Design: The Basics of Prompt Design"
 
Q4-W6-Restating Informational Text Grade 3
Q4-W6-Restating Informational Text Grade 3Q4-W6-Restating Informational Text Grade 3
Q4-W6-Restating Informational Text Grade 3
 
A Critique of the Proposed National Education Policy Reform
A Critique of the Proposed National Education Policy ReformA Critique of the Proposed National Education Policy Reform
A Critique of the Proposed National Education Policy Reform
 
Sports & Fitness Value Added Course FY..
Sports & Fitness Value Added Course FY..Sports & Fitness Value Added Course FY..
Sports & Fitness Value Added Course FY..
 
Web & Social Media Analytics Previous Year Question Paper.pdf
Web & Social Media Analytics Previous Year Question Paper.pdfWeb & Social Media Analytics Previous Year Question Paper.pdf
Web & Social Media Analytics Previous Year Question Paper.pdf
 
social pharmacy d-pharm 1st year by Pragati K. Mahajan
social pharmacy d-pharm 1st year by Pragati K. Mahajansocial pharmacy d-pharm 1st year by Pragati K. Mahajan
social pharmacy d-pharm 1st year by Pragati K. Mahajan
 
Measures of Dispersion and Variability: Range, QD, AD and SD
Measures of Dispersion and Variability: Range, QD, AD and SDMeasures of Dispersion and Variability: Range, QD, AD and SD
Measures of Dispersion and Variability: Range, QD, AD and SD
 
APM Welcome, APM North West Network Conference, Synergies Across Sectors
APM Welcome, APM North West Network Conference, Synergies Across SectorsAPM Welcome, APM North West Network Conference, Synergies Across Sectors
APM Welcome, APM North West Network Conference, Synergies Across Sectors
 
1029-Danh muc Sach Giao Khoa khoi 6.pdf
1029-Danh muc Sach Giao Khoa khoi  6.pdf1029-Danh muc Sach Giao Khoa khoi  6.pdf
1029-Danh muc Sach Giao Khoa khoi 6.pdf
 
Key note speaker Neum_Admir Softic_ENG.pdf
Key note speaker Neum_Admir Softic_ENG.pdfKey note speaker Neum_Admir Softic_ENG.pdf
Key note speaker Neum_Admir Softic_ENG.pdf
 
Student login on Anyboli platform.helpin
Student login on Anyboli platform.helpinStudent login on Anyboli platform.helpin
Student login on Anyboli platform.helpin
 

L3_Tutorial_Topic_3.docx

  • 1. ESSB3134 Statistics in Social Sciences Name: Matric number: Tutorial Topic 3 Question 1 The following sample IQ scores obtained from a group of four-year-old children: 120 65 78 80 104 Find the median and mean. Question 2 Given a sample set of numbers: 17, 7, 27, 2, 24, 22, 29, 23, 21, 23, 24, 14, 10, 24 Find the mean, mode and median. Question 3 The following table shows the distribution of heights of a group of 40 students. Height (cm) Number of students 159-162 1 163-166 4 167-170 11 171-174 12 175-178 6 179-182 4 183-186 2 Computethe mean height, mode and median for the group. Question 4 The frequency table shows the distribution of donations, in RM, collected from a class. Donation (RM) Frequency 4 – 6 2 7 – 9 5 10 – 12 15 13 – 15 7 16 – 18 2
  • 2. ESSB3134 Statistics in Social Sciences 19 - 21 1 Computethe mean, mode and median. Question 5 The hourly wages for a sample of part-time employees at Home Depot are: $12 $20 $16 $18 $19 Find the median and mean. Question 6 The number of accident reported during the last twelve months in Klang Valley is shown below: 19 17 22 18 28 34 45 39 38 44 34 10 Find the median and mean. Question 7 The frequency table shows the mass in kilogram, collected from a class. Mass (kg) No. of students 45 – 49 5 50 – 54 12 55 – 59 25 60 – 64 6 65 - 69 2 Computethe mean, mode and median.