

Recommended
More Related Content
What's hot
What's hot (20)
Similar to Before the Open April 13 2017
Similar to Before the Open April 13 2017 (15)
More from John Pendrith
More from John Pendrith (20)
Recently uploaded
Recently uploaded (20)
Before the Open April 13 2017
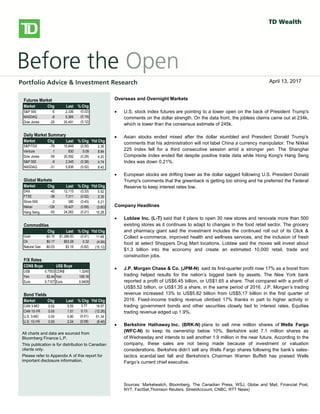
- 1. bbbsb Overseas/Overnight Markets U.S. stock index futures fell, taking a cue from European and Asian markets, as worries over global growth prospects and the outcome of Greece’s private-sector bond swap later this week weigh on sentiment. There is no U.S. economic data on the docket today. European stocks dropped, with banks and resource stocks among the `largest detractors. A report released this morning showed a 0.3% Q/Q contraction in the euro-area economy in Q4, confirming an initial estimate published on February 15. Large declines in investment, exports and consumer spending were to blame for the overall GDP contraction. Also weighing on investors was a memo from the Institute of International Finance that warned that a disorderly default would cause the euro zone more than 1 trillion euros ($1.36 trillion) in damage, Reuters reported. The report also stated that a default would likely force Italy and Spain to seek aid to prevent being engulfed in the region’s debt crisis. Private investors that have declared their participation in Greece’s debt restructuring hold about 20% of the bonds involved in a swap, the creditors’ stering committee said yesterday. The goal of the swap, which runs through March 8, is to reduce the amount of privately-held Greek debt by 53.5% and help secure Greece’s second rescue package. Asian stocks fell sharply, with miners among the top declines, following global markets lower on growth concerns. The Hang Seng shed 2.2%, while the Shanghai Composite fell 1.4%. Japan’s Nikkei gave up a more modest 0.6%. North American Market Highlights & Headlines Aecon Group Inc. (ARE-T) reported a 143% increase in quarterly earnings on Monday as margins improved on lower costs. Aecon reported EPS of $0.49, up from $0.20 a year ago. Revenue in the quarter was $790 million, down from $841 million, and well shy of the $859 million consensus estimate. Aecon's backlog stood at $2.39 billion at December 31, 2011. Futures Market Market Chg Last % Chg S&P 500 -5 2,336 (0.22) NASDAQ -8 5,365 (0.14) Dow Jones -25 20,491 (0.12) Daily Market Summary Market Chg Last % Chg Ytd Chg S&P/TSX -79 15,648 (0.50) 2.36 Venture 1 830 0.09 8.84 Dow Jones -59 20,592 (0.29) 4.20 S&P 500 -9 2,345 (0.38) 4.74 NASDAQ -31 5,836 (0.52) 8.42 Global Markets Market Chg Last % Chg Ytd Chg DAX -40 12,115 (0.33) 5.52 FTSE -38 7,311 (0.52) 2.35 Stoxx 600 -2 380 (0.43) 5.21 Nikkei -126 18,427 (0.68) (3.60) Hang Seng -52 24,262 (0.21) 10.28 Commodities Chg Last % Chg Ytd Chg Gold -$0.10 $1,286.83 (0.01) 11.68 Oil $0.17 $53.28 0.32 (4.94) Natural Gas -$0.03 $3.16 (0.82) (15.12) F/X Rates CDN$ Buys US$ Buys US$ 0.7553 CDN$ 1.3240 Yen 82.44 Yen 109.16 Euro 0.7107 Euro 0.9409 Bond Yields Market Chg Last % Chg Ytd Chg CAN 3-MO 0.02 0.55 3.77 19.57 CAN 10-YR 0.00 1.51 0.13 (12.26) U.S. 3-MO 0.00 0.80 (0.01) 61.34 U.S. 10-YR 0.00 2.24 (0.08) (8.46) All charts and data are sourced from Bloomberg Finance L.P. This publication is for distribution to Canadian clients only. Please refer to Appendix A of this report for important disclosure information. Overseas and Overnight Markets U.S. stock index futures are pointing to a lower open on the back of President Trump's comments on the dollar strength. On the data front, the jobless claims came out at 234k, which is lower than the consensus estimate of 245k. Asian stocks ended mixed after the dollar stumbled and President Donald Trump's comments that his administration will not label China a currency manipulator. The Nikkei 225 Index fell for a third consecutive session amid a stronger yen. The Shanghai Composite Index ended flat despite positive trade data while Hong Kong's Hang Seng Index was down 0.21%. European stocks are drifting lower as the dollar sagged following U.S. President Donald Trump's comments that the greenback is getting too strong and he preferred the Federal Reserve to keep interest rates low. Company Headlines Loblaw Inc. (L-T) said that it plans to open 30 new stores and renovate more than 500 existing stores as it continues to adapt to changes in the food retail sector. The grocery and pharmacy giant said the investment includes the continued roll out of its Click & Collect e-commerce, improved health and wellness services, and the inclusion of fresh food at select Shoppers Drug Mart locations. Loblaw said the moves will invest about $1.3 billion into the economy and create an estimated 10,000 retail, trade and construction jobs. J.P. Morgan Chase & Co. (JPM-N) said its first-quarter profit rose 17% as a boost from trading helped results for the nation’s biggest bank by assets. The New York bank reported a profit of US$6.45 billion, or US$1.65 a share. That compared with a profit of US$5.52 billion, or US$1.35 a share, in the same period of 2016. J.P. Morgan’s trading revenue increased 13% to US$5.82 billion from US$5.17 billion in the first quarter of 2016. Fixed-income trading revenue climbed 17% thanks in part to higher activity in trading government bonds and other securities closely tied to interest rates. Equities trading revenue edged up 1.9%. Berkshire Hathaway Inc. (BRK-N) plans to sell nine million shares of Wells Fargo (WFC-N) to keep its ownership below 10%. Berkshire sold 7.1 million shares as of Wednesday and intends to sell another 1.9 million in the near future. According to the company, these sales are not being made because of investment or valuation considerations. Berkshire didn’t sell any Wells Fargo shares following the bank’s sales- tactics scandal last fall and Berkshire's Chairman Warren Buffett has praised Wells Fargo’s current chief executive. Sources: Marketwatch, Bloomberg, The Canadian Press, WSJ, Globe and Mail, Financial Post, NYT, FactSet,Thomson Reuters, StreetAccount, CNBC, RTT News) April 13, 2017
- 2. Before the Open April 13, 2017 Page 2 Canadian Equities Upgrades - March 6 Weekly Canada Economic Calendar - April 10 to April 14, 2017 Date/Time Event Period Consensus Actual Prior 04/10/2017 08:15 Housing Starts Mar 214.5k 253.7k 214.3k 04/10/2017 10:00 Bloomberg Nanos Confidence 7-Apr -- 58.9 58.7 04/12/2017 08:30 Teranet/National Bank HPI MoM Mar -- 0.90% 1.00% 04/12/2017 08:30 Teranet/National Bank HP Index Mar -- 204.05 202.25 04/12/2017 08:30 Teranet/National Bank HPI YoY Mar -- 13.50% 13.40% 04/12/2017 10:00 Bank of Canada Rate Decision 12-Apr 0.50% 0.50% 0.50% 04/12/2017 10:00 Bank of Canada Releases April Monetary Policy Report 04/13/2017 08:30 New Housing Price Index MoM Feb -- 0.40% 0.10% 04/13/2017 08:30 New Housing Price Index YoY Feb -- 3.30% 3.10% 04/13/2017 08:30 Manufacturing Sales MoM Feb -0.70% -0.20% 0.60% S&P/TSX Daily Performance 13000 13500 14000 14500 15000 15500 16000 Apr-16 Jun-16 Aug-16 Oct-16 Dec-16 Feb-17 Apr-17 Leaders - Prior Session Company Ticker % Change BlackBerry Ltd BB-T 15.38 Ivanhoe Mines Ltd IVN-T 6.27 Shaw Communications Inc SJR/B-T 4.81 Interfor Corp IFP-T 3.17 Kirkland Lake Gold Ltd KL-T 2.91 Laggards - Prior Session Company Ticker % Change Bombardier Inc BBD/B-T -6.33 Teck Resources Ltd TECK/B-T -5.87 Hudbay Minerals Inc HBM-T -5.69 Labrador Iron Ore Royalty Corp LIF-T -5.20 Bonavista Energy Corp BNP-T -5.16 Canadian Equity Upgrades Birchcliff Energy Upgraded to Top Pick at Cormark Blackberry Upgraded to Sector Perform at Scotia Canadian Equity Downgrades N/A Today's Earnings – Canada DealNet Capital Corp -$0.01, Madalena Energy Inc -$0.03, Rye Patch Gold Corp $0.01, Cronos Group Inc -$0.01, Leucrotta Exploration Inc -$0.01
- 3. Before the Open April 13, 2017 Page 3 Weekly U.S. Economic Calendar - April 10 to April 14, 2017 Date/Time Event Period Consensus Actual Prior 04/10/2017 10:00 Labor Market Conditions Index Change Mar 0.8 0.4 1.5 04/11/2017 06:00 NFIB Small Business Optimism Mar 104.7 104.7 105.3 04/11/2017 10:00 JOLTS Job Openings Feb 5650 5743 5625 04/12/2017 07:00 MBA Mortgage Applications 7-Apr -- 1.50% -1.60% 04/12/2017 08:30 Import Price Index MoM Mar -0.20% -0.20% 0.40% 04/12/2017 08:30 Import Price Index YoY Mar 4.00% 4.20% 4.80% 04/12/2017 08:30 Import Price Index ex Petroleum MoM Mar 0.00% 0.20% 0.30% 04/12/2017 08:30 Export Price Index MoM Mar 0.00% 0.20% 0.30% 04/12/2017 08:30 Export Price Index YoY Mar -- 3.60% 3.20% 04/12/2017 14:00 Monthly Budget Statement Mar -$167.0b -$176.2b -$108.0b 04/13/2017 08:30 PPI Final Demand MoM Mar 0.00% -0.10% 0.30% 04/13/2017 08:30 PPI Ex Food and Energy MoM Mar 0.20% 0.00% 0.30% 04/13/2017 08:30 PPI Ex Food, Energy, Trade MoM Mar 0.20% 0.10% 0.30% 04/13/2017 08:30 PPI Final Demand YoY Mar 2.40% 2.30% 2.20% 04/13/2017 08:30 PPI Ex Food and Energy YoY Mar 1.80% 1.60% 1.50% 04/13/2017 08:30 PPI Ex Food, Energy, Trade YoY Mar -- 1.70% 1.80% 04/13/2017 08:30 Initial Jobless Claims 8-Apr 245k 234k 235k 04/13/2017 08:30 Continuing Claims 1-Apr 2024k 2028k 2028k 04/13/2017 09:45 Bloomberg Consumer Comfort 9-Apr -- -- 50.2 04/13/2017 10:00 U. of Mich. Sentiment Apr P 96.5 -- 96.9 04/13/2017 10:00 U. of Mich. Current Conditions Apr P -- -- 113.2 04/13/2017 10:00 U. of Mich. Expectations Apr P -- -- 86.5 04/13/2017 10:00 U. of Mich. 1 Yr Inflation Apr P -- -- 2.50% 04/13/2017 10:00 U. of Mich. 5-10 Yr Inflation Apr P -- -- 2.40% S&P 500 Daily Performance 1950 2050 2150 2250 2350 2450 Apr-16 Jun-16 Aug-16 Oct-16 Dec-16 Feb-17 Apr-17 Leaders - Prior Session Company Ticker % Change HP Inc HPQ-US 2.74 DXC Technology Co DXC-US 2.49 Tyson Foods Inc TSN-US 2.23 Whole Foods Market Inc WFM-US 1.70 PepsiCo Inc PEP-US 1.68 Laggards - Prior Session Company Ticker % Change Tractor Supply Co TSCO-US -8.32 Fastenal Co FAST-US -8.05 Freeport-McMoRan Inc FCX-US -5.43 Nucor Corp NUE-US -4.33 Broadcom Ltd AVGO-US -3.84 U.S. Equity Upgrades NuStar Raised to Neutral at Credit Suisse Skywest Raised to Strong Buy at Raymond James U.S. Equity Downgrades Automotive Properties Cut to Hold at Industrial Alliance Today's Earnings – U.S. First Republic Bank/CA $1.01, PNC Financial Services Group Inc/The $1.84, JPMorgan Chase & Co $1.52, Wells Fargo & Co $0.97, Citigroup Inc $1.24, Tonix Pharmaceuticals Holding Corp -$1.30
- 4. Before the Open April 13, 2017 Page 4 Appendix A - Important Information General Research Disclaimer The statements and statistics contained herein are based on material believed to be reliable, but are not guaranteed to be accurate or complete. This report is for informational purposes only and is not an offer or solicitation with respect to the purchase or sale of any investment fund, security or other product. Particular investment, trading, or tax strategies should be evaluated relative to each individual’s objectives. Graphs and charts are used for illustrative purposes only and do not reflect future values or future performance. This document does not provide individual financial, legal, investment or tax advice. Please consult your own legal, investment and tax advisor. All opinions and other information in this document are subject to change without notice. The Toronto-Dominion Bank and its affiliates and related entities are not liable for any errors or omissions in the information or for any loss or damage suffered. TD Waterhouse Canada Inc. and/or its affiliated persons or companies may hold a position in the securities mentioned, including options, futures and other derivative instruments thereon, and may, as principal or agent, buy or sell such securities. Affiliated persons or companies may also make a market in and participate in an underwriting of such securities. Full disclosures for all companies covered by TD Securities Inc. can be viewed at https://www.tdsresearch.com/equities/welcome.important.disclosure.action Research Ratings Action List BUY: The stock’s total return is expected to exceed a minimum of 15%, on a risk-adjusted basis, over the next 12 months and it is a top pick in the Analyst’s sector. BUY: The stock’s total return is expected to exceed a minimum of 15%, on a risk-adjusted basis, over the next 12 months. SPECULATIVE BUY: The stock’s total return is expected to exceed 30% over the next 12 months; however, there is material event risk associated with the investment that could result in significant loss. HOLD: The stock’s total return is expected to be between 0% and 15%, on a risk-adjusted basis, over the next 12 months. TENDER: Investors are advised to tender their shares to a specific offer for the company’s securities. REDUCE: The stock’s total return is expected to be negative over the next 12 months. Technical Research Disclaimer The opinions expressed herein reflect a technical perspective and may differ from fundamental research on these issuers. Fundamental research can be obtained through your TD Wealth advisor or on the Markets and Research site within WebBroker. The technical research opinions contained in this report are based on historical technical data and expectations of the most likely direction of a market or security. No guarantee of that outcome is ever implied. Research Report Dissemination Policy TD Waterhouse Canada Inc. makes its research products available in electronic format. These research products are posted to our proprietary websites for all eligible clients to access by password and we distribute the information to our sales personnel who then may distribute it to their retail clients under the appropriate circumstances either by email, fax or regular mail. No recipient may pass on to any other person, or reproduce by any means, the information contained in this report without our prior written consent. Analyst Certification The Portfolio Advice and Investment Research analyst(s) responsible for this report hereby certify that (i) the recommendations and technical opinions expressed in the research report accurately reflect the personal views of the analyst(s) about any and all of the securities or issuers discussed herein, and (ii) no part of the research analyst’s compensation was, is, or will be, directly or indirectly, related to the provision of specific recommendations or views expressed by the research analyst in the research report. Conflicts of Interest The Portfolio Advice & Investment Research analyst(s) responsible for this report may own securities of the issuer(s) discussed in this report. As with most other employees, the analyst(s) who prepared this report are compensated based upon (among other factors) the overall profitability of TD Waterhouse Canada Inc. and its affiliates, which includes the overall profitability of investment banking services, however TD Waterhouse Canada Inc. does not compensate its analysts based on specific investment banking transactions.
- 5. Before the Open April 13, 2017 Page 5 Corporate Disclosure TD Wealth represents the products and services offered by TD Waterhouse Canada Inc. (Member – Canadian Investor Protection Fund), TD Waterhouse Private Investment Counsel Inc., TD Wealth Private Banking (offered by The Toronto-Dominion Bank) and TD Wealth Private Trust (offered by The Canada Trust Company). The Portfolio Advice and Investment Research team is part of TD Waterhouse Canada Inc., a subsidiary of The Toronto-Dominion Bank. Trade-mark Disclosures Bloomberg and Bloomberg.com are trademarks and service marks of Bloomberg Finance L.P., a Delaware limited partnership, or its subsidiaries. All rights reserved. “TD Securities” is the trade name which TD Securities Inc. and TD Securities (USA) LLC. jointly use to market their institutional equity services. TD Securities is a trade-mark of The Toronto-Dominion Bank representing TD Securities Inc., TD Securities (USA) LLC, TD Securities Limited and certain corporate and investment banking activities of The Toronto-Dominion Bank. All trademarks are the property of their respective owners. ® The TD logo and other trade-marks are the property of The Toronto-Dominion Bank. FTSE TMX Global Debt Capital Markets Inc. 2016 "FTSE®" is a trade mark of FTSE International Ltd and is used under licence. "TMX” is a trade mark of TSX Inc. and is used under licence. All rights in the FTSE TMX Global Debt Capital Markets Inc.'s indices and / or FTSE TMX Global Debt Capital Markets Inc.'s ratings vest in FTSE TMX Global Debt Capital Markets Inc. and/or its licensors. Neither FTSE TMX Global Debt Capital Markets Inc. nor its licensors accept any liability for any errors or omissions in such indices and / or ratings or underlying data. No further distribution of FTSE TMX Global Debt Capital Markets Inc.'s data is permitted without FTSE TMX Global Debt Capital Markets Inc.'s express written consent.