Before the Open July 18 2017
•
1 like•93 views

- US and European stock futures pointed lower, while Asian markets also fell, as concerns about global growth weighed on investor sentiment. - In Europe, stocks dropped led by declines in banks and resource stocks, as Eurozone GDP contracted 0.3% in Q4 according to a report. - In Asia, stocks fell sharply led by miners, following declines in global markets on growth worries. The Hang Seng shed 2.2% and Shanghai fell 1.4%. - Aecon Group reported a 143% rise in quarterly earnings but revenue missed estimates, while its backlog was $2.39 billion.

Recommended
More Related Content
What's hot
What's hot (20)
Similar to Before the Open July 18 2017
Similar to Before the Open July 18 2017 (17)
More from John Pendrith
Recently uploaded
Recently uploaded (20)
Before the Open July 18 2017
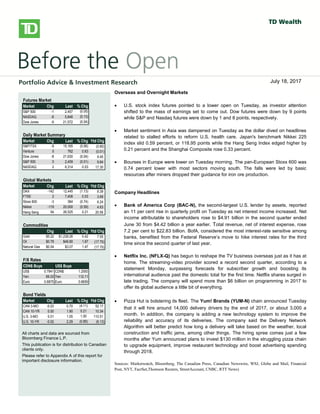
- 1. bbbsb Overseas/Overnight Markets U.S. stock index futures fell, taking a cue from European and Asian markets, as worries over global growth prospects and the outcome of Greece’s private-sector bond swap later this week weigh on sentiment. There is no U.S. economic data on the docket today. European stocks dropped, with banks and resource stocks among the `largest detractors. A report released this morning showed a 0.3% Q/Q contraction in the euro-area economy in Q4, confirming an initial estimate published on February 15. Large declines in investment, exports and consumer spending were to blame for the overall GDP contraction. Also weighing on investors was a memo from the Institute of International Finance that warned that a disorderly default would cause the euro zone more than 1 trillion euros ($1.36 trillion) in damage, Reuters reported. The report also stated that a default would likely force Italy and Spain to seek aid to prevent being engulfed in the region’s debt crisis. Private investors that have declared their participation in Greece’s debt restructuring hold about 20% of the bonds involved in a swap, the creditors’ stering committee said yesterday. The goal of the swap, which runs through March 8, is to reduce the amount of privately-held Greek debt by 53.5% and help secure Greece’s second rescue package. Asian stocks fell sharply, with miners among the top declines, following global markets lower on growth concerns. The Hang Seng shed 2.2%, while the Shanghai Composite fell 1.4%. Japan’s Nikkei gave up a more modest 0.6%. North American Market Highlights & Headlines Aecon Group Inc. (ARE-T) reported a 143% increase in quarterly earnings on Monday as margins improved on lower costs. Aecon reported EPS of $0.49, up from $0.20 a year ago. Revenue in the quarter was $790 million, down from $841 million, and well shy of the $859 million consensus estimate. Aecon's backlog stood at $2.39 billion at December 31, 2011. Futures Market Market Chg Last % Chg S&P 500 -1 2,457 (0.05) NASDAQ -8 5,848 (0.13) Dow Jones -9 21,572 (0.04) Daily Market Summary Market Chg Last % Chg Ytd Chg S&P/TSX -9 15,165 (0.06) (0.80) Venture 5 762 0.63 (0.01) Dow Jones -8 21,630 (0.04) 9.45 S&P 500 0 2,459 (0.01) 9.84 NASDAQ 2 6,314 0.03 17.30 Global Markets Market Chg Last % Chg Ytd Chg DAX -142 12,445 (1.13) 8.39 FTSE 2 7,406 0.03 3.69 Stoxx 600 -3 384 (0.74) 6.24 Nikkei -119 20,000 (0.59) 4.63 Hang Seng 54 26,525 0.21 20.56 Commodities Chg Last % Chg Ytd Chg Gold $5.22 $1,239.26 0.42 7.55 Oil $0.78 $46.80 1.67 (17.75) Natural Gas $0.04 $3.07 1.47 (17.70) F/X Rates CDN$ Buys US$ Buys US$ 0.7941 CDN$ 1.2593 Yen 89.03 Yen 112.11 Euro 0.6875 Euro 0.8659 Bond Yields Market Chg Last % Chg Ytd Chg CAN 3-MO -0.03 0.70 (4.11) 52.17 CAN 10-YR 0.00 1.90 0.21 10.34 U.S. 3-MO 0.01 1.05 1.00 110.51 U.S. 10-YR -0.02 2.29 (0.85) (6.13) All charts and data are sourced from Bloomberg Finance L.P. This publication is for distribution to Canadian clients only. Please refer to Appendix A of this report for important disclosure information. Overseas and Overnight Markets U.S. stock index futures pointed to a lower open on Tuesday, as investor attention shifted to the mass of earnings set to come out. Dow futures were down by 9 points while S&P and Nasdaq futures were down by 1 and 8 points, respectively. Market sentiment in Asia was dampened on Tuesday as the dollar dived on headlines related to stalled efforts to reform U.S. health care. Japan's benchmark Nikkei 225 index slid 0.59 percent, or 118.95 points while the Hang Seng Index edged higher by 0.21 percent and the Shanghai Composite rose 0.33 percent. Bourses in Europe were lower on Tuesday morning. The pan-European Stoxx 600 was 0.74 percent lower with most sectors moving south. The falls were led by basic resources after miners dropped their guidance for iron ore production. Company Headlines Bank of America Corp (BAC-N), the second-largest U.S. lender by assets, reported an 11 per cent rise in quarterly profit on Tuesday as net interest income increased. Net income attributable to shareholders rose to $4.91 billion in the second quarter ended June 30 from $4.42 billion a year earlier. Total revenue, net of interest expense, rose 7.2 per cent to $22.83 billion. BofA, considered the most interest-rate sensitive among banks, benefited from the Federal Reserve’s move to hike interest rates for the third time since the second quarter of last year. Netflix Inc. (NFLX-Q) has begun to reshape the TV business overseas just as it has at home. The streaming-video provider scored a record second quarter, according to a statement Monday, surpassing forecasts for subscriber growth and boosting its international audience past the domestic total for the first time. Netflix shares surged in late trading. The company will spend more than $6 billion on programming in 2017 to offer its global audience a little bit of everything. Pizza Hut is bolstering its fleet. The Yum! Brands (YUM-N) chain announced Tuesday that it will hire around 14,000 delivery drivers by the end of 2017, or about 3,000 a month. In addition, the company is adding a new technology system to improve the reliability and accuracy of its deliveries. The company said the Delivery Network Algorithm will better predict how long a delivery will take based on the weather, local construction and traffic jams, among other things. The hiring spree comes just a few months after Yum announced plans to invest $130 million in the struggling pizza chain to upgrade equipment, improve restaurant technology and boost advertising spending through 2018. Sources: Marketwatch, Bloomberg, The Canadian Press, Canadian Newswire, WSJ, Globe and Mail, Financial Post, NYT, FactSet,Thomson Reuters, StreetAccount, CNBC, RTT News) July 18, 2017
- 2. Before the Open July 18, 2017 Page 2 * Canadian Equities Upgrades - March 6 Weekly Canada Economic Calendar - July 17 to July 21, 2017 Date/Time Event Period Consensus Actual Prior 07/17/2017 08:30 Int'l Securities Transactions May -- 29.46b 10.61b 07/17/2017 09:00 Existing Home Sales MoM Jun -- -6.70% -6.20% 07/17/2017 10:00 Bloomberg Nanos Confidence 14-Jul -- 58.2 58.3 07/19/2017 08:30 Manufacturing Sales MoM May 0.80% -- 1.10% 07/21/2017 08:30 CPI NSA MoM Jun 0.00% -- 0.10% 07/21/2017 08:30 CPI YoY Jun 1.10% -- 1.30% 07/21/2017 08:30 Consumer Price Index Jun 130.5 -- 130.5 07/21/2017 08:30 CPI Core- Common YoY% Jun 1.30% -- 1.30% 07/21/2017 08:30 CPI Core- Trim YoY% Jun -- -- 1.20% 07/21/2017 08:30 CPI Core- Median YoY% Jun -- -- 1.50% 07/21/2017 08:30 Retail Sales MoM May 0.30% -- 0.80% 07/21/2017 08:30 Retail Sales Ex Auto MoM May 0.10% -- 1.50% S&P/TSX Daily Performance 13000 13500 14000 14500 15000 15500 16000 Jul-16 Sep-16 Nov-16 Jan-17 Mar-17 May-17 Jul-17 Leaders - Prior Session Company Ticker % Change First Quantum Minerals Ltd FM-T 8.82 NexGen Energy Ltd NXE-T 7.43 Hudbay Minerals Inc HBM-T 6.60 Dominion Diamond Corp DDC-T 5.56 ProMetic Life Sciences Inc PLI-T 5.16 Laggards - Prior Session Company Ticker % Change Colliers International Group Inc CIGI-T -7.66 Home Capital Group Inc HCG-T -4.65 New Flyer Industries Inc NFI-T -4.36 WSP Global Inc WSP-T -3.78 WestJet Airlines Ltd WJA-T -3.33 Canadian Equity Upgrades Hudbay Minerals raised to Action List Buy at TD Canadian Equity Downgrades Dominion Diamond cut to Market Perform at BMO Denison Mines cut to Underperform at Credit Suisse Today's Earnings – Canada Winpak Ltd $0.42
- 3. Before the Open July 18, 2017 Page 3 Weekly U.S. Economic Calendar - July 17 to July 21, 2017 Date/Time Event Period Consensus Actual Prior 07/17/2017 08:30 Empire Manufacturing Jul 15 9.8 19.8 07/18/2017 08:30 Import Price Index MoM Jun -0.20% -- -0.30% 07/18/2017 08:30 Import Price Index ex Petroleum MoM Jun 0.00% -- 0.00% 07/18/2017 08:30 Import Price Index YoY Jun 1.30% -- 2.10% 07/18/2017 08:30 Export Price Index MoM Jun 0.00% -- -0.70% 07/18/2017 08:30 Export Price Index YoY Jun -- -- 1.40% 07/18/2017 10:00 NAHB Housing Market Index Jul 67 -- 67 07/18/2017 16:00 Total Net TIC Flows May -- -- $65.8b 07/18/2017 16:00 Net Long-term TIC Flows May -- -- $1.8b 07/19/2017 07:00 MBA Mortgage Applications 14-Jul -- -- -7.40% 07/19/2017 08:30 Housing Starts Jun 1160k -- 1092k 07/19/2017 08:30 Housing Starts MoM Jun 6.20% -- -5.50% 07/19/2017 08:30 Building Permits Jun 1201k -- 1168k 07/19/2017 08:30 Building Permits MoM Jun 2.80% -- -4.90% 07/20/2017 08:30 Initial Jobless Claims 15-Jul 245k -- 247k 07/20/2017 08:30 Continuing Claims 8-Jul 1950k -- 1945k 07/20/2017 08:30 Philadelphia Fed Business Outlook Jul 23.7 -- 27.6 07/20/2017 09:45 Bloomberg Consumer Comfort 16-Jul -- -- 47 07/20/2017 09:45 Bloomberg Economic Expectations Jul -- -- 52 07/20/2017 10:00 Leading Index Jun 0.40% -- 0.30% S&P 500 Daily Performance 1950 2050 2150 2250 2350 2450 Jul-16 Sep-16 Nov-16 Jan-17 Mar-17 May-17 Jul-17 Leaders - Prior Session Company Ticker % Change Freeport-McMoRan Inc FCX-US 3.17 Macy's Inc M-US 3.09 Kohl's Corp KSS-US 2.73 Exelon Corp EXC-US 2.69 Royal Caribbean Cruises Ltd RCL-US 2.39 Laggards - Prior Session Company Ticker % Change Crown Castle International CorpCCI-US -4.24 BlackRock Inc BLK-US -3.13 Ulta Beauty Inc ULTA-US -2.98 Medtronic PLC MDT-US -2.83 Incyte Corp INCY-US -2.72 U.S. Equity Upgrades Chipotle raised to Buy at Maxim Netflix raised to Buy at Rosenblatt U.S. Equity Downgrades Cabot Oil cut to Hold at Williams Capital Under Armour cut to Negative at OTR Global Today's Earnings – U.S. Comerica Inc $1.08, Progressive Corp/The $0.59, TD Ameritrade Holding Corp $0.42, Prologis Inc $0.78, Medidata Solutions Inc $0.28, UnitedHealth Group Inc $2.38, Johnson & Johnson $1.79, Bank of America Corp $0.43, Harley-Davidson Inc $1.38, Lockheed Martin Corp $3.11, Goldman Sachs Group Inc/The $3.43, Charles Schwab Corp/The $0.39, International Business Machines Corp $2.74, CSX Corp $0.59, United Continental Holdings Inc $2.72
- 4. Before the Open July 18, 2017 Page 4 Appendix A - Important Information General Research Disclaimer The statements and statistics contained herein are based on material believed to be reliable, but are not guaranteed to be accurate or complete. This report is for informational purposes only and is not an offer or solicitation with respect to the purchase or sale of any investment fund, security or other product. Particular investment, trading, or tax strategies should be evaluated relative to each individual’s objectives. Graphs and charts are used for illustrative purposes only and do not reflect future values or future performance. This document does not provide individual financial, legal, investment or tax advice. Please consult your own legal, investment and tax advisor. All opinions and other information in this document are subject to change without notice. The Toronto-Dominion Bank and its affiliates and related entities are not liable for any errors or omissions in the information or for any loss or damage suffered. TD Waterhouse Canada Inc. and/or its affiliated persons or companies may hold a position in the securities mentioned, including options, futures and other derivative instruments thereon, and may, as principal or agent, buy or sell such securities. Affiliated persons or companies may also make a market in and participate in an underwriting of such securities. Full disclosures for all companies covered by TD Securities Inc. can be viewed at https://www.tdsresearch.com/equities/welcome.important.disclosure.action Research Ratings Action List BUY: The stock’s total return is expected to exceed a minimum of 15%, on a risk-adjusted basis, over the next 12 months and it is a top pick in the Analyst’s sector. BUY: The stock’s total return is expected to exceed a minimum of 15%, on a risk-adjusted basis, over the next 12 months. SPECULATIVE BUY: The stock’s total return is expected to exceed 30% over the next 12 months; however, there is material event risk associated with the investment that could result in significant loss. HOLD: The stock’s total return is expected to be between 0% and 15%, on a risk-adjusted basis, over the next 12 months. TENDER: Investors are advised to tender their shares to a specific offer for the company’s securities. REDUCE: The stock’s total return is expected to be negative over the next 12 months. Technical Research Disclaimer The opinions expressed herein reflect a technical perspective and may differ from fundamental research on these issuers. Fundamental research can be obtained through your TD Wealth advisor or on the Markets and Research site within WebBroker. The technical research opinions contained in this report are based on historical technical data and expectations of the most likely direction of a market or security. No guarantee of that outcome is ever implied. Research Report Dissemination Policy TD Waterhouse Canada Inc. makes its research products available in electronic format. These research products are posted to our proprietary websites for all eligible clients to access by password and we distribute the information to our sales personnel who then may distribute it to their retail clients under the appropriate circumstances either by email, fax or regular mail. No recipient may pass on to any other person, or reproduce by any means, the information contained in this report without our prior written consent. Analyst Certification The Portfolio Advice and Investment Research analyst(s) responsible for this report hereby certify that (i) the recommendations and technical opinions expressed in the research report accurately reflect the personal views of the analyst(s) about any and all of the securities or issuers discussed herein, and (ii) no part of the research analyst’s compensation was, is, or will be, directly or indirectly, related to the provision of specific recommendations or views expressed by the research analyst in the research report. Conflicts of Interest The Portfolio Advice & Investment Research analyst(s) responsible for this report may own securities of the issuer(s) discussed in this report. As with most other employees, the analyst(s) who prepared this report are compensated based upon (among other factors) the overall profitability of TD Waterhouse Canada Inc. and its affiliates, which includes the overall profitability of investment banking services, however TD Waterhouse Canada Inc. does not compensate its analysts based on specific investment banking transactions.
- 5. Before the Open July 18, 2017 Page 5 Corporate Disclosure TD Wealth represents the products and services offered by TD Waterhouse Canada Inc. (Member – Canadian Investor Protection Fund), TD Waterhouse Private Investment Counsel Inc., TD Wealth Private Banking (offered by The Toronto-Dominion Bank) and TD Wealth Private Trust (offered by The Canada Trust Company). The Portfolio Advice and Investment Research team is part of TD Waterhouse Canada Inc., a subsidiary of The Toronto-Dominion Bank. Trade-mark Disclosures Bloomberg and Bloomberg.com are trademarks and service marks of Bloomberg Finance L.P., a Delaware limited partnership, or its subsidiaries. All rights reserved. “TD Securities” is the trade name which TD Securities Inc. and TD Securities (USA) LLC. jointly use to market their institutional equity services. TD Securities is a trade-mark of The Toronto-Dominion Bank representing TD Securities Inc., TD Securities (USA) LLC, TD Securities Limited and certain corporate and investment banking activities of The Toronto-Dominion Bank. All trademarks are the property of their respective owners. ® The TD logo and other trade-marks are the property of The Toronto-Dominion Bank. FTSE TMX Global Debt Capital Markets Inc. 2016 "FTSE®" is a trade mark of FTSE International Ltd and is used under licence. "TMX” is a trade mark of TSX Inc. and is used under licence. All rights in the FTSE TMX Global Debt Capital Markets Inc.'s indices and / or FTSE TMX Global Debt Capital Markets Inc.'s ratings vest in FTSE TMX Global Debt Capital Markets Inc. and/or its licensors. Neither FTSE TMX Global Debt Capital Markets Inc. nor its licensors accept any liability for any errors or omissions in such indices and / or ratings or underlying data. No further distribution of FTSE TMX Global Debt Capital Markets Inc.'s data is permitted without FTSE TMX Global Debt Capital Markets Inc.'s express written consent.