Before the open February 24 2017
•
1 like•170 views

Before the market open on February 24, 2017

Recommended
More Related Content
What's hot
What's hot (20)
Viewers also liked
Viewers also liked (12)
Similar to Before the open February 24 2017
Similar to Before the open February 24 2017 (16)
More from John Pendrith
More from John Pendrith (20)
Recently uploaded
Recently uploaded (20)
Before the open February 24 2017
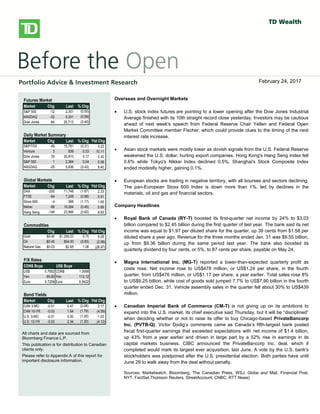
- 1. bbbsb Overseas/Overnight Markets U.S. stock index futures fell, taking a cue from European and Asian markets, as worries over global growth prospects and the outcome of Greece’s private-sector bond swap later this week weigh on sentiment. There is no U.S. economic data on the docket today. European stocks dropped, with banks and resource stocks among the `largest detractors. A report released this morning showed a 0.3% Q/Q contraction in the euro-area economy in Q4, confirming an initial estimate published on February 15. Large declines in investment, exports and consumer spending were to blame for the overall GDP contraction. Also weighing on investors was a memo from the Institute of International Finance that warned that a disorderly default would cause the euro zone more than 1 trillion euros ($1.36 trillion) in damage, Reuters reported. The report also stated that a default would likely force Italy and Spain to seek aid to prevent being engulfed in the region’s debt crisis. Private investors that have declared their participation in Greece’s debt restructuring hold about 20% of the bonds involved in a swap, the creditors’ stering committee said yesterday. The goal of the swap, which runs through March 8, is to reduce the amount of privately-held Greek debt by 53.5% and help secure Greece’s second rescue package. Asian stocks fell sharply, with miners among the top declines, following global markets lower on growth concerns. The Hang Seng shed 2.2%, while the Shanghai Composite fell 1.4%. Japan’s Nikkei gave up a more modest 0.6%. North American Market Highlights & Headlines Aecon Group Inc. (ARE-T) reported a 143% increase in quarterly earnings on Monday as margins improved on lower costs. Aecon reported EPS of $0.49, up from $0.20 a year ago. Revenue in the quarter was $790 million, down from $841 million, and well shy of the $859 million consensus estimate. Aecon's backlog stood at $2.39 billion at December 31, 2011. Futures Market Market Chg Last % Chg S&P 500 -12 2,351 (0.50) NASDAQ -32 5,301 (0.59) Dow Jones -84 20,713 (0.40) Daily Market Summary Market Chg Last % Chg Ytd Chg S&P/TSX -49 15,781 (0.31) 3.23 Venture 3 839 0.33 10.11 Dow Jones 35 20,810 0.17 5.30 S&P 500 1 2,364 0.04 5.58 NASDAQ -25 5,836 (0.43) 8.40 Global Markets Market Chg Last % Chg Ytd Chg DAX -200 11,748 (1.67) 2.33 FTSE -64 7,208 (0.88) 0.91 Stoxx 600 -4 368 (1.17) 1.95 Nikkei -88 19,284 (0.45) 0.89 Hang Seng -149 23,966 (0.62) 8.93 Commodities Chg Last % Chg Ytd Chg Gold $9.45 $1,259.23 0.75 9.28 Oil -$0.45 $54.00 (0.83) (2.58) Natural Gas $0.03 $2.65 1.06 (28.97) F/X Rates CDN$ Buys US$ Buys US$ 0.7652 CDN$ 1.3068 Yen 85.80 Yen 112.12 Euro 0.7209 Euro 0.9422 Bond Yields Market Chg Last % Chg Ytd Chg CAN 3-MO -0.01 0.47 (2.08) 2.17 CAN 10-YR -0.03 1.64 (1.79) (4.59) U.S. 3-MO -0.01 0.50 (1.00) 1.03 U.S. 10-YR -0.03 2.34 (1.20) (4.12) All charts and data are sourced from Bloomberg Finance L.P. This publication is for distribution to Canadian clients only. Please refer to Appendix A of this report for important disclosure information. Overseas and Overnight Markets U.S. stock index futures are pointing to a lower opening after the Dow Jones Industrial Average finished with its 10th straight record close yesterday. Investors may be cautious ahead of next week's speech from Federal Reserve Chair Yellen and Federal Open Market Committee member Fischer, which could provide clues to the timing of the next interest rate increase. Asian stock markets were mostly lower as dovish signals from the U.S. Federal Reserve weakened the U.S. dollar, hurting export companies. Hong Kong's Hang Seng Index fell 0.6% while Tokyo's Nikkei Index declined 0.5%. Shanghai's Stock Composite Index ended modestly higher, gaining 0.1%. European stocks are trading in negative territory, with all bourses and sectors declining. The pan-European Stoxx 600 Index is down more than 1%, led by declines in the materials, oil and gas and financial sectors. Company Headlines Royal Bank of Canada (RY-T) boosted its first-quarter net income by 24% to $3.03 billion compared to $2.45 billion during the first quarter of last year. The bank said its net income was equal to $1.97 per diluted share for the quarter, up 39 cents from $1.58 per diluted share a year ago. Revenue for the three months ended Jan. 31 was $9.55 billion, up from $9.36 billion during the same period last year. The bank also boosted its quarterly dividend by four cents, or 5%, to 87 cents per share, payable on May 24. Magna International Inc. (MG-T) reported a lower-than-expected quarterly profit as costs rose. Net income rose to US$478 million, or US$1.24 per share, in the fourth quarter, from US$476 million, or US$1.17 per share, a year earlier. Total sales rose 8% to US$9.25 billion, while cost of goods sold jumped 7.7% to US$7.90 billion in the fourth quarter ended Dec. 31. Vehicle assembly sales in the quarter fell about 30% to US$439 million. Canadian Imperial Bank of Commerce (CM-T) is not giving up on its ambitions to expand into the U.S. market, its chief executive said Thursday, but it will be “disciplined” when deciding whether or not to raise its offer to buy Chicago-based PrivateBancorp Inc. (PVTB-Q). Victor Dodig’s comments came as Canada’s fifth-largest bank posted fiscal first-quarter earnings that exceeded expectations with net income of $1.4 billion, up 43% from a year earlier and driven in large part by a 52% rise in earnings in its capital markets business. CIBC announced the PrivateBancorp Inc. deal, which if completed would mark its largest ever acquisition, last June. A vote by the U.S. bank's stockholders was postponed after the U.S. presidential election. Both parties have until June 29 to walk away from the deal without penalty. Sources: Marketwatch, Bloomberg, The Canadian Press, WSJ, Globe and Mail, Financial Post, NYT, FactSet,Thomson Reuters, StreetAccount, CNBC, RTT News) February 24, 2017
- 2. Before the Open February 24, 2017 Page 2 Canadian Equities Upgrades - March 6 Weekly Canada Economic Calendar - February 20 to February 24, 2017 Date/Time Event Period Consensus Actual Prior 02/22/2017 08:30 Retail Sales Ex Auto MoM Dec 0.50% -0.30% -0.10% 02/22/2017 08:30 Retail Sales MoM Dec 0.00% -0.50% 0.30% 02/23/2017 CFIB Business Barometer Feb -- 62.9 60.1 02/24/2017 08:30 CPI NSA MoM Jan 0.40% 0.90% -0.20% 02/24/2017 08:30 CPI YoY Jan 1.60% 2.10% 1.50% 02/24/2017 08:30 CPI Core- Common YoY% Jan -- 1.30% 1.40% 02/24/2017 08:30 CPI Core- Median YoY% Jan -- 1.90% 1.90% 02/24/2017 08:30 CPI Core- Trim YoY% Jan -- 1.70% 1.60% 02/24/2017 08:30 Consumer Price Index Jan 128.8 129.5 128.4 S&P/TSX Daily Performance 12000 12500 13000 13500 14000 14500 15000 15500 16000 Feb-16 Apr-16 Jun-16 Aug-16 Oct-16 Dec-16 Feb-17 Leaders - Prior Session Company Ticker % Change CCL Industries Inc CCL/B-T 6.65 Surge Energy Inc SGY-T 5.99 Maple Leaf Foods Inc MFI-T 5.21 Exchange Income Corp EIF-T 3.81 DHX Media Ltd DHX/B-T 3.75 Laggards - Prior Session Company Ticker % Change First Quantum Minerals Ltd FM-T -6.50 Hudbay Minerals Inc HBM-T -6.36 Ivanhoe Mines Ltd IVN-T -5.45 Mitel Networks Corp MNW-T -4.73 Turquoise Hill Resources Ltd TRQ-T -4.47 Canadian Equity Upgrades Methanex raised to Outperform at Raymond James Tree Island Steel raised to Buy at Cormark Securities Canadian Equity Downgrades Torex Gold Resources Cut to Hold at TD Securities Altus Group cut to Underperform at CIBC Today's Earnings – Canada Magna International $1.35, Enerplus Corp $0.05, Plaza Retail REIT $0.09, Husky Energy -$0.01, Colabor Group $0.04, Royal Bank of Canada $1.76, Guardian Capital Group $0.32, Novelion Therapeutics -$0.85, Lundin Gold -$0.14
- 3. Before the Open February 24, 2017 Page 3 Weekly U.S. Economic Calendar - February 20 to February 24, 2017 Date/Time Event Period Consensus Actual Prior 02/21/2017 09:45 Markit US Manufacturing PMI Feb P 55.4 54.3 55 02/21/2017 09:45 Markit US Services PMI Feb P 55.8 53.9 55.6 02/21/2017 09:45 Markit US Composite PMI Feb P -- 54.3 55.8 02/22/2017 07:00 MBA Mortgage Applications 17-Feb -- -2.00% -3.70% 02/22/2017 10:00 Revisions: Existing Home Sales 02/22/2017 10:00 Existing Home Sales Jan 5.54m 5.69m 5.51m 02/22/2017 10:00 Existing Home Sales MoM Jan 0.90% 3.30% -1.60% 02/22/2017 14:00 FOMC Meeting Minutes 1-Feb -- -- -- 02/23/2017 08:30 Chicago Fed Nat Activity Index Jan -0.03 -0.05 0.18 02/23/2017 08:30 Initial Jobless Claims 18-Feb 240k 244k 238k 02/23/2017 08:30 Continuing Claims 11-Feb 2065k 2060k 2077k 02/23/2017 09:00 House Price Purchase Index QoQ 4Q -- 1.50% 1.50% 02/23/2017 09:00 FHFA House Price Index MoM Dec 0.50% 0.40% 0.70% 02/23/2017 09:45 Bloomberg Consumer Comfort 19-Feb -- 48 48.1 02/23/2017 11:00 Kansas City Fed Manf. Activity Feb 9 14 9 02/24/2017 10:00 New Home Sales Jan 571k -- 536k 02/24/2017 10:00 New Home Sales MoM Jan 6.50% -- -10.40% 02/24/2017 10:00 U. of Mich. Sentiment Feb F 96 -- 95.7 02/24/2017 10:00 U. of Mich. Current Conditions Feb F -- -- 111.2 02/24/2017 10:00 U. of Mich. Expectations Feb F -- -- 85.7 02/24/2017 10:00 U. of Mich. 1 Yr Inflation Feb F -- -- 2.80% 02/24/2017 10:00 U. of Mich. 5-10 Yr Inflation Feb F -- -- 2.50% S&P 500 Daily Performance 1700 1800 1900 2000 2100 2200 2300 2400 Feb-16 Apr-16 Jun-16 Aug-16 Oct-16 Dec-16 Feb-17 Leaders - Prior Session Company Ticker % Change First Solar Inc FSLR-US 10.78 HP Inc HPQ-US 8.64 Transocean Ltd RIG-US 7.76 Endo International PLC ENDP-US 3.88 Edwards Lifesciences Corp EW-US 3.78 Laggards - Prior Session Company Ticker % Change L Brands Inc LB UN -15.81 NVIDIA Corp NVDA UW -9.27 United Rentals Inc URI UN -5.59 Hormel Foods Corp HRL UN -5.39 Urban Outfitters Inc URBN UW -5.16 U.S. Equity Upgrades Intuit raised to Outperform at Credit Suisse Chesapeake Energy raised to Neutral at UBS U.S. Equity Downgrades Kforce cut to Neutral at Credit Suisse Goldman Sachs cut to Sell at Berenberg Today's Earnings – U.S. Cabot Oil & Gas $0.01, Comstock Resources -$1.68, Foot Locker $1.32, JC Penney Co $0.61, Global Blood Therapeutics -$0.64
- 4. Before the Open February 24, 2017 Page 4 Appendix A - Important Information General Research Disclaimer The statements and statistics contained herein are based on material believed to be reliable, but are not guaranteed to be accurate or complete. This report is for informational purposes only and is not an offer or solicitation with respect to the purchase or sale of any investment fund, security or other product. Particular investment, trading, or tax strategies should be evaluated relative to each individual’s objectives. Graphs and charts are used for illustrative purposes only and do not reflect future values or future performance. This document does not provide individual financial, legal, investment or tax advice. Please consult your own legal, investment and tax advisor. All opinions and other information in this document are subject to change without notice. The Toronto-Dominion Bank and its affiliates and related entities are not liable for any errors or omissions in the information or for any loss or damage suffered. TD Waterhouse Canada Inc. and/or its affiliated persons or companies may hold a position in the securities mentioned, including options, futures and other derivative instruments thereon, and may, as principal or agent, buy or sell such securities. Affiliated persons or companies may also make a market in and participate in an underwriting of such securities. Full disclosures for all companies covered by TD Securities Inc. can be viewed at https://www.tdsresearch.com/equities/welcome.important.disclosure.action Research Ratings Action List BUY: The stock’s total return is expected to exceed a minimum of 15%, on a risk-adjusted basis, over the next 12 months and it is a top pick in the Analyst’s sector. BUY: The stock’s total return is expected to exceed a minimum of 15%, on a risk-adjusted basis, over the next 12 months. SPECULATIVE BUY: The stock’s total return is expected to exceed 30% over the next 12 months; however, there is material event risk associated with the investment that could result in significant loss. HOLD: The stock’s total return is expected to be between 0% and 15%, on a risk-adjusted basis, over the next 12 months. TENDER: Investors are advised to tender their shares to a specific offer for the company’s securities. REDUCE: The stock’s total return is expected to be negative over the next 12 months. Technical Research Disclaimer The opinions expressed herein reflect a technical perspective and may differ from fundamental research on these issuers. Fundamental research can be obtained through your TD Wealth advisor or on the Markets and Research site within WebBroker. The technical research opinions contained in this report are based on historical technical data and expectations of the most likely direction of a market or security. No guarantee of that outcome is ever implied. Research Report Dissemination Policy TD Waterhouse Canada Inc. makes its research products available in electronic format. These research products are posted to our proprietary websites for all eligible clients to access by password and we distribute the information to our sales personnel who then may distribute it to their retail clients under the appropriate circumstances either by email, fax or regular mail. No recipient may pass on to any other person, or reproduce by any means, the information contained in this report without our prior written consent. Analyst Certification The Portfolio Advice and Investment Research analyst(s) responsible for this report hereby certify that (i) the recommendations and technical opinions expressed in the research report accurately reflect the personal views of the analyst(s) about any and all of the securities or issuers discussed herein, and (ii) no part of the research analyst’s compensation was, is, or will be, directly or indirectly, related to the provision of specific recommendations or views expressed by the research analyst in the research report. Conflicts of Interest The Portfolio Advice & Investment Research analyst(s) responsible for this report may own securities of the issuer(s) discussed in this report. As with most other employees, the analyst(s) who prepared this report are compensated based upon (among other factors) the overall profitability of TD Waterhouse Canada Inc. and its affiliates, which includes the overall profitability of investment banking services, however TD Waterhouse Canada Inc. does not compensate its analysts based on specific investment banking transactions.
- 5. Before the Open February 24, 2017 Page 5 Corporate Disclosure TD Wealth represents the products and services offered by TD Waterhouse Canada Inc. (Member – Canadian Investor Protection Fund), TD Waterhouse Private Investment Counsel Inc., TD Wealth Private Banking (offered by The Toronto-Dominion Bank) and TD Wealth Private Trust (offered by The Canada Trust Company). The Portfolio Advice and Investment Research team is part of TD Waterhouse Canada Inc., a subsidiary of The Toronto-Dominion Bank. Trade-mark Disclosures Bloomberg and Bloomberg.com are trademarks and service marks of Bloomberg Finance L.P., a Delaware limited partnership, or its subsidiaries. All rights reserved. “TD Securities” is the trade name which TD Securities Inc. and TD Securities (USA) LLC. jointly use to market their institutional equity services. TD Securities is a trade-mark of The Toronto-Dominion Bank representing TD Securities Inc., TD Securities (USA) LLC, TD Securities Limited and certain corporate and investment banking activities of The Toronto-Dominion Bank. All trademarks are the property of their respective owners. ® The TD logo and other trade-marks are the property of The Toronto-Dominion Bank. FTSE TMX Global Debt Capital Markets Inc. 2016 "FTSE®" is a trade mark of FTSE International Ltd and is used under licence. "TMX” is a trade mark of TSX Inc. and is used under licence. All rights in the FTSE TMX Global Debt Capital Markets Inc.'s indices and / or FTSE TMX Global Debt Capital Markets Inc.'s ratings vest in FTSE TMX Global Debt Capital Markets Inc. and/or its licensors. Neither FTSE TMX Global Debt Capital Markets Inc. nor its licensors accept any liability for any errors or omissions in such indices and / or ratings or underlying data. No further distribution of FTSE TMX Global Debt Capital Markets Inc.'s data is permitted without FTSE TMX Global Debt Capital Markets Inc.'s express written consent.