

Recommended
More Related Content
What's hot
What's hot (20)
Viewers also liked
Viewers also liked (13)
Similar to Before the open March 7 2017
Similar to Before the open March 7 2017 (19)
More from John Pendrith
More from John Pendrith (20)
Recently uploaded
Recently uploaded (20)
Before the open March 7 2017
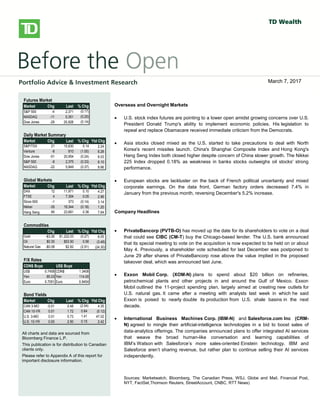
- 1. bbbsb Overseas/Overnight Markets U.S. stock index futures fell, taking a cue from European and Asian markets, as worries over global growth prospects and the outcome of Greece’s private-sector bond swap later this week weigh on sentiment. There is no U.S. economic data on the docket today. European stocks dropped, with banks and resource stocks among the `largest detractors. A report released this morning showed a 0.3% Q/Q contraction in the euro-area economy in Q4, confirming an initial estimate published on February 15. Large declines in investment, exports and consumer spending were to blame for the overall GDP contraction. Also weighing on investors was a memo from the Institute of International Finance that warned that a disorderly default would cause the euro zone more than 1 trillion euros ($1.36 trillion) in damage, Reuters reported. The report also stated that a default would likely force Italy and Spain to seek aid to prevent being engulfed in the region’s debt crisis. Private investors that have declared their participation in Greece’s debt restructuring hold about 20% of the bonds involved in a swap, the creditors’ stering committee said yesterday. The goal of the swap, which runs through March 8, is to reduce the amount of privately-held Greek debt by 53.5% and help secure Greece’s second rescue package. Asian stocks fell sharply, with miners among the top declines, following global markets lower on growth concerns. The Hang Seng shed 2.2%, while the Shanghai Composite fell 1.4%. Japan’s Nikkei gave up a more modest 0.6%. North American Market Highlights & Headlines Aecon Group Inc. (ARE-T) reported a 143% increase in quarterly earnings on Monday as margins improved on lower costs. Aecon reported EPS of $0.49, up from $0.20 a year ago. Revenue in the quarter was $790 million, down from $841 million, and well shy of the $859 million consensus estimate. Aecon's backlog stood at $2.39 billion at December 31, 2011. Futures Market Market Chg Last % Chg S&P 500 -4 2,371 (0.17) NASDAQ -11 5,351 (0.20) Dow Jones -29 20,928 (0.14) Daily Market Summary Market Chg Last % Chg Ytd Chg S&P/TSX 21 15,630 0.14 2.24 Venture -8 810 (1.00) 6.28 Dow Jones -51 20,954 (0.24) 6.03 S&P 500 -8 2,375 (0.33) 6.10 NASDAQ -22 5,849 (0.37) 8.66 Global Markets Market Chg Last % Chg Ytd Chg DAX 12 11,971 0.10 4.27 FTSE 4 7,354 0.05 2.96 Stoxx 600 -1 373 (0.14) 3.14 Nikkei -35 19,344 (0.18) 1.20 Hang Seng 85 23,681 0.36 7.64 Commodities Chg Last % Chg Ytd Chg Gold -$3.26 $1,222.03 (0.27) 6.05 Oil $0.30 $53.50 0.56 (3.48) Natural Gas -$0.08 $2.82 (2.91) (24.30) F/X Rates CDN$ Buys US$ Buys US$ 0.7458 CDN$ 1.3408 Yen 85.03 Yen 114.00 Euro 0.7051 Euro 0.9454 Bond Yields Market Chg Last % Chg Ytd Chg CAN 3-MO -0.01 0.48 (2.04) 4.35 CAN 10-YR 0.01 1.72 0.64 (0.12) U.S. 3-MO 0.01 0.73 1.41 47.02 U.S. 10-YR 0.00 2.50 0.15 2.42 All charts and data are sourced from Bloomberg Finance L.P. This publication is for distribution to Canadian clients only. Please refer to Appendix A of this report for important disclosure information. Overseas and Overnight Markets U.S. stock index futures are pointing to a lower open amidst growing concerns over U.S. President Donald Trump's ability to implement economic policies. His legislation to repeal and replace Obamacare received immediate criticism from the Democrats. Asia stocks closed mixed as the U.S. started to take precautions to deal with North Korea's recent missiles launch. China's Shanghai Composite Index and Hong Kong's Hang Seng Index both closed higher despite concern of China slower growth. The Nikkei 225 Index dropped 0.18% as weakness in banks stocks outweighs oil stocks' strong performance. European stocks are lackluster on the back of French political uncertainty and mixed corporate earnings. On the data front, German factory orders decreased 7.4% in January from the previous month, reversing December's 5.2% increase. Company Headlines PrivateBancorp (PVTB-O) has moved up the date for its shareholders to vote on a deal that could see CIBC (CM-T) buy the Chicago-based lender. The U.S. bank announced that its special meeting to vote on the acquisition is now expected to be held on or about May 4. Previously, a shareholder vote scheduled for last December was postponed to June 29 after shares of PrivateBancorp rose above the value implied in the proposed takeover deal, which was announced last June. Exxon Mobil Corp. (XOM-N) plans to spend about $20 billion on refineries, petrochemical plants and other projects in and around the Gulf of Mexico. Exxon Mobil outlined the 11-project spending plan, largely aimed at creating new outlets for U.S. natural gas. It came after a meeting with analysts last week in which he said Exxon is poised to nearly double its production from U.S. shale basins in the next decade. International Business Machines Corp. (IBM-N) and Salesforce.com Inc (CRM- N) agreed to mingle their artificial-intelligence technologies in a bid to boost sales of data-analytics offerings. The companies announced plans to offer integrated AI services that weave the broad human-like conversation and learning capabilities of IBM’s Watson with Salesforce’s more sales-oriented Einstein technology. IBM and Salesforce aren’t sharing revenue, but rather plan to continue selling their AI services independently. Sources: Marketwatch, Bloomberg, The Canadian Press, WSJ, Globe and Mail, Financial Post, NYT, FactSet,Thomson Reuters, StreetAccount, CNBC, RTT News) March 7, 2017
- 2. Before the Open March 7, 2017 Page 2 Canadian Equities Upgrades - March 6 Weekly Canada Economic Calendar - March 06 to March 10, 2017 Date/Time Event Period Consensus Actual Prior 03/06/2017 10:00 Bloomberg Nanos Confidence 3-Mar -- 57.4 58.1 03/07/2017 08:30 Int'l Merchandise Trade Jan 0.75b 0.81b 0.45b 03/07/2017 10:00 Ivey Purchasing Managers Index SA Feb 58.5 -- 57.2 03/08/2017 08:15 Housing Starts Feb 200.0k -- 207.4k 03/08/2017 08:30 Labor Productivity QoQ 4Q 0.40% -- 1.20% 03/08/2017 08:30 Building Permits MoM Jan 3.00% -- -6.60% 03/09/2017 08:30 Capacity Utilization Rate 4Q 82.50% -- 81.90% 03/09/2017 08:30 New Housing Price Index MoM Jan 0.10% -- 0.10% 03/09/2017 08:30 New Housing Price Index YoY Jan -- -- 3.00% 03/10/2017 08:30 Unemployment Rate Feb 6.80% -- 6.80% 03/10/2017 08:30 Net Change in Employment Feb -5.0k -- 48.3k 03/10/2017 08:30 Full Time Employment Change Feb -- -- 15.8 03/10/2017 08:30 Part Time Employment Change Feb -- -- 32.4 03/10/2017 08:30 Participation Rate Feb -- -- 65.9 S&P/TSX Daily Performance 12000 12500 13000 13500 14000 14500 15000 15500 16000 Mar-16 May-16 Jul-16 Aug-16 Oct-16 Dec-16 Feb-17 Leaders - Prior Session Company Ticker % Change Kelt Exploration Ltd KEL-T 5.34 Northland Power Inc NPI-T 4.60 Baytex Energy Corp BTE-T 4.57 ShawCor Ltd SCL-T 4.06 Peyto Exploration & Development CorpPEY-T 3.88 Laggards - Prior Session Company Ticker % Change Pretium Resources Inc PVG-T -6.91 B2Gold Corp BTO-T -6.47 Torex Gold Resources Inc TXG-T -6.13 IAMGOLD Corp IMG-T -5.91 Endeavour Mining Corp EDV-T -5.89 Canadian Equity Upgrades Canadian Utilities Raised to Outperform at National Bank Scotiabank Raised to Outperform at CIBC Canadian Equity Downgrades Major Drilling Cut to Hold at Paradigm Capital Today's Earnings – Canada Enercare Inc $0.15, Baytex Energy Corp -$0.13, Imvescor Restaurant Group Inc $0.05, Mogo Finance Technology Inc -$0.27, EcoSynthetix Inc -$0.03, Aecon Group Inc $0.40, Great Canadian Gaming Corp $0.31, Cardiome Pharma Corp -$0.16, DH Corp $0.56, Whitecap Resources Inc $0.04, Centric Health Corp -$0.01, CanWel Building Materials Group Ltd $0.04, Trilogy Energy Corp -$0.11, Alaris Royalty Corp $0.38, Tourmaline Oil Corp $0.16, Gibson Energy Inc -$0.02, American Hotel Income Properties REIT LP $0.11, ECN Capital Corp $0.07, Cargojet Inc $0.75, Chinook Energy Inc -$0.03, Raging River Exploration Inc $0.05, Agellan Commercial Real Estate Investment Trust $0.29
- 3. Before the Open March 7, 2017 Page 3 Weekly U.S. Economic Calendar - March 06 to March 10, 2017 Date/Time Event Period Consensus Actual Prior 03/06/2017 10:00 Factory Orders Jan 1.00% 1.20% 1.30% 03/06/2017 10:00 Factory Orders Ex Trans Jan -- 0.30% 2.40% 03/06/2017 10:00 Durable Goods Orders Jan F 1.00% 2.00% 1.80% 03/06/2017 10:00 Durables Ex Transportation Jan F 0.10% 0.00% -0.20% 03/06/2017 10:00 Cap Goods Orders Nondef Ex Air Jan F -- -0.10% -0.40% 03/06/2017 10:00 Cap Goods Ship Nondef Ex Air Jan F -- -0.40% -0.60% 03/07/2017 08:30 Trade Balance Jan -$48.5b -$48.5b -$44.3b 03/07/2017 15:00 Consumer Credit Jan $17.250b -- $14.160b 03/08/2017 07:00 MBA Mortgage Applications 3-Mar -- -- 5.80% 03/08/2017 08:15 ADP Employment Change Feb 189k -- 246k 03/08/2017 08:30 Nonfarm Productivity 4Q F 1.50% -- 1.30% 03/08/2017 08:30 Unit Labor Costs 4Q F 1.60% -- 1.70% 03/08/2017 08:30 Revisions: Productivity and Costs 03/08/2017 10:00 Wholesale Inventories MoM Jan F -0.10% -- -0.10% 03/08/2017 10:00 Wholesale Trade Sales MoM Jan 0.50% -- 2.60% 03/09/2017 07:30 Challenger Job Cuts YoY Feb -- -- -38.80% 03/09/2017 08:30 Import Price Index MoM Feb 0.10% -- 0.40% 03/09/2017 08:30 Import Price Index ex Petroleum MoM Feb 0.10% -- 0.00% 03/09/2017 08:30 Import Price Index YoY Feb 4.40% -- 3.70% 03/09/2017 08:30 Initial Jobless Claims 4-Mar 238k -- 223k 03/09/2017 08:30 Continuing Claims 25-Feb 2062k -- 2066k 03/09/2017 09:45 Bloomberg Consumer Comfort 5-Mar -- -- 49.8 03/09/2017 12:00 Household Change in Net Worth 4Q -- -- $1593b 03/10/2017 08:30 Change in Nonfarm Payrolls Feb 190k -- 227k 03/10/2017 08:30 Two-Month Payroll Net Revision Feb -- -- -- 03/10/2017 08:30 Change in Private Payrolls Feb 190k -- 237k 03/10/2017 08:30 Change in Manufact. Payrolls Feb 9k -- 5k 03/10/2017 08:30 Unemployment Rate Feb 4.70% -- 4.80% 03/10/2017 08:30 Average Hourly Earnings MoM Feb 0.30% -- 0.10% 03/10/2017 08:30 Average Hourly Earnings YoY Feb 2.80% -- 2.50% 03/10/2017 08:30 Average Weekly Hours All Employees Feb 34.4 -- 34.4 03/10/2017 08:30 Labor Force Participation Rate Feb -- -- 62.90% 03/10/2017 08:30 Underemployment Rate Feb -- -- 9.40% 03/10/2017 14:00 Monthly Budget Statement Feb -$170.0b -- $51.3b S&P 500 Daily Performance 1700 1800 1900 2000 2100 2200 2300 2400 2500 Mar-16 May-16 Jul-16 Aug-16 Oct-16 Dec-16 Feb-17 Leaders - Prior Session Company Ticker % Change Range Resources Corp RRC-US 4.13 Cabot Oil & Gas Corp COG-US 3.53 Southwestern Energy Co SWN-US 2.98 Netflix Inc NFLX-US 2.01 Marathon Oil Corp MRO-US 1.79 Laggards - Prior Session Company Ticker % Change Kohl's Corp KSS UN -4.69 CSRA Inc CSRA UN -4.28 Frontier Communications Corp FTR UW -3.83 First Solar Inc FSLR UW -3.70 Transocean Ltd RIG UN -3.55 U.S. Equity Upgrades Stericycle Upgraded to Neutral at Goldman Steven Madden Added to Value Creator SMID Focus List at Citi U.S. Equity Downgrades Novartis Cut to Underperform at BNP Paribas Today's Earnings – U.S. Navistar International Corp -$0.47, Dick's Sporting Goods Inc $1.30, Lumos Networks Corp $0.05, Urban Outfitters Inc $0.56, H&R Block Inc -$0.53
- 4. Before the Open March 7, 2017 Page 4 Appendix A - Important Information General Research Disclaimer The statements and statistics contained herein are based on material believed to be reliable, but are not guaranteed to be accurate or complete. This report is for informational purposes only and is not an offer or solicitation with respect to the purchase or sale of any investment fund, security or other product. Particular investment, trading, or tax strategies should be evaluated relative to each individual’s objectives. Graphs and charts are used for illustrative purposes only and do not reflect future values or future performance. This document does not provide individual financial, legal, investment or tax advice. Please consult your own legal, investment and tax advisor. All opinions and other information in this document are subject to change without notice. The Toronto-Dominion Bank and its affiliates and related entities are not liable for any errors or omissions in the information or for any loss or damage suffered. TD Waterhouse Canada Inc. and/or its affiliated persons or companies may hold a position in the securities mentioned, including options, futures and other derivative instruments thereon, and may, as principal or agent, buy or sell such securities. Affiliated persons or companies may also make a market in and participate in an underwriting of such securities. Full disclosures for all companies covered by TD Securities Inc. can be viewed at https://www.tdsresearch.com/equities/welcome.important.disclosure.action Research Ratings Action List BUY: The stock’s total return is expected to exceed a minimum of 15%, on a risk-adjusted basis, over the next 12 months and it is a top pick in the Analyst’s sector. BUY: The stock’s total return is expected to exceed a minimum of 15%, on a risk-adjusted basis, over the next 12 months. SPECULATIVE BUY: The stock’s total return is expected to exceed 30% over the next 12 months; however, there is material event risk associated with the investment that could result in significant loss. HOLD: The stock’s total return is expected to be between 0% and 15%, on a risk-adjusted basis, over the next 12 months. TENDER: Investors are advised to tender their shares to a specific offer for the company’s securities. REDUCE: The stock’s total return is expected to be negative over the next 12 months. Technical Research Disclaimer The opinions expressed herein reflect a technical perspective and may differ from fundamental research on these issuers. Fundamental research can be obtained through your TD Wealth advisor or on the Markets and Research site within WebBroker. The technical research opinions contained in this report are based on historical technical data and expectations of the most likely direction of a market or security. No guarantee of that outcome is ever implied. Research Report Dissemination Policy TD Waterhouse Canada Inc. makes its research products available in electronic format. These research products are posted to our proprietary websites for all eligible clients to access by password and we distribute the information to our sales personnel who then may distribute it to their retail clients under the appropriate circumstances either by email, fax or regular mail. No recipient may pass on to any other person, or reproduce by any means, the information contained in this report without our prior written consent. Analyst Certification The Portfolio Advice and Investment Research analyst(s) responsible for this report hereby certify that (i) the recommendations and technical opinions expressed in the research report accurately reflect the personal views of the analyst(s) about any and all of the securities or issuers discussed herein, and (ii) no part of the research analyst’s compensation was, is, or will be, directly or indirectly, related to the provision of specific recommendations or views expressed by the research analyst in the research report. Conflicts of Interest The Portfolio Advice & Investment Research analyst(s) responsible for this report may own securities of the issuer(s) discussed in this report. As with most other employees, the analyst(s) who prepared this report are compensated based upon (among other factors) the overall profitability of TD Waterhouse Canada Inc. and its affiliates, which includes the overall profitability of investment banking services, however TD Waterhouse Canada Inc. does not compensate its analysts based on specific investment banking transactions.
- 5. Before the Open March 7, 2017 Page 5 Corporate Disclosure TD Wealth represents the products and services offered by TD Waterhouse Canada Inc. (Member – Canadian Investor Protection Fund), TD Waterhouse Private Investment Counsel Inc., TD Wealth Private Banking (offered by The Toronto-Dominion Bank) and TD Wealth Private Trust (offered by The Canada Trust Company). The Portfolio Advice and Investment Research team is part of TD Waterhouse Canada Inc., a subsidiary of The Toronto-Dominion Bank. Trade-mark Disclosures Bloomberg and Bloomberg.com are trademarks and service marks of Bloomberg Finance L.P., a Delaware limited partnership, or its subsidiaries. All rights reserved. “TD Securities” is the trade name which TD Securities Inc. and TD Securities (USA) LLC. jointly use to market their institutional equity services. TD Securities is a trade-mark of The Toronto-Dominion Bank representing TD Securities Inc., TD Securities (USA) LLC, TD Securities Limited and certain corporate and investment banking activities of The Toronto-Dominion Bank. All trademarks are the property of their respective owners. ® The TD logo and other trade-marks are the property of The Toronto-Dominion Bank. FTSE TMX Global Debt Capital Markets Inc. 2016 "FTSE®" is a trade mark of FTSE International Ltd and is used under licence. "TMX” is a trade mark of TSX Inc. and is used under licence. All rights in the FTSE TMX Global Debt Capital Markets Inc.'s indices and / or FTSE TMX Global Debt Capital Markets Inc.'s ratings vest in FTSE TMX Global Debt Capital Markets Inc. and/or its licensors. Neither FTSE TMX Global Debt Capital Markets Inc. nor its licensors accept any liability for any errors or omissions in such indices and / or ratings or underlying data. No further distribution of FTSE TMX Global Debt Capital Markets Inc.'s data is permitted without FTSE TMX Global Debt Capital Markets Inc.'s express written consent.