

Recommended
More Related Content
What's hot
What's hot (20)
Similar to Before the Open July 26 2017
Similar to Before the Open July 26 2017 (18)
More from John Pendrith
Recently uploaded
Recently uploaded (20)
Before the Open July 26 2017
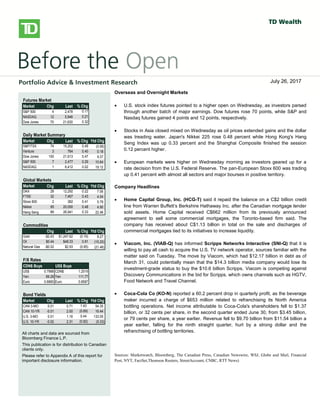
- 1. bbbsb Overseas/Overnight Markets U.S. stock index futures fell, taking a cue from European and Asian markets, as worries over global growth prospects and the outcome of Greece’s private-sector bond swap later this week weigh on sentiment. There is no U.S. economic data on the docket today. European stocks dropped, with banks and resource stocks among the `largest detractors. A report released this morning showed a 0.3% Q/Q contraction in the euro-area economy in Q4, confirming an initial estimate published on February 15. Large declines in investment, exports and consumer spending were to blame for the overall GDP contraction. Also weighing on investors was a memo from the Institute of International Finance that warned that a disorderly default would cause the euro zone more than 1 trillion euros ($1.36 trillion) in damage, Reuters reported. The report also stated that a default would likely force Italy and Spain to seek aid to prevent being engulfed in the region’s debt crisis. Private investors that have declared their participation in Greece’s debt restructuring hold about 20% of the bonds involved in a swap, the creditors’ stering committee said yesterday. The goal of the swap, which runs through March 8, is to reduce the amount of privately-held Greek debt by 53.5% and help secure Greece’s second rescue package. Asian stocks fell sharply, with miners among the top declines, following global markets lower on growth concerns. The Hang Seng shed 2.2%, while the Shanghai Composite fell 1.4%. Japan’s Nikkei gave up a more modest 0.6%. North American Market Highlights & Headlines Aecon Group Inc. (ARE-T) reported a 143% increase in quarterly earnings on Monday as margins improved on lower costs. Aecon reported EPS of $0.49, up from $0.20 a year ago. Revenue in the quarter was $790 million, down from $841 million, and well shy of the $859 million consensus estimate. Aecon's backlog stood at $2.39 billion at December 31, 2011. Futures Market Market Chg Last % Chg S&P 500 4 2,478 0.17 NASDAQ 12 5,946 0.21 Dow Jones 70 21,630 0.32 Daily Market Summary Market Chg Last % Chg Ytd Chg S&P/TSX 74 15,202 0.49 (0.56) Venture 3 764 0.40 0.18 Dow Jones 100 21,613 0.47 9.37 S&P 500 7 2,477 0.29 10.64 NASDAQ 1 6,412 0.02 19.12 Global Markets Market Chg Last % Chg Ytd Chg DAX 28 12,292 0.22 7.06 FTSE 32 7,467 0.43 4.54 Stoxx 600 2 382 0.41 5.79 Nikkei 95 20,050 0.48 4.90 Hang Seng 89 26,941 0.33 22.46 Commodities Chg Last % Chg Ytd Chg Gold -$2.43 $1,247.62 (0.19) 8.27 Oil $0.44 $48.33 0.91 (15.20) Natural Gas -$0.02 $2.93 (0.65) (21.46) F/X Rates CDN$ Buys US$ Buys US$ 0.7988 CDN$ 1.2519 Yen 89.29 Yen 111.77 Euro 0.6860 Euro 0.8587 Bond Yields Market Chg Last % Chg Ytd Chg CAN 3-MO 0.01 0.71 1.43 54.35 CAN 10-YR -0.01 2.00 (0.69) 16.44 U.S. 3-MO 0.01 1.16 0.44 133.05 U.S. 10-YR -0.02 2.31 (0.92) (5.33) All charts and data are sourced from Bloomberg Finance L.P. This publication is for distribution to Canadian clients only. Please refer to Appendix A of this report for important disclosure information. Overseas and Overnight Markets U.S. stock index futures pointed to a higher open on Wednesday, as investors parsed through another batch of major earnings. Dow futures rose 70 points, while S&P and Nasdaq futures gained 4 points and 12 points, respectively. Stocks in Asia closed mixed on Wednesday as oil prices extended gains and the dollar was treading water. Japan's Nikkei 225 rose 0.48 percent while Hong Kong's Hang Seng Index was up 0.33 percent and the Shanghai Composite finished the session 0.12 percent higher. European markets were higher on Wednesday morning as investors geared up for a rate decision from the U.S. Federal Reserve. The pan-European Stoxx 600 was trading up 0.41 percent with almost all sectors and major bourses in positive territory. Company Headlines Home Capital Group, Inc. (HCG-T) said it repaid the balance on a C$2 billion credit line from Warren Buffett’s Berkshire Hathaway Inc. after the Canadian mortgage lender sold assets. Home Capital received C$662 million from its previously announced agreement to sell some commercial mortgages, the Toronto-based firm said. The company has received about C$1.13 billion in total on the sale and discharges of commercial mortgages tied to its initiatives to increase liquidity. Viacom, Inc. (VIAB-Q) has informed Scripps Networks Interactive (SNI-Q) that it is willing to pay all cash to acquire the U.S. TV network operator, sources familiar with the matter said on Tuesday. The move by Viacom, which had $12.17 billion in debt as of March 31, could potentially mean that the $14.3 billion media company would lose its investment-grade status to buy the $10.6 billion Scripps. Viacom is competing against Discovery Communications in the bid for Scripps, which owns channels such as HGTV, Food Network and Travel Channel. Coca-Cola Co (KO-N) reported a 60.2 percent drop in quarterly profit, as the beverage maker incurred a charge of $653 million related to refranchising its North America bottling operations. Net income attributable to Coca-Cola's shareholders fell to $1.37 billion, or 32 cents per share, in the second quarter ended June 30, from $3.45 billion, or 79 cents per share, a year earlier. Revenue fell to $9.70 billion from $11.54 billion a year earlier, falling for the ninth straight quarter, hurt by a strong dollar and the refranchising of bottling territories. Sources: Marketwatch, Bloomberg, The Canadian Press, Canadian Newswire, WSJ, Globe and Mail, Financial Post, NYT, FactSet,Thomson Reuters, StreetAccount, CNBC, RTT News) July 26, 2017
- 2. Before the Open July 26, 2017 Page 2 * Canadian Equities Upgrades - March 6 Weekly Canada Economic Calendar - July 24 to July 28, 2017 Date/Time Event Period Consensus Actual Prior 07/24/2017 08:30 Wholesale Trade Sales MoM May 0.50% 0.90% 0.80% 07/24/2017 10:00 Bloomberg Nanos Confidence 21-Jul -- 58.8 58.2 07/27/2017 CFIB Business Barometer Jul -- -- 60.9 07/28/2017 08:30 GDP MoM May 0.20% -- 0.20% 07/28/2017 08:30 GDP YoY May 4.20% -- 3.30% S&P/TSX Daily Performance 13000 13500 14000 14500 15000 15500 16000 Jul-16 Sep-16 Nov-16 Jan-17 Mar-17 May-17 Jul-17 Leaders - Prior Session Company Ticker % Change Westshore Terminals Investment CorpWTE-T 13.66 Baytex Energy Corp BTE-T 8.55 Home Capital Group Inc HCG-T 7.99 Hudbay Minerals Inc HBM-T 7.84 MEG Energy Corp MEG-T 7.60 Laggards - Prior Session Company Ticker % Change Klondex Mines Ltd KDX-T -4.63 B2Gold Corp BTO-T -3.57 Exchange Income Corp EIF-T -3.07 Franco-Nevada Corp FNV-T -2.91 New Gold Inc NGD-T -2.85 Canadian Equity Upgrades Canadian National raised to Buy at Cormark Canadian Equity Downgrades Mullen Group cut to Market Perform at Cormark+ Today's Earnings – Canada Calfrac Well Services Ltd -$0.20, Tembec Inc $0.23, Capital Power Corp $0.26, Vermilion Energy Inc $0.00, Loblaw Cos Ltd $1.10, theScore Inc -$0.01, FirstService Corp $0.61, Barrick Gold Corp $0.17, Agnico Eagle Mines Ltd $0.15, Canfor Corp $0.54, New Gold Inc $0.02, Goldcorp Inc $0.09, Uni-Select Inc $0.36, IMAX Corp $0.15, Lundin Mining Corp $0.06, Sherritt International Corp -$0.08, Western Energy Services Corp -$0.21, Constellation Software Inc/Canada $5.42, Acadian Timber Corp $0.07, Canfor Pulp Products Inc $0.32, Detour Gold Corp $0.07, Athabasca Oil Corp - $0.05, Suncor Energy Inc $0.19, Methanex Corp $1.08, Taseko Mines Ltd $0.02
- 3. Before the Open July 26, 2017 Page 3 Weekly U.S. Economic Calendar - July 24 to July 28, 2017 Date/Time Event Period Consensus Actual Prior 07/24/2017 09:45 Markit US Manufacturing PMI Jul P 52.3 53.2 52 07/24/2017 09:45 Markit US Services PMI Jul P 54.2 54.2 54.2 07/24/2017 09:45 Markit US Composite PMI Jul P -- 54.2 53.9 07/24/2017 10:00 Existing Home Sales Jun 5.57m 5.52m 5.62m 07/24/2017 10:00 Existing Home Sales MoM Jun -0.90% -1.80% 1.10% 07/25/2017 09:00 FHFA House Price Index MoM May 0.50% 0.40% 0.60% 07/25/2017 09:00 S&P CoreLogic CS 20-City MoM SA May 0.30% 0.10% -0.18% 07/25/2017 09:00 S&P CoreLogic CS 20-City YoY NSA May 5.80% 5.69% 5.77% 07/25/2017 09:00 S&P CoreLogic CS 20-City NSA Index May -- 198.97 197.38 07/25/2017 09:00 S&P CoreLogic CS US HPI YoY NSA May -- 5.58% 5.65% 07/25/2017 09:00 S&P CoreLogic CS US HPI NSA Index May -- 190.61 188.77 07/25/2017 10:00 Conf. Board Consumer Confidence Jul 116.5 121.1 117.3 07/25/2017 10:00 Richmond Fed Manufact. Index Jul 7 14 11 07/26/2017 07:00 MBA Mortgage Applications 21-Jul -- 0.40% 6.30% 07/26/2017 10:00 New Home Sales Jun 615k -- 610k 07/26/2017 10:00 New Home Sales MoM Jun 0.80% -- 2.90% 07/26/2017 14:00 FOMC Rate Decision (Upper Bound) 26-Jul 1.25% -- 1.25% 07/26/2017 14:00 FOMC Rate Decision (Lower Bound) 26-Jul 1.00% -- 1.00% 07/27/2017 08:30 Initial Jobless Claims 22-Jul 240k -- 233k 07/27/2017 08:30 Continuing Claims 15-Jul 1960k -- 1977k 07/27/2017 08:30 Durable Goods Orders Jun P 3.50% -- -0.80% 07/27/2017 08:30 Durables Ex Transportation Jun P 0.40% -- 0.30% 07/27/2017 08:30 Cap Goods Orders Nondef Ex Air Jun P 0.30% -- 0.20% 07/27/2017 08:30 Cap Goods Ship Nondef Ex Air Jun P 0.30% -- 0.10% 07/27/2017 08:30 Advance Goods Trade Balance Jun -$65.5b -- -$66.3b 07/27/2017 08:30 Wholesale Inventories MoM Jun P 0.30% -- 0.40% 07/27/2017 08:30 Chicago Fed Nat Activity Index Jun 0.35 -- -0.26 07/27/2017 09:45 Bloomberg Consumer Comfort 23-Jul -- -- 47.6 07/27/2017 11:00 Kansas City Fed Manf. Activity Jul 11 -- 11 07/28/2017 08:30 GDP Annualized QoQ 2Q A 2.50% -- 1.40% 07/28/2017 08:30 Personal Consumption 2Q A 2.90% -- 1.10% 07/28/2017 08:30 GDP Price Index 2Q A 1.30% -- 1.90% 07/28/2017 08:30 Core PCE QoQ 2Q A 0.70% -- 2.00% 07/28/2017 08:30 Employment Cost Index 2Q 0.60% -- 0.80% 07/28/2017 10:00 U. of Mich. Sentiment Jul F 93.1 -- 93.1 S&P 500 Daily Performance 1950 2050 2150 2250 2350 2450 Jul-16 Sep-16 Nov-16 Jan-17 Mar-17 May-17 Jul-17 Leaders - Prior Session Company Ticker % Change Freeport-McMoRan Inc FCX-US 14.74 Newmont Mining Corp NEM-US 6.90 Range Resources Corp RRC-US 6.86 Caterpillar Inc CAT-US 5.88 Signet Jewelers Ltd SIG-US 5.49 Laggards - Prior Session Company Ticker % Change Seagate Technology PLC STX-US -16.50 Interpublic Group of Cos Inc/TheIPG-US -13.34 Micron Technology Inc MU-US -5.59 Waters Corp WAT-US -5.35 3M Co MMM-US -5.05 U.S. Equity Upgrades Domino's raised to Overweight at Stephens Electronic Arts raised to Buy at Bank of America Merrill Lynch U.S. Equity Downgrades CF Industries cut to Neutral at Credit Suisse Seagate cut to Sell at Cross Research Today's Earnings – U.S. Alaska Air Group Inc $2.52, Hess Corp -$1.30, Baxter International Inc $0.57, Coca- Cola Co/The $0.58, Corning Inc $0.40, Ingersoll-Rand PLC $1.46, Laboratory Corp of America Holdings $2.41, Northrop Grumman Corp $2.86, Thermo Fisher Scientific Inc $2.27, DR Horton Inc $0.75, AO Smith Corp $0.53, Waste Management Inc $0.81, DDR Corp $0.28, Six Flags Entertainment Corp $0.72, Rockwell Automation Inc $1.65, MarketAxess Holdings Inc $0.92, Owens Corning $1.08, Hilton Worldwide Holdings Inc $0.50, Anthem Inc $3.23, Ford Motor Co $0.43, Hershey Co/The $0.90, State Street Corp $1.57, Lear Corp $4.11, Boeing Co/The $2.30, NextEra Energy Inc $1.74, General Dynamics Corp $2.43, FLIR Systems Inc $0.42, Norfolk Southern Corp $1.65, USG Corp $0.52, BGC Partners Inc $0.24, Legg Mason Inc $0.51, Gilead Sciences Inc $2.14, Realty Income Corp $0.76, Facebook Inc $1.13, Buffalo Wild Wings Inc $1.05, PayPal Holdings Inc $0.43, Whirlpool Corp $3.54, O'Reilly Automotive Inc $2.89, Teradyne Inc $0.86, Kimco Realty Corp $0.38, Host Hotels & Resorts Inc $0.47, Raymond James Financial Inc $1.27, Public Storage $2.55, Lam Research Corp $3.03, Quidel Corp -$0.09, Vertex Pharmaceuticals Inc $0.35, Whole Foods Market Inc $0.33, Xilinx Inc $0.60, Omega Healthcare Investors Inc $0.81, Ethan Allen Interiors Inc $0.42, Tractor Supply Co $1.27, Knight Transportation Inc $0.25, Rent-A-Center Inc/TX $0.08, Getty Realty Corp $0.40, F5 Networks Inc $2.03, QEP Resources Inc -$0.20, Packaging Corp of America $1.47, Edwards Lifesciences Corp $0.88, Regal Entertainment Group $0.18, Whiting Petroleum Corp -$0.19, Las Vegas Sands Corp $0.59, Fortinet Inc $0.20, Discover Financial Services $1.44, AGNC Investment Corp $0.60, ServiceNow Inc $0.20, Knowles Corp $0.11, Celadon Group Inc -$0.23, Medicines Co/The -$5.17, Vantiv Inc $0.82, Planet Fitness Inc $0.19
- 4. Before the Open July 26, 2017 Page 4 Appendix A - Important Information General Research Disclaimer The statements and statistics contained herein are based on material believed to be reliable, but are not guaranteed to be accurate or complete. This report is for informational purposes only and is not an offer or solicitation with respect to the purchase or sale of any investment fund, security or other product. Particular investment, trading, or tax strategies should be evaluated relative to each individual’s objectives. Graphs and charts are used for illustrative purposes only and do not reflect future values or future performance. This document does not provide individual financial, legal, investment or tax advice. Please consult your own legal, investment and tax advisor. All opinions and other information in this document are subject to change without notice. The Toronto-Dominion Bank and its affiliates and related entities are not liable for any errors or omissions in the information or for any loss or damage suffered. TD Waterhouse Canada Inc. and/or its affiliated persons or companies may hold a position in the securities mentioned, including options, futures and other derivative instruments thereon, and may, as principal or agent, buy or sell such securities. Affiliated persons or companies may also make a market in and participate in an underwriting of such securities. Full disclosures for all companies covered by TD Securities Inc. can be viewed at https://www.tdsresearch.com/equities/welcome.important.disclosure.action Research Ratings Action List BUY: The stock’s total return is expected to exceed a minimum of 15%, on a risk-adjusted basis, over the next 12 months and it is a top pick in the Analyst’s sector. BUY: The stock’s total return is expected to exceed a minimum of 15%, on a risk-adjusted basis, over the next 12 months. SPECULATIVE BUY: The stock’s total return is expected to exceed 30% over the next 12 months; however, there is material event risk associated with the investment that could result in significant loss. HOLD: The stock’s total return is expected to be between 0% and 15%, on a risk-adjusted basis, over the next 12 months. TENDER: Investors are advised to tender their shares to a specific offer for the company’s securities. REDUCE: The stock’s total return is expected to be negative over the next 12 months. Technical Research Disclaimer The opinions expressed herein reflect a technical perspective and may differ from fundamental research on these issuers. Fundamental research can be obtained through your TD Wealth advisor or on the Markets and Research site within WebBroker. The technical research opinions contained in this report are based on historical technical data and expectations of the most likely direction of a market or security. No guarantee of that outcome is ever implied. Research Report Dissemination Policy TD Waterhouse Canada Inc. makes its research products available in electronic format. These research products are posted to our proprietary websites for all eligible clients to access by password and we distribute the information to our sales personnel who then may distribute it to their retail clients under the appropriate circumstances either by email, fax or regular mail. No recipient may pass on to any other person, or reproduce by any means, the information contained in this report without our prior written consent. Analyst Certification The Portfolio Advice and Investment Research analyst(s) responsible for this report hereby certify that (i) the recommendations and technical opinions expressed in the research report accurately reflect the personal views of the analyst(s) about any and all of the securities or issuers discussed herein, and (ii) no part of the research analyst’s compensation was, is, or will be, directly or indirectly, related to the provision of specific recommendations or views expressed by the research analyst in the research report. Conflicts of Interest The Portfolio Advice & Investment Research analyst(s) responsible for this report may own securities of the issuer(s) discussed in this report. As with most other employees, the analyst(s) who prepared this report are compensated based upon (among other factors) the overall profitability of TD Waterhouse Canada Inc. and its affiliates, which includes the overall profitability of investment banking services, however TD Waterhouse Canada Inc. does not compensate its analysts based on specific investment banking transactions.
- 5. Before the Open July 26, 2017 Page 5 Corporate Disclosure TD Wealth represents the products and services offered by TD Waterhouse Canada Inc. (Member – Canadian Investor Protection Fund), TD Waterhouse Private Investment Counsel Inc., TD Wealth Private Banking (offered by The Toronto-Dominion Bank) and TD Wealth Private Trust (offered by The Canada Trust Company). The Portfolio Advice and Investment Research team is part of TD Waterhouse Canada Inc., a subsidiary of The Toronto-Dominion Bank. Trade-mark Disclosures Bloomberg and Bloomberg.com are trademarks and service marks of Bloomberg Finance L.P., a Delaware limited partnership, or its subsidiaries. All rights reserved. “TD Securities” is the trade name which TD Securities Inc. and TD Securities (USA) LLC. jointly use to market their institutional equity services. TD Securities is a trade-mark of The Toronto-Dominion Bank representing TD Securities Inc., TD Securities (USA) LLC, TD Securities Limited and certain corporate and investment banking activities of The Toronto-Dominion Bank. All trademarks are the property of their respective owners. ® The TD logo and other trade-marks are the property of The Toronto-Dominion Bank. FTSE TMX Global Debt Capital Markets Inc. 2016 "FTSE®" is a trade mark of FTSE International Ltd and is used under licence. "TMX” is a trade mark of TSX Inc. and is used under licence. All rights in the FTSE TMX Global Debt Capital Markets Inc.'s indices and / or FTSE TMX Global Debt Capital Markets Inc.'s ratings vest in FTSE TMX Global Debt Capital Markets Inc. and/or its licensors. Neither FTSE TMX Global Debt Capital Markets Inc. nor its licensors accept any liability for any errors or omissions in such indices and / or ratings or underlying data. No further distribution of FTSE TMX Global Debt Capital Markets Inc.'s data is permitted without FTSE TMX Global Debt Capital Markets Inc.'s express written consent.