SlideShare a Scribd company logo
1 of 3
Download to read offline
NettWorth Financial Group
Jason Fuchs
*Wealth Manager
240 Canal Blvd, Ste 6
Ponte Vedra Beach, FL 32082
904-395-3806
Branch 904-834-2998
jfuchs@nettworth.us
http://www.jasonfuchs.com
Market Month: July 2018
August 01, 2018
The Markets (as of market close July 31, 2018)
Favorable economic indicators and encouraging corporate earnings reports helped propel stocks forward in
July. Market growth has come despite trade wars between the United States and other trade partners,
particularly China. Earlier in the month, the world's two largest economies imposed tariffs of $34 billion on
each other's goods. Toward the end of July, there was hope of reopening negotiations between the United
States and China in an attempt to diffuse the ongoing trade war. Domestically, the U.S. economy appears
to be thriving. Over 210,000 new jobs were added in June, although wages have grown by only 2.7% over
the last 12 months. Nevertheless, consumers are making more and spending more, while inflationary
pressures on prices for goods and services remain in check.
Despite some periods of volatility, July proved to be a very good month for the benchmark indexes listed
here. Led by the Dow, large caps, small caps, and tech stocks gained value over their respective June
closing prices. Year-to-date, the Nasdaq is ahead by over 11.0%, followed by the Russell 2000, the S&P
500, the Dow, and the Global Dow, which is only 0.20% above its 2017 year-end value.
By the close of trading on July 31, the price of crude oil (WTI) was $68.43 per barrel, down from the June
29 price of $74.25 per barrel. The national average retail regular gasoline price was $2.772 per gallon on
July 30, down from the June 25 selling price of $2.833 but $0.305 more than a year ago. The price of gold
decreased by the end of July, closing at $1,232.90 on the last trading day of the month, down from its price
of $1,254.20 at the end of June.
Market/Index 2017 Close Prior Month As of July 31 Month Change YTD Change
DJIA 24719.22 24271.41 25415.19 4.71% 2.82%
NASDAQ 6903.39 7510.30 7671.79 2.15% 11.13%
S&P 500 2673.61 2718.37 2816.29 3.60% 5.34%
Russell 2000 1535.51 1643.07 1670.80 1.69% 8.81%
Global Dow 3085.41 2979.52 3091.69 3.76% 0.20%
Fed. Funds 1.25%-1.50% 1.75%-2.00% 1.75%-2.00% 0 bps 50 bps
10-year
Treasuries
2.41% 2.86% 2.96% 10 bps 55 bps
Chart reflects price changes, not total return. Because it does not include dividends or splits, it should not
be used to benchmark performance of specific investments.
Last Month's Economic News
• Employment: Total employment rose by 213,000 in June after adding 244,000 (revised) new jobs in
May. The average monthly gain over the last three months is 211,000. Total employment has grown by
2.4 million over the last 12 months ended in June. Notable employment gains for the month occurred in
professional and business services (50,000), manufacturing (36,000), and health care (25,000). Retail
trade, which had posted notable job gains in May, lost 22,000 jobs in June. The unemployment rate rose
to 4.0% from 3.8%. The number of unemployed persons increased by 499,000 to 6.6 million. A year
Page 1 of 3, see disclaimer on final page
earlier, the jobless rate was 4.3% and the number of unemployed persons was 7.0 million. The labor
participation rate edged up 0.2 percentage point over the month to 62.9%. The employment-population
ratio held at 60.4%. The average workweek was unchanged at 34.5 hours for the month. Average hourly
earnings increased by $0.05 to $26.98. Over the last 12 months, average hourly earnings have risen
$0.72, or 2.7%.
• FOMC/interest rates: The Federal Open Market Committee does not conclude its next meeting until
August 1. It is possible that interest rates will remain the same following this meeting. However, unless
economic circumstances change dramatically over the next several months, it is likely that rates will be
increased twice more before the end of 2018.
• GDP/budget: The second-quarter gross domestic product showed the economy expanded at an annual
rate of 4.1%, according to the Bureau of Economic Analysis. The first-quarter GDP grew at an
annualized rate of 2.2%. According to the report, consumer spending (personal consumption
expenditures) surged, expanding at a rate of 4.0%. Net exports expanded by 9.3%. This is the first, or
advance, estimate for the second quarter GDP. The next estimates, in August and September, will
include more complete economic data. With only three months remaining in the fiscal year, the
government budget deficit sits at $607.1 billion through June 30. Over the same period last year, the
budget deficit was $523.1 billion — a difference of about 16%.
• Inflation/consumer spending: Consumer spending, as measured by personal consumption
expenditures, jumped 0.4% in June after climbing 0.5% (revised) in May. Core consumer prices, a
tracker of inflationary trends, increased 0.1% in June. Core prices have increased 1.9% over the last 12
months.
• The Consumer Price Index rose 0.1% in June after increasing 0.2% in May. Over the last 12 months
ended in June, consumer prices are up 2.9% — the largest 12-month increase since the period ended
February 2012. Core prices, which exclude food and energy, climbed 0.2% for the month, and are up
2.3% for the year.
• The Producer Price Index showed the prices companies receive for goods and services climbed 0.3%
following a 0.5% jump in May. Producer prices have increased 3.4% over the 12 months ended in June,
which is the largest 12-month increase since climbing 3.7% in November 2011. Prices less food and
energy increased 0.3% for June and are up 2.7% over the last 12 months. Prices for services moved up
0.4% in June.
• Housing: Sales of existing homes continued to slow in June. Total existing-home sales fell 0.6% for the
month after dropping 0.4% in May. Year-over-year, existing home sales are down 2.2%. The June
median price for existing homes was $276,900, which is 5.2% higher than the June 2017 price of
$263,300. Inventory for all types of existing homes for sale rose 4.3% in June — 0.5% above a year ago.
New home sales regressed in June after climbing 6.7% in May. The median sales price of new houses
sold in June was $302,100 ($313,000 in May). The average sales price was $363,300 ($368,500 in
May). Inventory rose slightly in June to 5.7 months, up from the 5.2-month supply in May.
• Manufacturing: Industrial production advanced 0.6% in June after edging down 0.1% in May. For the
second quarter as a whole, industrial production advanced at an annual rate of 6.0% — its third
consecutive quarterly increase. Manufacturing output increased 0.8% following a 0.7% drop in May. The
index for mining rose 1.2%, its fifth consecutive month of growth. The output of utilities fell 1.5%.
Capacity utilization, which estimates the potential for sustainable output for total industrial production,
rose 0.3 percentage point for the month, and is up 1.5% over the last 12 months. New orders for
manufactured durable goods climbed 1.0% in June following a 0.3% drop in May.
• Imports and exports: The advance report on international trade in goods revealed that the trade gap
expanded by $3.6 billion in June, or 5.5%, over May. The deficit for June was $68.3 billion (the May
deficit was $64.8 billion). June exports of goods fell 1.5%, while imports increased 0.6%. On a
seasonally adjusted basis, June's total imports ($210,263 billion) far exceeded exports ($141,931
billion). Prices for imported goods fell 0.4% in June, while export prices rose 0.3%. Over the last twelve
months ended in June, import prices are up 4.3%, while export prices have advanced 5.3%. Overall,
increasing tariffs don't appear to be a factor in prices, at least for June.
• International markets: European stocks got a boost from favorable corporate earnings reports and
positive rhetoric emanating from a meeting between President Trump and European Commission
President Juncker aimed at reducing reciprocal tariffs between the governing bodies. Japan and the
European Union agreed to a free-trade pact that is targeted at reducing tariffs on Japanese automobiles
and parts and European foods imported by Japan. The Chinese yuan has lost value compared to the
dollar. Speculation is that the Chinese government is allowing its currency to weaken, lowering the cost
of Chinese exports around the world, which may help offset the effect of U.S. tariffs on Chinese imports.
Nevertheless, economic growth in China has slowed as a result of the tariff war with the United States.
• Consumer confidence: Consumer confidence, as measured by The Conference Board Consumer
Key Dates/Data Releases
8/1: FOMC announcement,
PMI Manufacturing Index,
ISM Manufacturing Index
8/5: Employment situation,
international trade
8/7: JOLTS
8/9: Producer Price Index
8/10: Consumer Price Index,
Treasury budget
8/14: Import and export
prices
8/15: Retail sales, industrial
production
8/16: Housing starts
8/22: Existing home sales
8/23: New home sales
8/24: Durable goods orders
8/28: International trade in
goods
8/29: GDP
8/30: Personal income and
outlays
Page 2 of 3, see disclaimer on final page
Prepared by Broadridge Investor Communication Solutions, Inc. Copyright 2018Prepared by Broadridge Investor Communication Solutions, Inc. Copyright 2018
Confidence Index®, gained some positive traction after dipping in June. According to the report,
consumers' confidence in the present economic conditions improved, but expectations for future growth
were tempered.
Eye on the Month Ahead
The economy continues to show signs of strengthening despite trade wars, rising interest rates, and a
stagnant real estate market. The labor market is expected to maintain its strong pace, while industrial
production has been steady. Overall, August should see ongoing economic strengthening.
Data sources: Economic: Based on data from U.S. Bureau of Labor Statistics (unemployment, inflation);
U.S. Department of Commerce (GDP, corporate profits, retail sales, housing); S&P/Case-Shiller 20-City
Composite Index (home prices); Institute for Supply Management (manufacturing/services). Performance:
Based on data reported in WSJ Market Data Center (indexes); U.S. Treasury (Treasury yields); U.S.
Energy Information Administration/Bloomberg.com Market Data (oil spot price, WTI Cushing, OK);
www.goldprice.org (spot gold/silver); Oanda/FX Street (currency exchange rates). News items are based
on reports from multiple commonly available international news sources (i.e. wire services) and are
independently verified when necessary with secondary sources such as government agencies, corporate
press releases, or trade organizations. All information is based on sources deemed reliable, but no
warranty or guarantee is made as to its accuracy or completeness. Neither the information nor any opinion
expressed herein constitutes a solicitation for the purchase or sale of any securities, and should not be
relied on as financial advice. Past performance is no guarantee of future results. All investing involves risk,
including the potential loss of principal, and there can be no guarantee that any investing strategy will be
successful.
The Dow Jones Industrial Average (DJIA) is a price-weighted index composed of 30 widely traded
blue-chip U.S. common stocks. The S&P 500 is a market-cap weighted index composed of the common
stocks of 500 leading companies in leading industries of the U.S. economy. The NASDAQ Composite Index
is a market-value weighted index of all common stocks listed on the NASDAQ stock exchange. The Russell
2000 is a market-cap weighted index composed of 2,000 U.S. small-cap common stocks. The Global Dow
is an equally weighted index of 150 widely traded blue-chip common stocks worldwide. The U.S. Dollar
Index is a geometrically weighted index of the value of the U.S. dollar relative to six foreign currencies.
Market indices listed are unmanaged and are not available for direct investment.
*Securities and advisory services offered through FSC Securities Corporation (FSC) member FINRA / SIPC
. FSC is separately owned and other entities and/or marketing names, products or services referenced here
are independent of FSC. Your Company and/or representative Union does not sponsor or endorse
NettWorth. NettWorth Financial Group and FSC Securities Corporation are not affiliated or employed by
your Company and/or representative union.
This message may contain confidential information and is intended for use only by the addressee(s) named
on this transmission.
Broadridge Investor Communication Solutions, Inc. does not provide investment, tax, or legal advice. The
information presented here is not specific to any individual's personal circumstances.
To the extent that this material concerns tax matters, it is not intended or written to be used, and cannot be
used, by a taxpayer for the purpose of avoiding penalties that may be imposed by law. Each taxpayer
should seek independent advice from a tax professional based on his or her individual circumstances.
These materials are provided for general information and educational purposes based upon publicly
available information from sources believed to be reliable—we cannot assure the accuracy or completeness
of these materials. The information in these materials may change at any time and without notice.
Page 3 of 3

More Related Content

What's hot

E-UPDates—A Monthly Statistical Bulletin
E-UPDates—A Monthly Statistical BulletinE-UPDates—A Monthly Statistical Bulletin
E-UPDates—A Monthly Statistical BulletinEcofin Surge
 
Perfomance of the Economy Report for July,2017
Perfomance of the Economy Report for July,2017Perfomance of the Economy Report for July,2017
Perfomance of the Economy Report for July,2017June A. Clare Nyakahuma
 
Ukraine Monthly Economic Review, June 2017
Ukraine Monthly Economic Review, June 2017  Ukraine Monthly Economic Review, June 2017
Ukraine Monthly Economic Review, June 2017 DIXI Group
 
Fixed Income Market Update (4-30-10)
Fixed Income Market Update (4-30-10)Fixed Income Market Update (4-30-10)
Fixed Income Market Update (4-30-10)Michael Matthews
 
PPT ON INFLATION BY ANSHUL UPNEJA OF CLASSS XI
PPT ON INFLATION BY ANSHUL UPNEJA OF CLASSS XIPPT ON INFLATION BY ANSHUL UPNEJA OF CLASSS XI
PPT ON INFLATION BY ANSHUL UPNEJA OF CLASSS XIAnshul Upneja
 
Vietnam Inflation forecast 2016-2017
Vietnam Inflation forecast 2016-2017Vietnam Inflation forecast 2016-2017
Vietnam Inflation forecast 2016-2017Tran Thang
 
Flash Comment - July 11, 2011
Flash Comment - July 11, 2011Flash Comment - July 11, 2011
Flash Comment - July 11, 2011Swedbank
 
Ulster Bank Northern Ireland PMI May 2021 PMI Slide Pack
Ulster Bank Northern Ireland PMI May 2021 PMI Slide PackUlster Bank Northern Ireland PMI May 2021 PMI Slide Pack
Ulster Bank Northern Ireland PMI May 2021 PMI Slide PackRichard Ramsey
 
20180418_NordeaResearch_EAInfl_n_ECB
20180418_NordeaResearch_EAInfl_n_ECB20180418_NordeaResearch_EAInfl_n_ECB
20180418_NordeaResearch_EAInfl_n_ECBKarlFrank99
 
Monthly Newsletter 7/2015
Monthly Newsletter 7/2015Monthly Newsletter 7/2015
Monthly Newsletter 7/2015Latvijas Banka
 
Low Interest Rates and the UK Economy
Low Interest Rates and the UK EconomyLow Interest Rates and the UK Economy
Low Interest Rates and the UK Economytutor2u
 
2016 06 01_weekly_export_risk_outlook-n21
2016 06 01_weekly_export_risk_outlook-n212016 06 01_weekly_export_risk_outlook-n21
2016 06 01_weekly_export_risk_outlook-n21Ethos Media S.A.
 
Ukraine Monthly Economic Review, July 2017
Ukraine Monthly Economic Review, July 2017 Ukraine Monthly Economic Review, July 2017
Ukraine Monthly Economic Review, July 2017 DIXI Group
 
AUGUST IIP NUMBER BEATS SLOWDOWN SPECIAL REPORT
 AUGUST IIP NUMBER BEATS SLOWDOWN SPECIAL REPORT AUGUST IIP NUMBER BEATS SLOWDOWN SPECIAL REPORT
AUGUST IIP NUMBER BEATS SLOWDOWN SPECIAL REPORTequityreport11
 
Us econ ppt lynchburg 3-4-2011 final_dr.shea
Us econ ppt lynchburg 3-4-2011 final_dr.sheaUs econ ppt lynchburg 3-4-2011 final_dr.shea
Us econ ppt lynchburg 3-4-2011 final_dr.shealynchburg
 

What's hot (20)

E-UPDates—A Monthly Statistical Bulletin
E-UPDates—A Monthly Statistical BulletinE-UPDates—A Monthly Statistical Bulletin
E-UPDates—A Monthly Statistical Bulletin
 
Perfomance of the Economy Report for July,2017
Perfomance of the Economy Report for July,2017Perfomance of the Economy Report for July,2017
Perfomance of the Economy Report for July,2017
 
Ukraine Monthly Economic Review, June 2017
Ukraine Monthly Economic Review, June 2017  Ukraine Monthly Economic Review, June 2017
Ukraine Monthly Economic Review, June 2017
 
Fixed Income Market Update (4-30-10)
Fixed Income Market Update (4-30-10)Fixed Income Market Update (4-30-10)
Fixed Income Market Update (4-30-10)
 
PPT ON INFLATION BY ANSHUL UPNEJA OF CLASSS XI
PPT ON INFLATION BY ANSHUL UPNEJA OF CLASSS XIPPT ON INFLATION BY ANSHUL UPNEJA OF CLASSS XI
PPT ON INFLATION BY ANSHUL UPNEJA OF CLASSS XI
 
Canada GDP – August 2016
Canada GDP – August 2016Canada GDP – August 2016
Canada GDP – August 2016
 
Vietnam Inflation forecast 2016-2017
Vietnam Inflation forecast 2016-2017Vietnam Inflation forecast 2016-2017
Vietnam Inflation forecast 2016-2017
 
Flash Comment - July 11, 2011
Flash Comment - July 11, 2011Flash Comment - July 11, 2011
Flash Comment - July 11, 2011
 
Economic Review 2015-12
Economic Review 2015-12Economic Review 2015-12
Economic Review 2015-12
 
Economic Review 2016-01
Economic Review 2016-01Economic Review 2016-01
Economic Review 2016-01
 
12082014
1208201412082014
12082014
 
Ulster Bank Northern Ireland PMI May 2021 PMI Slide Pack
Ulster Bank Northern Ireland PMI May 2021 PMI Slide PackUlster Bank Northern Ireland PMI May 2021 PMI Slide Pack
Ulster Bank Northern Ireland PMI May 2021 PMI Slide Pack
 
20180418_NordeaResearch_EAInfl_n_ECB
20180418_NordeaResearch_EAInfl_n_ECB20180418_NordeaResearch_EAInfl_n_ECB
20180418_NordeaResearch_EAInfl_n_ECB
 
Monthly Newsletter 7/2015
Monthly Newsletter 7/2015Monthly Newsletter 7/2015
Monthly Newsletter 7/2015
 
Low Interest Rates and the UK Economy
Low Interest Rates and the UK EconomyLow Interest Rates and the UK Economy
Low Interest Rates and the UK Economy
 
Bce emploipdf
Bce emploipdfBce emploipdf
Bce emploipdf
 
2016 06 01_weekly_export_risk_outlook-n21
2016 06 01_weekly_export_risk_outlook-n212016 06 01_weekly_export_risk_outlook-n21
2016 06 01_weekly_export_risk_outlook-n21
 
Ukraine Monthly Economic Review, July 2017
Ukraine Monthly Economic Review, July 2017 Ukraine Monthly Economic Review, July 2017
Ukraine Monthly Economic Review, July 2017
 
AUGUST IIP NUMBER BEATS SLOWDOWN SPECIAL REPORT
 AUGUST IIP NUMBER BEATS SLOWDOWN SPECIAL REPORT AUGUST IIP NUMBER BEATS SLOWDOWN SPECIAL REPORT
AUGUST IIP NUMBER BEATS SLOWDOWN SPECIAL REPORT
 
Us econ ppt lynchburg 3-4-2011 final_dr.shea
Us econ ppt lynchburg 3-4-2011 final_dr.sheaUs econ ppt lynchburg 3-4-2011 final_dr.shea
Us econ ppt lynchburg 3-4-2011 final_dr.shea
 

Similar to Market Month: July 2018

Wdg Newsletter November2009 Vs2
Wdg Newsletter November2009 Vs2Wdg Newsletter November2009 Vs2
Wdg Newsletter November2009 Vs2dpieper
 
Third Quarter 2015 Economic Report (Oct 2015)
Third Quarter 2015 Economic Report (Oct 2015) Third Quarter 2015 Economic Report (Oct 2015)
Third Quarter 2015 Economic Report (Oct 2015) Marketing Durban Chamber
 
Game change in global economics
Game change in global economicsGame change in global economics
Game change in global economicsSelvan Athishtaraj
 
Swedbank Baltic Sea Analysis No. 25
Swedbank Baltic Sea Analysis No. 25Swedbank Baltic Sea Analysis No. 25
Swedbank Baltic Sea Analysis No. 25Swedbank
 
QuilterFA-ER-May22 | Sat Mehat.pdf
QuilterFA-ER-May22 | Sat Mehat.pdfQuilterFA-ER-May22 | Sat Mehat.pdf
QuilterFA-ER-May22 | Sat Mehat.pdfSat Mehat
 
Economic indicators for week of June 21-25
Economic indicators for week of June 21-25Economic indicators for week of June 21-25
Economic indicators for week of June 21-25NAR Research
 
Canadian gdp may2010
Canadian gdp may2010Canadian gdp may2010
Canadian gdp may2010Vahab Jalali
 
Monthly Economic Update For March 2011
Monthly Economic Update For March 2011Monthly Economic Update For March 2011
Monthly Economic Update For March 2011tjsulli1
 
2015 review economy & market
2015 review   economy & market2015 review   economy & market
2015 review economy & marketmelanig123
 
Economic Indicators for week of August 30-September 3, 2010
Economic Indicators for week of August 30-September 3, 2010Economic Indicators for week of August 30-September 3, 2010
Economic Indicators for week of August 30-September 3, 2010NAR Research
 
Energy & Commodities - 2010, July/August
Energy & Commodities - 2010, July/AugustEnergy & Commodities - 2010, July/August
Energy & Commodities - 2010, July/AugustSwedbank
 
The World This Week - 25 to 29th July, 2016
The World This Week - 25 to 29th July, 2016The World This Week - 25 to 29th July, 2016
The World This Week - 25 to 29th July, 2016Karvy Private Wealth
 

Similar to Market Month: July 2018 (20)

Class5
Class5Class5
Class5
 
Looking Bach 1508
Looking Bach 1508Looking Bach 1508
Looking Bach 1508
 
Wdg Newsletter November2009 Vs2
Wdg Newsletter November2009 Vs2Wdg Newsletter November2009 Vs2
Wdg Newsletter November2009 Vs2
 
Third Quarter 2015 Economic Report (Oct 2015)
Third Quarter 2015 Economic Report (Oct 2015) Third Quarter 2015 Economic Report (Oct 2015)
Third Quarter 2015 Economic Report (Oct 2015)
 
Advice for the wise - June 2015
Advice for the wise - June 2015Advice for the wise - June 2015
Advice for the wise - June 2015
 
Game change in global economy
Game change in global economyGame change in global economy
Game change in global economy
 
Game change in global economics
Game change in global economicsGame change in global economics
Game change in global economics
 
Swedbank Baltic Sea Analysis No. 25
Swedbank Baltic Sea Analysis No. 25Swedbank Baltic Sea Analysis No. 25
Swedbank Baltic Sea Analysis No. 25
 
QuilterFA-ER-May22 | Sat Mehat.pdf
QuilterFA-ER-May22 | Sat Mehat.pdfQuilterFA-ER-May22 | Sat Mehat.pdf
QuilterFA-ER-May22 | Sat Mehat.pdf
 
Economic indicators for week of June 21-25
Economic indicators for week of June 21-25Economic indicators for week of June 21-25
Economic indicators for week of June 21-25
 
Canadian gdp may2010
Canadian gdp may2010Canadian gdp may2010
Canadian gdp may2010
 
Emerging Economy May 2009 Indicus Analytics
Emerging Economy May 2009 Indicus AnalyticsEmerging Economy May 2009 Indicus Analytics
Emerging Economy May 2009 Indicus Analytics
 
Monthly Economic Update For March 2011
Monthly Economic Update For March 2011Monthly Economic Update For March 2011
Monthly Economic Update For March 2011
 
2015 review economy & market
2015 review   economy & market2015 review   economy & market
2015 review economy & market
 
Economic Indicators for week of August 30-September 3, 2010
Economic Indicators for week of August 30-September 3, 2010Economic Indicators for week of August 30-September 3, 2010
Economic Indicators for week of August 30-September 3, 2010
 
Energy & Commodities - 2010, July/August
Energy & Commodities - 2010, July/AugustEnergy & Commodities - 2010, July/August
Energy & Commodities - 2010, July/August
 
The World This Week - 25 to 29th July, 2016
The World This Week - 25 to 29th July, 2016The World This Week - 25 to 29th July, 2016
The World This Week - 25 to 29th July, 2016
 
Class7
Class7Class7
Class7
 
Mar 10th
Mar 10thMar 10th
Mar 10th
 
May 2013 World Economic Situation and Prospects
May 2013 World Economic Situation and ProspectsMay 2013 World Economic Situation and Prospects
May 2013 World Economic Situation and Prospects
 

More from Jason Fuchs

Interest rates rise on federal student loans for 2018 and 2019
Interest rates rise on federal student loans for 2018 and 2019Interest rates rise on federal student loans for 2018 and 2019
Interest rates rise on federal student loans for 2018 and 2019Jason Fuchs
 
Tax Benefits of Homeownership After Tax Reform
Tax Benefits of Homeownership After Tax ReformTax Benefits of Homeownership After Tax Reform
Tax Benefits of Homeownership After Tax ReformJason Fuchs
 
Have you made any of these financial mistakes?
Have you made any of these financial mistakes? Have you made any of these financial mistakes?
Have you made any of these financial mistakes? Jason Fuchs
 
Pain at the pump why does it cost more to fill your tank
Pain at the pump why does it cost more to fill your tankPain at the pump why does it cost more to fill your tank
Pain at the pump why does it cost more to fill your tankJason Fuchs
 
Interest rates rise on federal student loans for 2018 and 2019
Interest rates rise on federal student loans for 2018 and 2019Interest rates rise on federal student loans for 2018 and 2019
Interest rates rise on federal student loans for 2018 and 2019Jason Fuchs
 
Marriage and money taking a team approach to retirement
Marriage and money taking a team approach to retirementMarriage and money taking a team approach to retirement
Marriage and money taking a team approach to retirementJason Fuchs
 
Buying a Franchise
Buying a FranchiseBuying a Franchise
Buying a FranchiseJason Fuchs
 

More from Jason Fuchs (7)

Interest rates rise on federal student loans for 2018 and 2019
Interest rates rise on federal student loans for 2018 and 2019Interest rates rise on federal student loans for 2018 and 2019
Interest rates rise on federal student loans for 2018 and 2019
 
Tax Benefits of Homeownership After Tax Reform
Tax Benefits of Homeownership After Tax ReformTax Benefits of Homeownership After Tax Reform
Tax Benefits of Homeownership After Tax Reform
 
Have you made any of these financial mistakes?
Have you made any of these financial mistakes? Have you made any of these financial mistakes?
Have you made any of these financial mistakes?
 
Pain at the pump why does it cost more to fill your tank
Pain at the pump why does it cost more to fill your tankPain at the pump why does it cost more to fill your tank
Pain at the pump why does it cost more to fill your tank
 
Interest rates rise on federal student loans for 2018 and 2019
Interest rates rise on federal student loans for 2018 and 2019Interest rates rise on federal student loans for 2018 and 2019
Interest rates rise on federal student loans for 2018 and 2019
 
Marriage and money taking a team approach to retirement
Marriage and money taking a team approach to retirementMarriage and money taking a team approach to retirement
Marriage and money taking a team approach to retirement
 
Buying a Franchise
Buying a FranchiseBuying a Franchise
Buying a Franchise
 

Recently uploaded

Shots fired Budget Presentation.pdf12312
Shots fired Budget Presentation.pdf12312Shots fired Budget Presentation.pdf12312
Shots fired Budget Presentation.pdf12312LR1709MUSIC
 
10 Influential Leaders Defining the Future of Digital Banking in 2024.pdf
10 Influential Leaders Defining the Future of Digital Banking in 2024.pdf10 Influential Leaders Defining the Future of Digital Banking in 2024.pdf
10 Influential Leaders Defining the Future of Digital Banking in 2024.pdfciolook1
 
Unveiling Falcon Invoice Discounting: Leading the Way as India's Premier Bill...
Unveiling Falcon Invoice Discounting: Leading the Way as India's Premier Bill...Unveiling Falcon Invoice Discounting: Leading the Way as India's Premier Bill...
Unveiling Falcon Invoice Discounting: Leading the Way as India's Premier Bill...Falcon Invoice Discounting
 
2024 May - Clearbit Integration with Hubspot - Greenville HUG.pptx
2024 May - Clearbit Integration with Hubspot  - Greenville HUG.pptx2024 May - Clearbit Integration with Hubspot  - Greenville HUG.pptx
2024 May - Clearbit Integration with Hubspot - Greenville HUG.pptxBoundify
 
Pre Engineered Building Manufacturers Hyderabad.pptx
Pre Engineered  Building Manufacturers Hyderabad.pptxPre Engineered  Building Manufacturers Hyderabad.pptx
Pre Engineered Building Manufacturers Hyderabad.pptxRoofing Contractor
 
Falcon Invoice Discounting: The best investment platform in india for investors
Falcon Invoice Discounting: The best investment platform in india for investorsFalcon Invoice Discounting: The best investment platform in india for investors
Falcon Invoice Discounting: The best investment platform in india for investorsFalcon Invoice Discounting
 
SEO Case Study: How I Increased SEO Traffic & Ranking by 50-60% in 6 Months
SEO Case Study: How I Increased SEO Traffic & Ranking by 50-60%  in 6 MonthsSEO Case Study: How I Increased SEO Traffic & Ranking by 50-60%  in 6 Months
SEO Case Study: How I Increased SEO Traffic & Ranking by 50-60% in 6 MonthsIndeedSEO
 
Managerial Accounting 5th Edition by Stacey Whitecotton test bank.docx
Managerial Accounting 5th Edition by Stacey Whitecotton test bank.docxManagerial Accounting 5th Edition by Stacey Whitecotton test bank.docx
Managerial Accounting 5th Edition by Stacey Whitecotton test bank.docxssuserf63bd7
 
JIND CALL GIRL ❤ 8272964427❤ CALL GIRLS IN JIND ESCORTS SERVICE PROVIDE
JIND CALL GIRL ❤ 8272964427❤ CALL GIRLS IN JIND ESCORTS SERVICE PROVIDEJIND CALL GIRL ❤ 8272964427❤ CALL GIRLS IN JIND ESCORTS SERVICE PROVIDE
JIND CALL GIRL ❤ 8272964427❤ CALL GIRLS IN JIND ESCORTS SERVICE PROVIDEkajalroy875762
 
Top Quality adbb 5cl-a-d-b Best precursor raw material
Top Quality adbb 5cl-a-d-b Best precursor raw materialTop Quality adbb 5cl-a-d-b Best precursor raw material
Top Quality adbb 5cl-a-d-b Best precursor raw materialsunnyly512
 
Marel Q1 2024 Investor Presentation from May 8, 2024
Marel Q1 2024 Investor Presentation from May 8, 2024Marel Q1 2024 Investor Presentation from May 8, 2024
Marel Q1 2024 Investor Presentation from May 8, 2024Marel
 
Progress Report - Oracle's OCI Analyst Summit 2024
Progress Report - Oracle's OCI Analyst Summit 2024Progress Report - Oracle's OCI Analyst Summit 2024
Progress Report - Oracle's OCI Analyst Summit 2024Holger Mueller
 
The Art of Decision-Making: Navigating Complexity and Uncertainty
The Art of Decision-Making: Navigating Complexity and UncertaintyThe Art of Decision-Making: Navigating Complexity and Uncertainty
The Art of Decision-Making: Navigating Complexity and Uncertaintycapivisgroup
 
Abortion pills in Jeddah ! +27737758557, cytotec pill riyadh. Saudi Arabia" A...
Abortion pills in Jeddah ! +27737758557, cytotec pill riyadh. Saudi Arabia" A...Abortion pills in Jeddah ! +27737758557, cytotec pill riyadh. Saudi Arabia" A...
Abortion pills in Jeddah ! +27737758557, cytotec pill riyadh. Saudi Arabia" A...bleessingsbender
 
Arti Languages Pre Seed Teaser Deck 2024.pdf
Arti Languages Pre Seed Teaser Deck 2024.pdfArti Languages Pre Seed Teaser Deck 2024.pdf
Arti Languages Pre Seed Teaser Deck 2024.pdfwill854175
 
Jual obat aborsi Hongkong ( 085657271886 ) Cytote pil telat bulan penggugur k...
Jual obat aborsi Hongkong ( 085657271886 ) Cytote pil telat bulan penggugur k...Jual obat aborsi Hongkong ( 085657271886 ) Cytote pil telat bulan penggugur k...
Jual obat aborsi Hongkong ( 085657271886 ) Cytote pil telat bulan penggugur k...Klinik kandungan
 

Recently uploaded (20)

Shots fired Budget Presentation.pdf12312
Shots fired Budget Presentation.pdf12312Shots fired Budget Presentation.pdf12312
Shots fired Budget Presentation.pdf12312
 
10 Influential Leaders Defining the Future of Digital Banking in 2024.pdf
10 Influential Leaders Defining the Future of Digital Banking in 2024.pdf10 Influential Leaders Defining the Future of Digital Banking in 2024.pdf
10 Influential Leaders Defining the Future of Digital Banking in 2024.pdf
 
HomeRoots Pitch Deck | Investor Insights | April 2024
HomeRoots Pitch Deck | Investor Insights | April 2024HomeRoots Pitch Deck | Investor Insights | April 2024
HomeRoots Pitch Deck | Investor Insights | April 2024
 
Unveiling Falcon Invoice Discounting: Leading the Way as India's Premier Bill...
Unveiling Falcon Invoice Discounting: Leading the Way as India's Premier Bill...Unveiling Falcon Invoice Discounting: Leading the Way as India's Premier Bill...
Unveiling Falcon Invoice Discounting: Leading the Way as India's Premier Bill...
 
2024 May - Clearbit Integration with Hubspot - Greenville HUG.pptx
2024 May - Clearbit Integration with Hubspot  - Greenville HUG.pptx2024 May - Clearbit Integration with Hubspot  - Greenville HUG.pptx
2024 May - Clearbit Integration with Hubspot - Greenville HUG.pptx
 
Pre Engineered Building Manufacturers Hyderabad.pptx
Pre Engineered  Building Manufacturers Hyderabad.pptxPre Engineered  Building Manufacturers Hyderabad.pptx
Pre Engineered Building Manufacturers Hyderabad.pptx
 
Home Furnishings Ecommerce Platform Short Pitch 2024
Home Furnishings Ecommerce Platform Short Pitch 2024Home Furnishings Ecommerce Platform Short Pitch 2024
Home Furnishings Ecommerce Platform Short Pitch 2024
 
Falcon Invoice Discounting: The best investment platform in india for investors
Falcon Invoice Discounting: The best investment platform in india for investorsFalcon Invoice Discounting: The best investment platform in india for investors
Falcon Invoice Discounting: The best investment platform in india for investors
 
SEO Case Study: How I Increased SEO Traffic & Ranking by 50-60% in 6 Months
SEO Case Study: How I Increased SEO Traffic & Ranking by 50-60%  in 6 MonthsSEO Case Study: How I Increased SEO Traffic & Ranking by 50-60%  in 6 Months
SEO Case Study: How I Increased SEO Traffic & Ranking by 50-60% in 6 Months
 
Contact +971581248768 for 100% original and safe abortion pills available for...
Contact +971581248768 for 100% original and safe abortion pills available for...Contact +971581248768 for 100% original and safe abortion pills available for...
Contact +971581248768 for 100% original and safe abortion pills available for...
 
Managerial Accounting 5th Edition by Stacey Whitecotton test bank.docx
Managerial Accounting 5th Edition by Stacey Whitecotton test bank.docxManagerial Accounting 5th Edition by Stacey Whitecotton test bank.docx
Managerial Accounting 5th Edition by Stacey Whitecotton test bank.docx
 
JIND CALL GIRL ❤ 8272964427❤ CALL GIRLS IN JIND ESCORTS SERVICE PROVIDE
JIND CALL GIRL ❤ 8272964427❤ CALL GIRLS IN JIND ESCORTS SERVICE PROVIDEJIND CALL GIRL ❤ 8272964427❤ CALL GIRLS IN JIND ESCORTS SERVICE PROVIDE
JIND CALL GIRL ❤ 8272964427❤ CALL GIRLS IN JIND ESCORTS SERVICE PROVIDE
 
Top Quality adbb 5cl-a-d-b Best precursor raw material
Top Quality adbb 5cl-a-d-b Best precursor raw materialTop Quality adbb 5cl-a-d-b Best precursor raw material
Top Quality adbb 5cl-a-d-b Best precursor raw material
 
Marel Q1 2024 Investor Presentation from May 8, 2024
Marel Q1 2024 Investor Presentation from May 8, 2024Marel Q1 2024 Investor Presentation from May 8, 2024
Marel Q1 2024 Investor Presentation from May 8, 2024
 
Progress Report - Oracle's OCI Analyst Summit 2024
Progress Report - Oracle's OCI Analyst Summit 2024Progress Report - Oracle's OCI Analyst Summit 2024
Progress Report - Oracle's OCI Analyst Summit 2024
 
The Art of Decision-Making: Navigating Complexity and Uncertainty
The Art of Decision-Making: Navigating Complexity and UncertaintyThe Art of Decision-Making: Navigating Complexity and Uncertainty
The Art of Decision-Making: Navigating Complexity and Uncertainty
 
Abortion pills in Jeddah ! +27737758557, cytotec pill riyadh. Saudi Arabia" A...
Abortion pills in Jeddah ! +27737758557, cytotec pill riyadh. Saudi Arabia" A...Abortion pills in Jeddah ! +27737758557, cytotec pill riyadh. Saudi Arabia" A...
Abortion pills in Jeddah ! +27737758557, cytotec pill riyadh. Saudi Arabia" A...
 
Arti Languages Pre Seed Teaser Deck 2024.pdf
Arti Languages Pre Seed Teaser Deck 2024.pdfArti Languages Pre Seed Teaser Deck 2024.pdf
Arti Languages Pre Seed Teaser Deck 2024.pdf
 
Jual obat aborsi Hongkong ( 085657271886 ) Cytote pil telat bulan penggugur k...
Jual obat aborsi Hongkong ( 085657271886 ) Cytote pil telat bulan penggugur k...Jual obat aborsi Hongkong ( 085657271886 ) Cytote pil telat bulan penggugur k...
Jual obat aborsi Hongkong ( 085657271886 ) Cytote pil telat bulan penggugur k...
 
Buy gmail accounts.pdf buy Old Gmail Accounts
Buy gmail accounts.pdf buy Old Gmail AccountsBuy gmail accounts.pdf buy Old Gmail Accounts
Buy gmail accounts.pdf buy Old Gmail Accounts
 

Market Month: July 2018

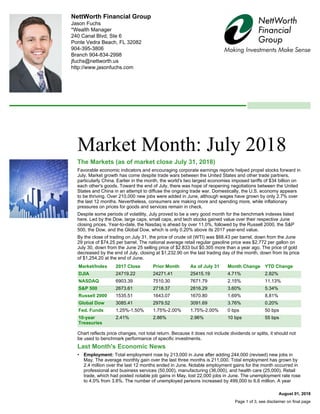
  • 1. NettWorth Financial Group Jason Fuchs *Wealth Manager 240 Canal Blvd, Ste 6 Ponte Vedra Beach, FL 32082 904-395-3806 Branch 904-834-2998 jfuchs@nettworth.us http://www.jasonfuchs.com Market Month: July 2018 August 01, 2018 The Markets (as of market close July 31, 2018) Favorable economic indicators and encouraging corporate earnings reports helped propel stocks forward in July. Market growth has come despite trade wars between the United States and other trade partners, particularly China. Earlier in the month, the world's two largest economies imposed tariffs of $34 billion on each other's goods. Toward the end of July, there was hope of reopening negotiations between the United States and China in an attempt to diffuse the ongoing trade war. Domestically, the U.S. economy appears to be thriving. Over 210,000 new jobs were added in June, although wages have grown by only 2.7% over the last 12 months. Nevertheless, consumers are making more and spending more, while inflationary pressures on prices for goods and services remain in check. Despite some periods of volatility, July proved to be a very good month for the benchmark indexes listed here. Led by the Dow, large caps, small caps, and tech stocks gained value over their respective June closing prices. Year-to-date, the Nasdaq is ahead by over 11.0%, followed by the Russell 2000, the S&P 500, the Dow, and the Global Dow, which is only 0.20% above its 2017 year-end value. By the close of trading on July 31, the price of crude oil (WTI) was $68.43 per barrel, down from the June 29 price of $74.25 per barrel. The national average retail regular gasoline price was $2.772 per gallon on July 30, down from the June 25 selling price of $2.833 but $0.305 more than a year ago. The price of gold decreased by the end of July, closing at $1,232.90 on the last trading day of the month, down from its price of $1,254.20 at the end of June. Market/Index 2017 Close Prior Month As of July 31 Month Change YTD Change DJIA 24719.22 24271.41 25415.19 4.71% 2.82% NASDAQ 6903.39 7510.30 7671.79 2.15% 11.13% S&P 500 2673.61 2718.37 2816.29 3.60% 5.34% Russell 2000 1535.51 1643.07 1670.80 1.69% 8.81% Global Dow 3085.41 2979.52 3091.69 3.76% 0.20% Fed. Funds 1.25%-1.50% 1.75%-2.00% 1.75%-2.00% 0 bps 50 bps 10-year Treasuries 2.41% 2.86% 2.96% 10 bps 55 bps Chart reflects price changes, not total return. Because it does not include dividends or splits, it should not be used to benchmark performance of specific investments. Last Month's Economic News • Employment: Total employment rose by 213,000 in June after adding 244,000 (revised) new jobs in May. The average monthly gain over the last three months is 211,000. Total employment has grown by 2.4 million over the last 12 months ended in June. Notable employment gains for the month occurred in professional and business services (50,000), manufacturing (36,000), and health care (25,000). Retail trade, which had posted notable job gains in May, lost 22,000 jobs in June. The unemployment rate rose to 4.0% from 3.8%. The number of unemployed persons increased by 499,000 to 6.6 million. A year Page 1 of 3, see disclaimer on final page
  • 2. earlier, the jobless rate was 4.3% and the number of unemployed persons was 7.0 million. The labor participation rate edged up 0.2 percentage point over the month to 62.9%. The employment-population ratio held at 60.4%. The average workweek was unchanged at 34.5 hours for the month. Average hourly earnings increased by $0.05 to $26.98. Over the last 12 months, average hourly earnings have risen $0.72, or 2.7%. • FOMC/interest rates: The Federal Open Market Committee does not conclude its next meeting until August 1. It is possible that interest rates will remain the same following this meeting. However, unless economic circumstances change dramatically over the next several months, it is likely that rates will be increased twice more before the end of 2018. • GDP/budget: The second-quarter gross domestic product showed the economy expanded at an annual rate of 4.1%, according to the Bureau of Economic Analysis. The first-quarter GDP grew at an annualized rate of 2.2%. According to the report, consumer spending (personal consumption expenditures) surged, expanding at a rate of 4.0%. Net exports expanded by 9.3%. This is the first, or advance, estimate for the second quarter GDP. The next estimates, in August and September, will include more complete economic data. With only three months remaining in the fiscal year, the government budget deficit sits at $607.1 billion through June 30. Over the same period last year, the budget deficit was $523.1 billion — a difference of about 16%. • Inflation/consumer spending: Consumer spending, as measured by personal consumption expenditures, jumped 0.4% in June after climbing 0.5% (revised) in May. Core consumer prices, a tracker of inflationary trends, increased 0.1% in June. Core prices have increased 1.9% over the last 12 months. • The Consumer Price Index rose 0.1% in June after increasing 0.2% in May. Over the last 12 months ended in June, consumer prices are up 2.9% — the largest 12-month increase since the period ended February 2012. Core prices, which exclude food and energy, climbed 0.2% for the month, and are up 2.3% for the year. • The Producer Price Index showed the prices companies receive for goods and services climbed 0.3% following a 0.5% jump in May. Producer prices have increased 3.4% over the 12 months ended in June, which is the largest 12-month increase since climbing 3.7% in November 2011. Prices less food and energy increased 0.3% for June and are up 2.7% over the last 12 months. Prices for services moved up 0.4% in June. • Housing: Sales of existing homes continued to slow in June. Total existing-home sales fell 0.6% for the month after dropping 0.4% in May. Year-over-year, existing home sales are down 2.2%. The June median price for existing homes was $276,900, which is 5.2% higher than the June 2017 price of $263,300. Inventory for all types of existing homes for sale rose 4.3% in June — 0.5% above a year ago. New home sales regressed in June after climbing 6.7% in May. The median sales price of new houses sold in June was $302,100 ($313,000 in May). The average sales price was $363,300 ($368,500 in May). Inventory rose slightly in June to 5.7 months, up from the 5.2-month supply in May. • Manufacturing: Industrial production advanced 0.6% in June after edging down 0.1% in May. For the second quarter as a whole, industrial production advanced at an annual rate of 6.0% — its third consecutive quarterly increase. Manufacturing output increased 0.8% following a 0.7% drop in May. The index for mining rose 1.2%, its fifth consecutive month of growth. The output of utilities fell 1.5%. Capacity utilization, which estimates the potential for sustainable output for total industrial production, rose 0.3 percentage point for the month, and is up 1.5% over the last 12 months. New orders for manufactured durable goods climbed 1.0% in June following a 0.3% drop in May. • Imports and exports: The advance report on international trade in goods revealed that the trade gap expanded by $3.6 billion in June, or 5.5%, over May. The deficit for June was $68.3 billion (the May deficit was $64.8 billion). June exports of goods fell 1.5%, while imports increased 0.6%. On a seasonally adjusted basis, June's total imports ($210,263 billion) far exceeded exports ($141,931 billion). Prices for imported goods fell 0.4% in June, while export prices rose 0.3%. Over the last twelve months ended in June, import prices are up 4.3%, while export prices have advanced 5.3%. Overall, increasing tariffs don't appear to be a factor in prices, at least for June. • International markets: European stocks got a boost from favorable corporate earnings reports and positive rhetoric emanating from a meeting between President Trump and European Commission President Juncker aimed at reducing reciprocal tariffs between the governing bodies. Japan and the European Union agreed to a free-trade pact that is targeted at reducing tariffs on Japanese automobiles and parts and European foods imported by Japan. The Chinese yuan has lost value compared to the dollar. Speculation is that the Chinese government is allowing its currency to weaken, lowering the cost of Chinese exports around the world, which may help offset the effect of U.S. tariffs on Chinese imports. Nevertheless, economic growth in China has slowed as a result of the tariff war with the United States. • Consumer confidence: Consumer confidence, as measured by The Conference Board Consumer Key Dates/Data Releases 8/1: FOMC announcement, PMI Manufacturing Index, ISM Manufacturing Index 8/5: Employment situation, international trade 8/7: JOLTS 8/9: Producer Price Index 8/10: Consumer Price Index, Treasury budget 8/14: Import and export prices 8/15: Retail sales, industrial production 8/16: Housing starts 8/22: Existing home sales 8/23: New home sales 8/24: Durable goods orders 8/28: International trade in goods 8/29: GDP 8/30: Personal income and outlays Page 2 of 3, see disclaimer on final page
  • 3. Prepared by Broadridge Investor Communication Solutions, Inc. Copyright 2018Prepared by Broadridge Investor Communication Solutions, Inc. Copyright 2018 Confidence Index®, gained some positive traction after dipping in June. According to the report, consumers' confidence in the present economic conditions improved, but expectations for future growth were tempered. Eye on the Month Ahead The economy continues to show signs of strengthening despite trade wars, rising interest rates, and a stagnant real estate market. The labor market is expected to maintain its strong pace, while industrial production has been steady. Overall, August should see ongoing economic strengthening. Data sources: Economic: Based on data from U.S. Bureau of Labor Statistics (unemployment, inflation); U.S. Department of Commerce (GDP, corporate profits, retail sales, housing); S&P/Case-Shiller 20-City Composite Index (home prices); Institute for Supply Management (manufacturing/services). Performance: Based on data reported in WSJ Market Data Center (indexes); U.S. Treasury (Treasury yields); U.S. Energy Information Administration/Bloomberg.com Market Data (oil spot price, WTI Cushing, OK); www.goldprice.org (spot gold/silver); Oanda/FX Street (currency exchange rates). News items are based on reports from multiple commonly available international news sources (i.e. wire services) and are independently verified when necessary with secondary sources such as government agencies, corporate press releases, or trade organizations. All information is based on sources deemed reliable, but no warranty or guarantee is made as to its accuracy or completeness. Neither the information nor any opinion expressed herein constitutes a solicitation for the purchase or sale of any securities, and should not be relied on as financial advice. Past performance is no guarantee of future results. All investing involves risk, including the potential loss of principal, and there can be no guarantee that any investing strategy will be successful. The Dow Jones Industrial Average (DJIA) is a price-weighted index composed of 30 widely traded blue-chip U.S. common stocks. The S&P 500 is a market-cap weighted index composed of the common stocks of 500 leading companies in leading industries of the U.S. economy. The NASDAQ Composite Index is a market-value weighted index of all common stocks listed on the NASDAQ stock exchange. The Russell 2000 is a market-cap weighted index composed of 2,000 U.S. small-cap common stocks. The Global Dow is an equally weighted index of 150 widely traded blue-chip common stocks worldwide. The U.S. Dollar Index is a geometrically weighted index of the value of the U.S. dollar relative to six foreign currencies. Market indices listed are unmanaged and are not available for direct investment. *Securities and advisory services offered through FSC Securities Corporation (FSC) member FINRA / SIPC . FSC is separately owned and other entities and/or marketing names, products or services referenced here are independent of FSC. Your Company and/or representative Union does not sponsor or endorse NettWorth. NettWorth Financial Group and FSC Securities Corporation are not affiliated or employed by your Company and/or representative union. This message may contain confidential information and is intended for use only by the addressee(s) named on this transmission. Broadridge Investor Communication Solutions, Inc. does not provide investment, tax, or legal advice. The information presented here is not specific to any individual's personal circumstances. To the extent that this material concerns tax matters, it is not intended or written to be used, and cannot be used, by a taxpayer for the purpose of avoiding penalties that may be imposed by law. Each taxpayer should seek independent advice from a tax professional based on his or her individual circumstances. These materials are provided for general information and educational purposes based upon publicly available information from sources believed to be reliable—we cannot assure the accuracy or completeness of these materials. The information in these materials may change at any time and without notice. Page 3 of 3