2. Intrusion Detection Systems
Manymisuse and anomaly intrusion detection systems
(IDSs) are based oil the general model proposed
l)enning (I 987). This modelis independent of the plat-
form, system vulnerability, and type of intrusion. It
maintains a set of historical profiles for users, matches
an audit record with the appropriate profile, updates
the protih’ whenevernecessary, and reports any anoma-
lies detected. Another ~-omponent, a rule set, is used
for detecting misuse.
Actual systems implement the general model with
different techniques (see l?rank (1994), Mukherjeeet
(199.1) for an overview}. Often statistical methodsare
used to measure how anomalous the behavior is, that
is, howdifl’erent e.g. the commandsused are from nor-
real behavior. Such approaches require that the distri-
bution of subjects’ behavior is known. The behavior
can be represented as a rule-b~ed model (Garvey and
l.unt 1991), in terms of predictive pattern generation
(’I’eng et al. 1990}, or using state transition analysis
(Porr~ et ai. 1995). Pattern matching techniques are
then used to determine whether the sequence of events
is part of normal behavior, constitutes an anomaly, or
fits the description of a knownattack.
IDSs also differ in whether they are on-line or off-
line. Off-line IDSsare run periodically and they detect
intrusions after-the-fact based on system logs. On-line
systems are designed to detect intrusions while they
are happening, thereby allowing for quicker interven-
tion. On-line IDSs are computationally very expensive
because they require continuous monitoring. Decisions
need to be madequickly with less data and therefore
they are not as reliable.
Several IDSs that employneural networks for on-line
intrusion detection have been proposed (Debar et al.
1992: Fox et al. 1990). These systems learn to pre-
dict the next commandbased on a sequence of previ-
ous commandsby a specific user. Through a shifting
window, the network receives the w most recent com-
mands,as its input. Thenetwork is recurrent, that is,
part of the output is fed back as the input for the next
step: thus, the network is constantly observing the new
trend and "forgets" old behavior over time. The size
of Ihe windowis an important parameter: If w is too
small, there will be manyfalse positives; if it is too
big, the network maynot generalize well to novel se-
quences. The most recent of such systems (Debar et al.
1992) can predict the next commandcorrectly around
80¢~. of the time, and accept a commandas predictable
(among the three most likely next commands)90%
t het ime.
Oneproblem with the on-line approach is that most
of the effort goes into predicting the order of com-
mands. In many ca.ses, the order does not matter
much. but the distribution of commandsthat are used
is revealing. Apossibly etfective approachcould there-
fore be to collect statistics about the users’ command
usage over a period of time, such ,as a day, and try to
recognize the distribution of commandsas legitimate or
anomalous off-line. This is the idea behind the NNID
system.
The NNID System
The NNIDanomaly intrusion detection system is based
on identifying a legitimate user based on the distribu-
tion of commandsshe or he executes. This is justifiable
because different users tend to exhibit different behav-
ior, depending on their needs of the system. Someuse
the system to send and receive e-mail only, and do not
require services such as programmingand compilation.
Someengage in all kinds of activities including editing,
programming, e-mail, Webbrowsing, and so on. How-
ever, even two users that do the same thing may not
use the same application program. For example, some
may prefer the "vi" editor to "emacs", favor "pine"
over "elm" as their mail utility program, or use "gcc"
moreoften than "cc" to compile C programs. Also, tile
frequency with which a commandis used varies from
user to user. The set of commands used and their
frequency, therefore, constitutes a ’print’ of the user,
reflecting the task performed and the choice of appli-
cation programs, and it should be possible to identify
the user based on this information.
It should be noted that this approach works even if
someusers have aliases set up as shorthands for long
commandsthey use frequently, because the audit log
records the actual commandsexecuted by the system.
Users’ privacy is not violated, since the argumentsto a
commanddo not need to be recorded. That is, we may
knowthat a user sends e-mail five times a day, but we
do not need to know to whomthe mail is addressed.
Building NNIDfor a particular computer system
consists of the following three phases:
1. Collecting training data: Obtain the audit logs for
each user for a period of several days. For each day
and user, form a vector that represents how often
the user executed each command.
2. Training: Train the neural network to identify the
user based on these commanddistribution vectors.
3. Performance: Let the network identify the user for
each new commanddistribution vector. If the net-
work’s suggestion is different from the actual user,
or if the network does not have a clear suggestion,
signal an anomaly.
The particular implementation of NNIDand the envi-
ronment where it was tested is described in the next
section.
Experiments
The NNIDsystem was built and tested on a machine
that serves a particular research group at the Depart-
ment of Electrical and Computer Engineering at tile
University of Texas at Austin. This machine has 10
total users; someare regular users, with several other
73
3. as awk bc bibtex calendar cat chmod comsat c
cut cvs date df diff du dvips egrep eFm
cpp
emacs
expr fgreI~ filter find finger fmt from t tp gcc db
~ostview i~maxe
~
i~zip hostname id if~o.nfi.g tspell ~t
tess ~ore~ lprm ls machine mail make,pr
man mesg metamail dir more movemail mpage mt mv netscape
netstat nm ob~dump perl p~p
ping ps pwd rcp res~ze
rm rsh sea sendmail sort strip stty tml tar
tcsh tee test tgif to tput tr tt
w~ereis
uname vacation
xcalc x~’vi xhostvi virtex w wc xbiff++ xterm
Table 1: The 100 commandsused to describe user behavior. The number of times the user executed ,’a,’h
of these commandsduring the day was recorded, mappedinto a nonlinear scale of 11 intervals, and concatenat~.d
into a 100-dimensional input vector, representing the usage pattern for that user for that day.
users logging in intermittently. This platform was cho-
sen for three reasons:
1. The operating system (NetBSD)provides audit trail
logging for accounting purposes and this option had
been enabled on this system.
2. The number of users and the total number of com-
mands executed per day are on an order of mag-
nitude that is manageable. Thus, the feasibility of
the approach could be tested with real-world data
without getting into scalability issues.
3. The system is relatively unknownto outsiders and
the users are all knownto us, so that it is likely
that the data collected on it consists of normal user
behavior (free of intrusions).
Data was collected on this system for 12 days, re-
sulting in 89 user-days. Instead of trying to optimize
the selection of features (commands)for the input,
we decided to simply use a set of 100 most common
commandsin the logs (listed in Table 1), and let the
network figure out what information was important
and what superfluous. Intelligent selection of features
might improve the results some but the current ap-
proach is easy to implement and proves the point.
In order to introduce more overlap between input
vectors, and therefore better generalization, the num-
ber of times a commandwas used was divided into in-
tervals. There were 11 intervals, non-linearly spaced,
so that the representation is more accurate at lower
frequencies where it is most important. The first in-
terval meant the commandwas never used; the second
that it was used once or twice, and so on until the
last interval where the commandwas used more than
500 times. The intervals were represented by values
from 0.0 to 1.0 in 0.1 increments. These values, one
for each command,were then concatenated into a 100-
dimensional commanddistribution vector (also called
user vector below) to be used as input to the ,leural
network.
The standard three-layer backpropagation architec-
ture was chosen for the neural network. The idea was
to get results on the most standard and general ar-
chitecture so that the feasibility of the approachcould
be demonstrated and the results wouldbe easily repli-
cable. Moresophisticated architectures could be used
and they wouldprobablylead to slightly better result s.
Theinput layer consisted of 100 units, representing ~h,,
user vector; the hidden layer had 30 units and the or,t-
put layer 10 units, one for each user. Thenetwork was
implemented in the PlaNet Neural Network sinmlat,,r
(Miyata 1991).
Results
To avoid overtraining, several training sessions were
run prior to the actual experiments to see how many
training cycles would give the highest performa,wc.
The network was trained on 8 randomly chosen days of
data (65 user vectors), and its performance was tested
on the remaining 3 days (24 vectors) after epochs :10.
50, 100, 200, and 300, of which 100 gave the best per-
formance. Four splits of the data into training aml
testing sets were created by randomly picking 8 days
for training.
Theresulting four networkswere tested in two t,~sks:
1. Identifying the user vectors of the remaining 3 days.
If the activation of the output unit representing
the correct user was higher than those of all other
units, and also higher than 0.5, the identification was
counted as correct. Otherwise, a false positive was
counted.
2. Identifying 100 randomly-generated user vectors. If
all output units had an activation less than 0.5. the
networkwastaken to correctly identify the vector as
an anomaly (i.e. not any of the knownusers in the
system). Otherwise, the most highly active outp~,t
unit identifies the network’s suggestion. Since all
intrusions occur under one of the 10 user accounts.
there is a 1/10 chance that the suggestion would
accidentally match the compromised user accol,nt
and the intrusion would not be detected. Therefore.
1/10 of all such cases were countedas false negatiw,s.
Thesecond test is a suggestive measure of the accu-
racy of the system. It is not possible to comeup wit h
vectors that would represent a good sampling of actual
intrusions; the idea here wasto generate vectors where
the values for each command were randomly drawn
from the distribution of values for that commandi,l
the entire data set. In other words, the randomtest
74
4. - ’ 3 4 b / U J
OJtPut.
) " 2 3 4 5 6 7 8
O.Itl~t
¯ I02tl~t
Im .... I
OJt~t
J. ¯ ....
)3~3435703
02L~L
I
3.23456783
OJt~t
..... Imoe
Output
0 t 2 34 56 ? 89
Ill ...... ¯ ’1
OUtput
, , ¯ ¯
0 L ..2 " 4 ~ I~ 7 ~
O~tp~t
0 J. 2 3 4 5 6 7 8 9
Output
........ Il
V "1 ~’ 0 4 ~3 b ¯ t; ~1
Oul~ut
I. .m- ¯
0 1 2 3 4 5 6 7 E 9
OL*rut
¯ . . o . ¯ ....
0 1 2 ~ 4. 5 6 ¯ E ~J
OubFut
Ou~,FUt
0 1 P. 3 4 ~ U ¯ IE ~]
Out,l-Ul.
¯ ¯ ¯
. .
0 £ 2 3 45 6 7 E S
Out.put
O~pu~
1.....I( 12 3 ~- 5 6 7 8
O~pu:
C 1 2 5 c ~ ~ 7 Y
O,.~,pu;
t...... o . .
C 1 2 ~ s ~ 6 / 8 9
Out.pu~,
........
II1
Oubpu,
t.......
¢ I 2 3 ,- 5 6 ?’ 8 9
Output,
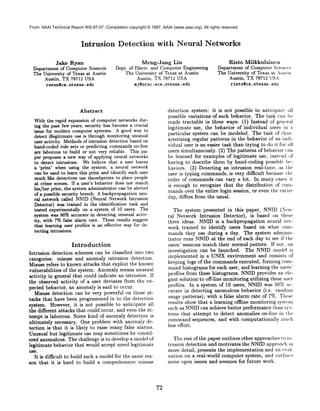
Figure 1 : User identification with the NNIDNetwork.The output layer of NNIDis shownfor each of the 24 test
vectorsia oneof the.! splits tested. Theoutputunits are lined upfromleft to right, andtheir activations are represented
h.v lhe size of Chesquares.In this split there weretwofalse alarms:oneis displayedin the top right withactivation 0.01,
amloucill the seco,d rowfromlhc bottom, secondcolumnfromthe left with 0.35. All the othertest vectorsare identified
c:orrectl.v wi(hnctivationhigherthan0.5.
75
5. vectors had the samefirst-order statistics as the legit-
imate user vectors, but had no higher-order correla-
tions. Therefore they constitute a neutral but realistic
sample of unusual behavior.
All four splits led to similar results. Onaverage,
the networks rejected 63%of the randomuser vectors,
leading to an anomaly detection rate of 96%. They
correctly identified the legitimate user vectors 93%of
the time, giving a false alarm rate of 7%.
Figure 1 shows the output of the network for one
of the splits. Out of 24 legitimate user vectors, the
network identified 22. Most of the time the correct
output unit is very highly activated, indicating high
certainty of identification. However,the activation of
the highest unit was below 0.5 for two of the inputs,
resulting in a false alarm.
Interestingly, in all false alarms in all splits, the
falsely-accused user was always the same. A closer
look at the data set revealed that there were only 3
days of data on this user. He used the system very
infrequently, and the network could not learn a proper
profile for him. While it would be easy to fix this
problem by collecting more data in this case, webe-
lieve this is a problem that wouldbe difficult to rule
out in general. Nomatter howmuchdata one collects,
there maystill not be enoughfor someextremely infre-
quent user. Therefore, webelieve the results obtained
in this rather small data set give a realistic picture of
the performance of the NNIDsystem.
Discussion and Future Work
An important question is, how well does the perfor-
mance of NNIDscale with the number of users? Al-
though there are many computer systems that have
no more than a dozen users, most intrusions occur
in larger systems with hundreds of users. With more
users, the network would have to makefiner distinc-
tions, and it would be difficult to maintain the same
low level of false alarms. However,the rate of detect-
ing anomalies may not change much, as long as the
network has learned the patterns of the actual users
well. Anyactivity that differs from the user’s normal
behavior would still be detected as an anomaly.
Training the network to represent manymore users
may take longer and require a larger network, but it
should be possible because the user profiles share a lot
of commonstructure, and neural networks in general
are good at learning such data. Optimizing the set of
commandsincluded in the user vector, and the size of
the value intervals, might also have a large impact on
performance. It would be interesting to determine the
curve of performance versus the numberof users, and
also see howthe size of the input vector and the gran-
ularity of the value intervals affect that curve. This is
the most important direction of future work.
Another important issue is, howmuchdoes a user’s
behavior change over time? If behavior changes dra-
matically, NNIDmust be recalibrated often or the
numberof false positives would increase. Fortunately
such retraining is easy to do. Since NNIDparses daily
activity of each user into a user-vector, the user profile
can be updated daily. NNIDcould then be retraitwd
periodically. In the current system it takes only about
90 seconds and would not be a great burden on th,,
system.
Conclusion
Experimental evaluation on real-world data shows that
NNIDcan learn to identify users simply by what com-
mandsthey use and howoften, and such an ident ifi~’a-
tion can be used to detect intrusions in a network com-
puter system. The order of commandsdoes not lw~,,l
to be taken into account. NNIDis easy to train aml
inexpensive to run because it operates off-line on daily
logs. As long as real-time detection is not required,
NNIDconstitutes a promising, practical approach ~o
anomaly intrusion detection.
Acknowledgements
Special thanks to Mike Dahlin and TomZiaja for feed-
back on an earlier version of this paper, and to Jim
Bednar for help with the PlaNet simulator. This re-
search was supported in part by DOD-ARPAcon-
tract F30602-96-1-0313, NSFgrant IRI-9504317, and
the Texas Higher Education Coordinating board grant
ARP-444.
References
Debar, H., Becker, M., and Siboni, D. (1992). A neural
network componentfor an intrusion detection sys-
tem. In Proceedings of the 1992 IEEE Computer
Society Symposiumon Research in Computer .~’~-
curity and Privacy, 240-250.
Denning, D. E. (1987). Anintrusion detection model.
IEEE Transactions on Software Engineering, SE-
13:222-232.
Fox, K. L., Henning,l:t. 1~., l~eed, J. H., and Simonian.
R. (1990). A neural network approach towards in-
trusion detection. In Proceedings of the 13th ,V~l-
tional Computer Security Conference, 125-134.
Frank, J. (1994). Artificial intelligence and intrusion
detection: Current and future directions. In Pro-
ceedings of the National 17th ComputerSec~lrttt/
Conference.
Garvey, T. D., and Lunt, T. F. (1991). Model-based
intrusion detection. In Proceedingsof the 14th .V,t-
tional Computer Security Conference.
Miyata, Y. (1991). A User’s Guide to PlaNet t; r-
sion 5.6 - A Tool for Constructing, Running, mtd
Looking in to a PDP Network. Computer Sci-
ence Department, University of Colorado, Boul-
der, Boulder, CO.
76
6. .Mukherjee, B., Ileberlein, L. T., and Levitt, K. N.
(199,1). Network intrusion detection. IEEENet-
work.26-.i 1.
Porr~, P. A.. llgun, K., and Kemmerer,R. A. (1998).
State transition analysis: A rule-based intrusion
detection approach. IEEETransactions on Soft-
ware Engineering, SE-21:181-199.
Teng, II. S., Chen. K., and Lu, S. C. (1990). Adap-
tive real-! ime anomalydetection using inductively
generated sequential patterns. In Proceedings of
th~ 1990 IEEE Srlmposimn on Research m Com-
Imtcr ,’,’~curzt~l andPrlvactI, 278-284.
77