Effect of Calcination and Sintering Temperatures on Physical.pptx
Jackie_Poster
1. Jackie
Nguyen,
Aus0n
Fox,
Brady
J.
Gibbons
Sintering
of
BNKT
Ceramics:
Effect
of
Na,
K,
and
Bi
Content
on
Densifica;on
Kine;cs
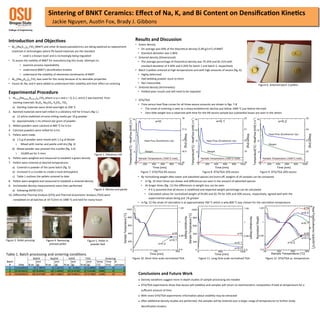
Introduc;on
and
Objec;ves
• Bi0.5(NaxK1-‐x)0.5TiO3
(BNKT)
and
other
Bi-‐based
piezoelectrics
are
being
explored
as
replacement
materials
in
technologies
where
Pb-‐based
materials
are
the
standard
• Lead
is
a
known
toxin
and
is
increasingly
being
regulated
• To
assess
the
viability
of
BNKT
for
manufacturing
this
study
aOempts
to:
• examine
process
repeatability
• understand
BNKT’s
densifica0on
kine0cs
• understand
the
vola0lity
of
elemental
cons0tuents
of
BNKT
• Bi0.5(Na0.8K0.2)0.5TiO3
was
used
for
this
study
because
of
its
desirable
proper0es
• Excess
Bi,
Na,
and
K
were
added
to
understand
their
vola0lity
and
their
effect
on
sintering
Conclusions
and
Future
Work
● Density
varia0ons
suggest
more
in
depth
studies
of
sample
processing
are
needed
● DTA/TGA
experiments
show
that
excess
will
vola0lize
and
samples
will
return
to
stoichiometric
composi0on
if
held
at
temperature
for
a
sufficient
amount
of
0me
● With
more
DTA/TGA
experiments
informa0on
about
vola0lity
may
be
extracted
● Aer
addi0onal
density
studies
are
performed,
the
samples
will
be
sintered
over
a
larger
range
of
temperatures
to
further
study
densifica0on
kine0cs
Results
and
Discussion
• Green
density
• On
average
was
69%
of
the
theore0cal
density
(5.89
g/cm3)
of
BNKT
• Standard
devia0on
was
2.86%
• Sintered
density
(Dimensional)
• The
average
percentage
of
theore0cal
density
was
79.35%
and
81.51%
with
standard
devia0on
of
4.40%
and
4.26%
for
batch
1
and
batch
2,
respec0vely
• Batch
3
pellets
sintered
at
high
temperatures
and
with
high
amounts
of
excess
(fig.
6):
• Highly
deformed
• Had
bedding
powder
stuck
to
them
• Not
measurable
• Sintered
density
(Archimedes)
• Yielded
poor
results
and
will
need
to
be
repeated
• DTA/TGA
• Time
versus
heat
flow
curves
for
all
three
excess
amounts
are
shown
in
figs.
7-‐8
• The
onset
of
sintering
is
seen
as
a
sharp
endothermic
decline
just
below
1000
°C
just
before
the
hold
• Very
liOle
weight
loss
is
observed
with
0me
for
the
0%
excess
sample
but
substan0al
losses
are
seen
in
the
others
• By
normalizing
weight
aer
water
and
adsorbed
species
are
burnt
off,
weights
of
all
samples
can
be
compared
• In
fig.
10
short
0mes
are
shown
and
differences
are
seen
in
the
amount
of
adsorbed
species
• At
longer
0mes
(fig.
11)
the
differences
in
weight
loss
can
be
seen
• If
it
is
assumed
that
all
excess
is
vola0lized
and
expected
weight
percentage
can
be
calculated
• Calculated
values
for
normalized
weight
of
93.8%
and
92.7%
for
10%
and
20%
excess,
respec0vely,
agreed
well
with
the
experimental
values
being
just
1%
greater
• In
fig.
12
the
onset
of
calcina0on
is
at
approximately
700
°C
which
is
why
800
°C
was
chosen
for
the
calcina0on
temperature
Experimental
Procedure
1. Bi0.5+x(Na0.80+yK0.20+z)0.5TiO3
where
x=y=z
and
x
=
0,
0.1,
and
0.2
was
batched
from
star0ng
materials:
Bi2O3,
Na2CO3,
K2CO3,
TiO2
a) Star0ng
materials
were
dried
overnight
at
200
°C
2. Batched
materials
were
ball
milled
in
a
vibratory
mill
for
6
hours
(fig
1.)
a) 12
yiOria-‐stabilized
zirconia
milling
media
per
10
g
powder
b) Approximately
1
mL
ethanol
per
gram
of
powder
3. Milled
powders
were
calcined
at
800
°C
for
6
hrs
4. Calcined
powders
were
milled
for
6
hrs
5. Pellets
were
made
a) 1.5
g
of
powder
were
mixed
with
1.5
g
of
Binder
i. Mixed
with
mortar
and
pestle
un0l
dry
(fig.
2)
b) Mixed
powder
was
pressed
into
a
pellet
(fig.
3,4)
i. 10,000
psi
for
5
mins
6. Pellets
were
weighed
and
measured
to
establish
a
green
density
7. Pellets
were
sintered
at
desired
temperatures
a) Covered
in
powder
of
the
same
batch
(fig.
5)
b) Enclosed
in
a
crucible
to
create
a
local
atmosphere
c) Table
1
outlines
the
pellets
sintered
to
date
8. Pellets
were
weighed
and
measured
to
establish
a
sintered
density
9. Archimedes
density
measurements
were
then
performed
a) following
ASTM
C373
10. Differen0al
Thermal
Analysis
(DTA)
and
Thermal
Gravimetric
Analysis
(TGA)
were
completed
on
all
batches
at
10
°C/min
to
1000
°C
and
held
for
many
hours
Figure
1.
Vibratory
mill
Figure
2.
Mortar
and
pestle
Figure
3.
Pellet
pressing
Figure
4.
Removing
pressed
pellet
Figure
5.
Pellet
in
powder
bed
Table
1.
Batch
processing
and
sintering
condi0ons
Figure
6.
Sintered
batch
3
pellets
Figure
7.
DTA/TGA
0%
excess
Figure
8.
DTA/TGA
10%
excess
Figure
9.
DTA/TGA
20%
excess
Figure
10.
Short
0me
scale
normalized
TGA
Figure
12.
DTA/TGA
vs.
temperature
Figure
11.
Long
0me
scale
normalized
TGA