Boyle County, Kentucky Employment Report: Q4, 2011
•
0 likes•316 views

This is the Fourth Quarter 2011 employment report for Boyle County, Kentucky, compiled from employment data monitored by the Boyle County Industrial Foundation.

Recommended
Recommended
More Related Content
What's hot
What's hot (19)
Similar to Boyle County, Kentucky Employment Report: Q4, 2011
Similar to Boyle County, Kentucky Employment Report: Q4, 2011 (20)
More from Danville-Boyle County Economic Development Partnership
More from Danville-Boyle County Economic Development Partnership (20)
Recently uploaded
Recently uploaded (20)
Boyle County, Kentucky Employment Report: Q4, 2011
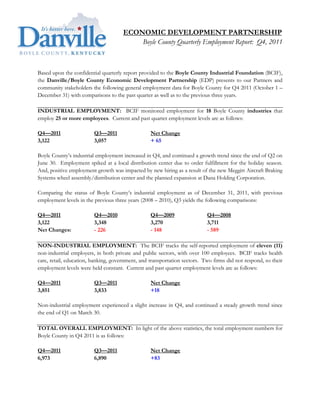
- 1. ECONOMIC DEVELOPMENT PARTNERSHIP Boyle County Quarterly Employment Report: Q4, 2011 Based upon the confidential quarterly report provided to the Boyle County Industrial Foundation (BCIF), the Danville/Boyle County Economic Development Partnership (EDP) presents to our Partners and community stakeholders the following general employment data for Boyle County for Q4 2011 (October 1 – December 31) with comparisons to the past quarter as well as to the previous three years. INDUSTRIAL EMPLOYMENT: BCIF monitored employment for 18 Boyle County industries that employ 25 or more employees. Current and past quarter employment levels are as follows: Q4—2011 Q3—2011 Net Change 3,122 3,057 + 65 Boyle County’s industrial employment increased in Q4, and continued a growth trend since the end of Q2 on June 30. Employment spiked at a local distribution center due to order fulfillment for the holiday season. And, positive employment growth was impacted by new hiring as a result of the new Meggitt Aircraft Braking Systems wheel assembly/distribution center and the planned expansion at Dana Holding Corporation. Comparing the status of Boyle County’s industrial employment as of December 31, 2011, with previous employment levels in the previous three years (2008 – 2010), Q3 yields the following comparisons: Q4—2011 Q4—2010 Q4—2009 Q4—2008 3,122 3,348 3,270 3,711 Net Changes: - 226 - 148 - 589 NON-INDUSTRIAL EMPLOYMENT: The BCIF tracks the self-reported employment of eleven (11) non-industrial employers, in both private and public sectors, with over 100 employees. BCIF tracks health care, retail, education, banking, government, and transportation sectors. Two firms did not respond, so their employment levels were held constant. Current and past quarter employment levels are as follows: Q4—2011 Q3—2011 Net Change 3,851 3,833 +18 Non-industrial employment experienced a slight increase in Q4, and continued a steady growth trend since the end of Q1 on March 30. TOTAL OVERALL EMPLOYMENT: In light of the above statistics, the total employment numbers for Boyle County in Q4 2011 is as follows: Q4—2011 Q3—2011 Net Change 6,973 6,890 +83
- 2. Boyle County Employment Report: Q4, 2011 Page 2 OVERALL LABOR FORCE STATISTICS: For all sectors of the Boyle County economy, the Kentucky Office of Employment & Training reports the following data for Boyle Countians in the most recent quarters available: Dec ’11 (Q4) Sep ’11 (Q3) Change Employed 11,491 11,397 +94 Unemployed 1,317 1,534 - 217 Unemployment Rate 10.3% 11.9% - 1.6 % A map of unemployment rates for all Kentucky counties for December 2011 may be viewed at: http://www.workforcekentucky.ky.gov/admin/uploadedPublications/1215_December_11_UR.pdf. An annual comparison of unemployment rates reveals the following: Dec ’11 Dec ‘10 Change Unemployment Rate 10.3% 11.8% - 1.5% A map of changes in unemployment rates for all Kentucky counties from December 2010 to December 2011 may be viewed at: http://www.workforcekentucky.ky.gov/admin/uploadedPublications/1216_December_10_to_December_1 1_Change.pdf. Please contact the EDP if you have any questions or have any suggestions about how this quarterly report can be more meaningful to you, your organization, or agency. For more information: Jody A. Lassiter, JD President/CEO Danville/Boyle County Economic Development Partnership (859) 236-2805 jody@betterindanville.com