The document summarizes the 3rd quarter 2018 earnings results of Itaú Unibanco. Key highlights include:
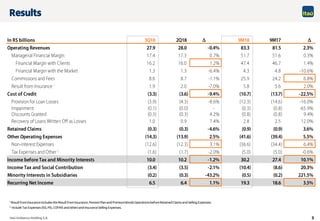
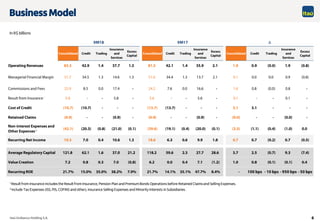
- Recurring net income of R$6.5 billion in Brazil and R$19.3 billion consolidated.
- ROE of 21.3% in Brazil and 21.7% consolidated.
- Non-performing loan ratios of 2.9% in Brazil and 3.5% consolidated.
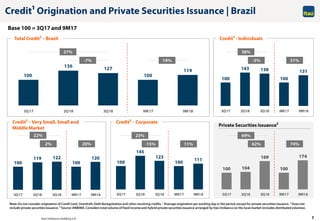
- Digital channels accounted for 18% of credit transactions, 40% of investments, and 74% of payments.