Firstcall claris lifesciences_ltd_30 june15
•
1 like•277 views

Firstcall recommend Claris Lifesciences, 100 ANDAs planned for the US by 2018-19

Recommended
Recommended
More Related Content
What's hot
What's hot (19)
Similar to Firstcall claris lifesciences_ltd_30 june15
Similar to Firstcall claris lifesciences_ltd_30 june15 (20)
More from IndiaNotes.com
More from IndiaNotes.com (20)
Recently uploaded
Recently uploaded (20)
Firstcall claris lifesciences_ltd_30 june15
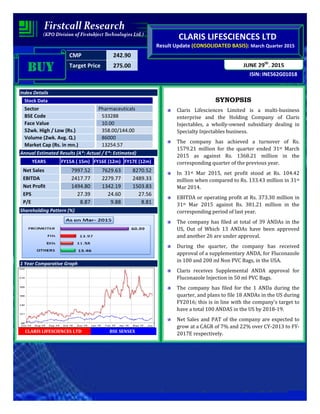
- 1. CMP 242.90 Target Price 275.00 ISIN: INE562G01018 JUNE 29th , 2015 CLARIS LIFESCIENCES LTD Result Update (CONSOLIDATED BASIS): March Quarter 2015 BUYBUYBUYBUY Index Details Stock Data Sector Pharmaceuticals BSE Code 533288 Face Value 10.00 52wk. High / Low (Rs.) 358.00/144.00 Volume (2wk. Avg. Q.) 86000 Market Cap (Rs. in mn.) 13254.57 Annual Estimated Results (A*: Actual / E*: Estimated) YEARS FY15A ( 15m) FY16E (12m) FY17E (12m) Net Sales 7997.52 7629.63 8270.52 EBITDA 2417.77 2279.77 2489.33 Net Profit 1494.80 1342.19 1503.83 EPS 27.39 24.60 27.56 P/E 8.87 9.88 8.81 Shareholding Pattern (%) 1 Year Comparative Graph CLARIS LIFESCIENCES LTD BSE SENSEX SYNOPSIS Claris Lifesciences Limited is a multi-business enterprise and the Holding Company of Claris Injectables, a wholly-owned subsidiary dealing in Specialty Injectables business. The company has achieved a turnover of Rs. 1579.21 million for the quarter ended 31st March 2015 as against Rs. 1368.21 million in the corresponding quarter of the previous year. In 31st Mar 2015, net profit stood at Rs. 104.42 million when compared to Rs. 133.43 million in 31st Mar 2014. EBITDA or operating profit at Rs. 373.30 million in 31st Mar 2015 against Rs. 381.21 million in the corresponding period of last year. The company has filed at total of 39 ANDAs in the US, Out of Which 13 ANDAs have been approved and another 26 are under approval. During the quarter, the company has received approval of a supplementary ANDA, for Fluconazole in 100 and 200 ml Non PVC Bags, in the USA. Claris receives Supplemental ANDA approval for Fluconazole Injection in 50 ml PVC Bags. The company has filed for the 1 ANDa during the quarter, and plans to file 18 ANDAs in the US during FY2016; this is in line with the company’s target to have a total 100 ANDAS in the US by 2018-19. Net Sales and PAT of the company are expected to grow at a CAGR of 7% and 22% over CY-2013 to FY- 2017E respectively.
- 2. QUARTERLY HIGHLIGHTS (CONSOLIDATED BASIS) Results updates- Quarter ended 31st March 2015, Rs. In million Mar-15 Mar-14 % Change Net Sales 1579.21 1368.21 15.42 Net profit 104.42 133.43 (21.74) EPS 1.91 2.09 (8.48) EBITDA 373.30 381.21 (2.07) The company has achieved a turnover of Rs. 1579.21 million for the quarter ended 31st March, 2015 as against Rs. 1368.21 million in the corresponding quarter of the previous year. In the same March quarter, net profit stood at Rs. 104.42 million when compared to Rs. 133.43 million in prior previous year ended. EBITDA or operating profit at Rs. 373.30 million in the March quarter ended 2015 against Rs. 381.21 million in the corresponding period of last year. The company has reported an EPS of Rs. 1.91 for the March quarter as against an EPS of Rs. 2.09 in the corresponding quarter of the previous year. Break up of Expenditure Break up of Expenditure (Rs. In millions) Mar-15 Mar-14 % Chng Cost of Materials Consumed 239.97 176.67 36% Dep & Amortization 89.18 101.84 -12% Employees Benefit Exp 294.23 105.85 178% Other Expenditure 386.18 320.07 21% Purchase of Traded Goods 484.41 672.60 -28%
- 3. Latest Updates • The company has filed at total of 39 ANDAs in the US, Out of Which 13 ANDAs have been approved and another 26 are under approval. The total addressable market size of the 39 ANDAs is approximately US$ 2000 million. • During the quarter, the company has received approval of a supplementary ANDA, for Fluconazole in 100 and 200 ml Non PVC Bags, in the USA and now Claris receives Supplemental ANDA approval for Fluconazole Injection in 50 ml PVC Bags. • The company has filed for the 1 ANDa during the quarter, and plans to file 18 ANDAs in the US during FY2016; this is in line with the company’s target to have a total 100 ANDAS in the US by 2018-19. • On 2nd of April 2015, the Company had reached a settlement an license agreement, ending all pending litigation with Fresenius kabi USA, Inc. with reference to the alleged infringement of a patent relating to proposal for injection, 10 mg/ml, which is a generic version of DIPRIVAN. • Under the terms of the settlement and license Agreement, Claris and Claris Lifisciences Inc. (USA) has been granted approval to sell its generic version of proposal for injection beginning 15th October 2016, prior to the 1st June 2025 expiry of the patent that the basis of the litigation. • EBIDTA margin for the 15 months of this year financial was in line with CY2013 at 30% against 31%. The EBIDTA margins for Q1 CY15 stood at 24% as compared to 28% in the same quarter of previous year. • Year on year is not comparable due to the 15 month financial year; the PAT margins of this financial year (15 months) were higher at 19% than the 13% margins of CY2013. PAT margins for Q1 CY15 stood at 7%. Capacity Expansion and technology up-gradation • The packaging automation at the plant 1 is underway for the SVP and propofol lines; this will result into an online packaging process as well ith limited human intervention as preferred by regulatory authorities and also strive towards higher levels of quality and compliance. • In the line with Good Manufacturing Practice (GMP), ,the company is investing in new and revamping the existing software, Chromeleon, LIMs, Track wise and Training Management Systems will be incorporated at the manufacturing facilities that will gain strive towards higher levels of quality and compliance.
- 4. COMPANY PROFILE Claris Lifesciences Limited is a multi-business enterprise and the Holding Company of Claris Injectables, a wholly-owned subsidiary dealing in Specialty Injectables business, collectively “Claris”; and ‘Claris Otsuka’, a Joint Venture with Japanese Otsuka Pharmaceutical Factory, Inc. & Mitsui & Co. Ltd. for Infusion business in India & emerging markets. Claris manufactures and/or markets products across multiple delivery systems, markets, and therapeutic segments including anesthesia, blood products, anti-infectives, and plasma volume expanders. A significant majority of these products are generic drugs that are capable of being directly injected into the human body, which are predominantly used in the treatment of critical illnesses. The customer base primarily includes government and private hospitals, aid agencies, and nursing homes. With emphasis on quality, technology, and innovation, a range of niche technology-driven injectable products is offered across delivery systems such as glass bottles, vials & ampoules, and non-PVC/PVC bag. Businesses India Market Claris caters across several products and categories in India. The company continuously endeavours to support upgrade of medical care in the country with the introduction of breakthrough new products and technologies. Claris' customer base in India includes institutions, large corporate hospitals and nursing homes. In line with its commitment to the cause of healthcare in the country, the company remains at the forefront to adopt creative initiatives & training methods for staying abreast with the latest industry trends. International Market Claris has a market presence across the globe including Regulated Markets and Emerging Markets. The major focus in Regulated Markets is in countries like USA, UK, Australia, New Zealand, Netherlands, Italy, Germany, Canada, South Africa, Hong Kong, Korea etc., where we have robust sales and distribution network. Claris' long term growth and increased profitability in operations will continue with the year on year increasing contribution from these Regulated Markets. The presence in Emerging Markets include the regions of Asia, Africa, CIS, MEGNA (Middle East, Gulf & North Africa), Russia, and Latin America, where the marketing strategy is to enhance the company's visibility at a global forefront and connect with customers & business associates. One of the critical success factors for manufacturing and marketing pharmaceutical products for international markets is the regulatory approvals of the manufacturing unit which include US FDA, MHRA (UK), TGA (Australia), and GCC FDCA.
- 5. FINANCIAL HIGHLIGHT (CONSOLIDATED BASIS) (A*- Actual, E* -Estimations & Rs. In Millions) Balance Sheet as at Dec 31, 2013 – March 31st, 2017E As on 31- Dec-2013A As on 31- Mar-2015A As on 31 - Mar-2016E As on 31 – Mar-2017E (12m) (15m) (12m) (12m) I. EQUITY AND LIABILITIES: A. Shareholders’ Funds a) Share Capital 638.18 545.68 545.68 545.68 b) Reserves and Surplus 13404.77 12621.41 12419.47 12978.34 Sub-Total-Net worth 14042.95 13167.09 12965.15 13524.02 B. Non-Current Liabilities: a) Long-term borrowings 1268.29 2734.30 3048.74 3249.96 b) Deferred Tax Liabilities [Net] 587.82 96.71 50.29 42.75 c) Other Long Term Liabilities 0.00 0.00 0.00 0.00 d) Long Term Provisions 64.15 100.08 121.10 133.21 Sub-Total-Long term liabilities 1920.26 2931.09 3220.13 3425.91 C. Current Liabilities: a) Short-term borrowings 1054.67 1838.79 2022.67 2156.17 b) Trade Payables 1082.88 1267.85 1381.96 1459.35 c) Other Current Liabilities 2104.50 2532.81 2735.43 2861.26 d) Short Term Provisions 903.92 100.12 42.05 21.87 Sub-Total-Current Liabilities 5145.97 5739.57 6182.11 6498.64 TOTAL-EQUITY AND LIABILITIES (A+B+C) 21109.18 21837.75 22367.39 23448.58 II. ASSETS: D. Non-Current Assets: a) Fixed Assets 7448.31 10770.84 11847.92 12795.76 b) Goodwill on Consolidation 0.32 0.32 0.31 0.30 c) Non Current Investments 2095.01 2023.09 2055.46 2084.24 d) Long Term Loans and Advances 1946.71 203.91 161.09 128.87 Sub-Total-Non-Current Assets 11490.35 12998.16 14064.78 15009.17 E. Current Assets: a) Current Investments 6088.20 3316.13 2025.06 1664.65 b) Inventories 449.74 937.50 1078.13 1164.38 c) Trade Receivables 1565.13 2291.49 2566.47 2746.12 d) Cash and Bank Balances 945.94 825.66 908.23 971.80 e) Short Term Loans and Advances 453.49 1327.73 1566.72 1723.39 f) Other Current Assets 116.33 141.08 158.01 169.07 Sub-Total-Current Assets 9618.83 8839.59 8302.61 8439.41 TOTAL-ASSETS (D+E) 21109.18 21837.75 22367.39 23448.58 Note: To Change the financial year of the Company from January - December to April - March. Accordingly, the Company's current financial year shall be for a period of fifteen months i.e. from January 01, 2014 to March 31, 2015.
- 6. Annual Profit & Loss Statement for the period of CY-2013 to FY-2017E Value(Rs.in.mn) CY13A FY 15A CY16E CY17E Description 12m 15m 12m 12m Net Sales 6677.62 7997.52 7629.63 8270.52 Other Income 405.88 863.04 776.74 818.68 Total Income 7083.50 8860.56 8406.37 9089.20 Expenditure -4983.75 -6442.79 -6126.60 -6599.88 Operating Profit 2099.75 2417.77 2279.77 2489.33 Interest -521.95 -482.60 -448.82 -471.26 Gross profit 1577.80 1935.17 1830.96 2018.07 Depreciation -653.54 -490.48 -392.38 -415.93 Exceptional Items 150.60 0.00 0.00 0.00 Profit Before Tax 1074.86 1444.69 1438.57 1602.14 Tax -220.77 122.03 -51.79 -49.67 Profit After Tax 854.09 1566.72 1386.78 1552.47 Share of Profit & Loss of Asso -9.99 -71.92 -44.59 -50.39 Net Profit 844.10 1494.80 1342.19 1502.09 Equity capital 638.18 545.68 545.68 545.68 Reserves 13404.77 12621.41 12419.47 12978.34 Face value 10.00 10.00 10.00 10.00 EPS 13.23 27.39 24.60 27.53 Quarterly Profit & Loss Statement for the period of 30th Sept, 2014 to 30th June, 2015E Value(Rs.in.mn) 30-Sep-14 31-Dec-14 31-Mar-15 30-Jun-15E Description 3m 3m 3m 3m Net sales 1660.55 1826.05 1579.21 1737.13 Other income 127.94 267.77 137.84 125.43 Total Income 1788.49 2093.82 1717.05 1862.57 Expenditure -1273.06 -1360.35 -1343.75 -1426.18 Operating profit 515.43 733.47 373.30 436.38 Interest -86.07 -113.63 -104.59 -107.73 Gross profit 429.36 619.84 268.71 328.65 Depreciation -106.74 -89.56 -89.18 -90.43 Profit Before Tax 322.62 530.28 179.53 238.22 Tax -98.70 372.70 -54.51 -71.71 Profit After Tax 223.92 902.98 125.02 166.52 Share of Profit & Loss of Asso -20.23 -4.51 -20.60 -10.71 Net Profit 203.69 898.47 104.42 155.81 Equity capital 545.68 545.68 545.68 545.68 Face value 10.00 10.00 10.00 10.00 EPS 3.73 16.47 1.91 2.86
- 7. Ratio Analysis Particulars CY13A (12m) FY15A (15m) FY16E (12m) FY17E (12m) EPS (Rs.) 13.23 27.39 24.60 27.56 EBITDA Margin (%) 31.44% 30.23% 29.88% 30.10% PBT Margin (%) 16.10% 18.06% 18.86% 19.39% PAT Margin (%) 12.79% 19.59% 18.18% 18.79% P/E Ratio (x) 18.36 8.87 9.88 8.81 ROE (%) 6.08% 11.90% 10.70% 11.49% ROCE (%) 17.98% 18.29% 16.69% 17.32% Debt Equity Ratio 0.09 0.21 0.24 0.24 EV/EBITDA (x) 4.64 4.90 5.86 5.57 Book Value (Rs.) 220.05 241.30 237.60 247.84 P/BV 1.10 1.01 1.02 0.98 Charts
- 8. OUTLOOK AND CONCLUSION At the current market price of Rs. 242.90, the stock P/E ratio is at 9.88 x FY16E and 8.81 x FY17E respectively. Earning per share (EPS) of the company for the earnings for FY16E and FY17E is seen at Rs.24.06 and Rs.27.56 respectively. Net Sales and PAT of the company are expected to grow at a CAGR of 7% and 22% over CY-2013 to FY-2017E respectively. On the basis of EV/EBITDA, the stock trades at 5.86 x for FY16E and 5.57 x for FY17E. Price to Book Value of the stock is expected to be at 1.02 x and 0.98 x respectively for FY16E and FY17E. We expect that the company surplus scenario is likely to continue for the next three years, will keep its growth story in the coming quarters also. We recommend ‘BUY’ in this particular scrip with a target price of Rs.275.00 for Medium to Long term investment. INDUSTRY OVERVIEW The Indian pharmaceuticals market is third largest in terms of volume and thirteen largest in terms of value, as per a pharmaceuticals sector analysis report by equity master. The market is dominated majorly by branded generics which constitute nearly 70 to 80 per cent of the market. Considered to be a highly fragmented industry, consolidation has increasingly become an important feature of the Indian pharmaceutical market. The UN-backed Medicines Patents Pool has signed six sub-licences with Aurobindo, Cipla, Desano, Emcure, Hetero Labs and Laurus Labs, allowing them to make generic anti-AIDS medicine Tenofovir Alafenamide (TAF) for 112 developing countries. Market Size The Indian pharmaceutical industry is estimated to grow at 20 per cent compound annual growth rate (CAGR) over the next five years, as per India Ratings, a Fitch Group company. Indian pharmaceutical manufacturing facilities registered with US Food and Drug Administration (FDA) as on March 2014 was the highest at 523 for any country outside the US.Gujarat clocked the highest growth rate in pharmaceuticals market at 22.4 per cent during November 2014, surpassing the industry growth rate, which grew by 10.9 per cent, as per data from the market research firm AIOCD Pharma softtech AWACS. Investments The drugs and pharmaceuticals sector attracted cumulative foreign direct investment (FDI) inflows worth US$ 12,813.02 million between April 2000 and December 2014, according to data released by the Department of Industrial Policy and Promotion (DIPP).
- 9. Some of the major investments in the Indian pharmaceutical sector are as follows: • Stelis Biopharma has announced the ground-breaking for construction of its customised, multi-product, biopharmaceutical manufacturing facility at Bio-Xcell Biotechnology Park in Nusajaya, Johor, Malaysia's park and ecosystem for industrial and healthcare biotechnology at a total project investment amount of US$ 60 million. • Pharma major Strides Arcolab has entered into a licensing agreement with US-based Gilead Sciences Inc to manufacture and distribute the latter's low-cost Tenofovir Alafenamide (TAF) product used for HIV treatment in developing countries. The licence to manufacture Gilead's low-cost drug extends to 112 countries. • Apollo Hospitals Enterprise (AHEL) plans to add another 2,000 beds over the next two financial years, at a cost of around Rs 15000.00 mn (US$ 242.57 million), as per Founder and Executive Chairman, Apollo Hospitals. • CDC, the UK’s development finance institution, has invested US$ 48 million in Narayana Hrudayalaya hospitals, a multi-speciality healthcare provider. With this investment, Narayana Health will expand affordable treatment in eastern, central and western India. • Cadila Healthcare Ltd has announced the launch of a biosimilar for Adalimumab - the world’s largest selling drug for rheumatoid arthritis and other auto immune disorders. The drug will be marketed under the brand name Exemptia at one-fifth of the price for the branded version-Humira. • Torrent Pharmaceuticals has entered into an exclusive licensing agreement with Reliance Life Sciences for marketing three biosimilars in India — Rituximab, Adalimumab and Cetuximab. • Piramal Enterprises Ltd has acquired US-based Coldstream Laboratories for US$ 30.6 million in an all-cash transaction. • Indian Immunologicals Ltd (IIL) plans to set up a new vaccine manufacturing facility in Pondicherry with an investment of Rs 3000.00 mn (US$ 48.53 million). • SRF Ltd has acquired Global DuPont Dymel, the pharmaceutical propellant business of DuPont, for US$ 20 million. Government Initiatives The Government of India has unveiled 'Pharma Vision 2020' aimed at making India a global leader in end-to-end drug manufacture. It has reduced approval time for new facilities to boost investments. Further, the government has also put in place mechanisms such as the Drug Price Control Order and the National Pharmaceutical Pricing Authority to address the issue of affordability and availability of medicines.
- 10. Some of the major initiatives taken by the government to promote the pharmaceutical sector in India are as follows: Indian and global companies have expressed 175 investment intentions worth Rs 10000.00 mn (US$ 161.78 million) in the pharmaceutical sector of Gujarat. The memorandums of understanding (MoUs) would be signed during the Vibrant Gujarat Summit. Telangana has proposed to set up India's largest integrated pharmaceutical city spread over 11,000 acres near Hyderabad, complete with effluent treatment plants and a township for employees, in a bid to attract investment of Rs 300000.00 mn (US$ 4.85 billion) in phases. Hyderabad, which is known as the bulk drug capital of India, accounts for nearly a fifth of India's exports of drugs, which stood at Rs 900000.00 mn (US$ 14.56 billion) in 2013-14. Road Ahead The Indian pharma market size is expected to grow to US$ 85 billion by 2020. The growth in Indian domestic market will be on back of increasing consumer spending, rapid urbanisation, raising healthcare insurance and so on. Going forward, better growth in domestic sales will depend on the ability of companies to align their product portfolio towards chronic therapies for diseases such as such as cardiovascular, anti-diabetes, anti-depressants and anti-cancers are on the rise. Moreover, the government has been taking several cost effective measures in order to bring down healthcare expenses. Thus, governments are focusing on speedy introduction of generic drugs into the market. This too will benefit Indian pharma companies. In addition, the thrust on rural health programmes, life saving drugs and preventive vaccines also augurs well for the pharma companies. Disclaimer: This document is prepared by our research analysts and it does not constitute an offer or solicitation for the purchase or sale of any financial instrument or as an official confirmation of any transaction. The information contained herein is from publicly available data or other sources believed to be reliable but we do not represent that it is accurate or complete and it should not be relied on as such. Firstcall Research or any of its affiliates shall not be in any way responsible for any loss or damage that may arise to any person from any inadvertent error in the information contained in this report. Firstcall Research and/ or its affiliates and/or employees will not be liable for the recipients’ investment decision based on this document.
- 11. Firstcall India Equity Research: Email – info@firstobjectindia.com C.V.S.L.Kameswari Pharma & Diversified U. Janaki Rao Capital Goods B. Anil Kumar Auto, IT & FMCG M. Vinayak Rao Diversified G. Amarender Diversified Firstcall Research Provides Industry Research on all the Sectors and Equity Research on Major Companies forming part of Listed and Unlisted Segments For Further Details Contact: Tel.: 022-2527 2510/2527 6077 / 25276089 Telefax: 022-25276089 040-20000235 /20000233 E-mail: info@firstobjectindia.com www.firstcallresearch.com