SlideShare a Scribd company logo
1 of 4
Download to read offline
1
Entertainment - Electronic Media
Dish TV
Sensex: 27804 CMP:INR105
~3 mn net subscriber addition over FY16-17E
Net subscriber addition for Dish TV is expected to be healthy in
FY16-17E due to implementation of phase 3 & 4 of Digital
Addressable System (DAS). In phase 3 & 4, ~70 mn analog
subscribers will be digitized and DTH players are expected to
garner ~60% of the new digital subscriber. Assuming that DishTV
maintains its market share at 27% of gross additions and annual
churn rate of ~10%, over next two years it will add ~5.5 mn gross
and ~3 mn net subscribers.
ARPU to improve by ~6% in FY16E on back of price hike
Dish TV took two rounds of price hikes in FY15 (~4-6% in Aug'14 &
~4-8% in Feb'15) and also implemented differential pricing in
phase 1 & 2 cities, ~35% of its subscriber base (increase of INR10/
month across packages). This should help ARPU to improve by
~6% in FY16E.
Moderate increase in content cost
Dish TV has locked in its content agreement with most of the
broadcasters till Sept'16 and expects low single digit increase in
content cost for FY16E. Further, DTH though accounts for only 28%
of the distribution channel, it contributes ~60% of the
broadcaster's revenue. Hence, there is scope for rationalization
in content cost going forward.
Margin improvement led by operating leverage
EBIDTA margin should improve going forward due to higher ARPU,
moderate increase in content cost and lower license fee once TRAI
recommendation of 8% of adjusted gross revenue is implemented.
This will lower effective license fee to ~7.5% from current 10% of
gross revenue. EBIDTA margin, post implementation GST and TRAI
recommendation on license fee, should improve to ~35%. Dish TV
currently pays cumulative tax of ~22% (Service tax - 14% and
Entertainment tax -~8%) on its services. Post GST, this should come
down below 20%.
June 24, 2015 Visit Note
Reduction in debt to aid profitability
Dish TV is expected to generate free cash flow of >INR 5000 mn in
next two years, which should help it to reduce its INR 8500 mn
long term debt at the end of FY15 and improve profitability.
How real is the threat from broadband?
With interactive revolution, DTH certainly has a disadvantage as
it is a one way technology and the interactivity that the viewers
want works a lot better with cable or broadband. However, not
everyone has access to a good cable or high speed bandwidth.
Secondly, cost of client acquisition is exorbitant in case of
broadband (~INR 4000/client). On the other hand, DTH is extremely
distributable over vast distances and so for a lot of people DTH
will still be the only way that they can access content. In terms of
audience, DTH continues to expand in India as well as globally. In
India its share is expected to increase from ~27% in 2014E to
~40% in 2019P. Globally its share is expected to increase from
23% in 2014E to 26% in 2020P.
Outlook & Valuation
Strong subscriber addition, increase in ARPU and lower content
cost led Dish TV to report its first net profit in Q4FY15. We believe
that same factors will continue to play in FY16E leading to revenue
growth of ~18% (12% volume growth and 6% price growth) and
EBIDTA margin improvement of 400 bps to 30% aided by lower
content cost. On threat from broadband, we believe that as long
as people continue to prefer linear viewing compared to on-
demand viewing, DTH/cable will continue to grow. For now,
combination of commercial might (60% of broadcaster's
subscription revenue), vast universal broadcast footprints and
commitment to ever improving image quality (4K content), means
that DTH service is here to stay. At CMP of INR 105,it is trading at
16.2x FY15 EV/EBIDTA.
Shareholding % Mar-15
Promoters 64.46
FIIs 24.09
DIIs 3.41
Others 8.04
Relative Price Performance
Key Data
BSE Code 532839
NSE Code DISHTV
Bloomberg Code DITV IN
Reuters Code DSTV.BO
Shares Outstanding (mn) 1065.7
Face Value 1
Mcap (INR bn) 112.8
52 Week H/L 117.25/52.25
2W Avg. Qty.NSE 15892163
Free Float (INR Bn) 40.08
Beta 1.1
Y/E (INR mn) FY12 FY13 FY14 FY15
Net Sales 19579 21668 25090 27816
Growth (%) 36.28% 10.67% 15.79% 10.87%
EBIDTAM (%) 25.33 26.74 19.72 26.36
Adj. PAT -1339 -1294 -458 31
Growth (%) -31.95% -3.34% -64.60% LP
Adj. EPS (INR) NA NA NA 0.03
P/E(x) NA NA NA NA
EV/EBIDTA 14.04 12.19 11.49 16.21
Net Debt/Equity NA NA NA NA
RoACE (%) NA NA NA 11.70
RoAE (%) NA NA NA NA
Dish TV reported its maiden net profit in Q4FY15 buoyed by strong subscriber addition and higher ARPU. Subscriber
addition was helped by delay in implementing Phase 3 & 4 of DAS and launch of regional offering - Zing. Zing is contributing
~22% of net incremental addition. After our recent interaction with the company, we believe that strong subscriber addition,
higher ARPU and lower content cost will help Dish TV to report strong growth in earnings.
Deepak Tewary
deepak.tewary@spagroupindia.com
Ph. No. 91 33 40114800/ 859
80
100
120
140
160
180
200
220
Jun-14
Jul-14
Aug-14
Sep-14
Oct-14
Nov-14
Dec-14
Jan-15
Feb-15
Mar-15
Apr-15
May-15
Jun-15
Dish TV Sensex
2
Entertainment - Electronic Media
Consolidated Revenue - FY15
91%
3%
3%
2% 1%
Subscription Revenue
Lease Rent
Bandwidth Income
Advertising Income
Oth Income
Consolidated Expense - FY15
21%
15%
14%
6%
5%
39%
Programming & oth. Cost
Selling & Distribution Exp
Oth Op. Exp
License Fee
Oth Exp
Employee Benefit Exp
Source:KPMG,SPAResearch
Source:Company, SPA Research
Source:DigitalTVResearcg,KPMG,SPAResearch
Growth in TV Households & Paid C&S Penetration
161 168 196
90%
82%
80%
0
50
100
150
200
250
2013 2014E 2019P
75%
80%
85%
90%
95%
TV Households (mn) Paid C&S Penetration (%) (RHS)
Number of Subscriber by Technology
68 70 55
27 5 5 5
25 29 45
67
85 90 94
37 40 48 61 72 74 769 10 11 11 12 12 12
2013 2014E 2015P 2016P 2017P 2018P 2019P
Analog Cable Digital Cable DTH Oth Digital
Global TV Subscribersby technology
532 368 317
331
239 185
196
320 374
578
264 341 357
439
94 170 208 475
90 112
191
18
19
36
2010 2013 2014E 2020P
Analog Terrestrial AnalogCable Digital Cable DTH DTT IPTV
Split bytechnology
20%
12%
24%
34%
23%
26%
13%
28%
7% 11%
1%
1%
2014E 2020P
Analog Terrestrial AnalogCable Digital Cable DTH DTT IPTV
Source:Company, SPA Research
Net Subscriber Base (mn)
8.5
9.6
10.7
11.4
12.9
FY11 FY12 FY13 FY14 FY15
ARPU (INR)
150 151
157
163
179
FY11 FY12 FY13 FY14 FY15
Market Share - FY15
Sun Direct
8%
Big TV
2%
Aitrel Digital
20%
Tata Sky
23%
Dish TV
27%
Videocon D2h
20%
Source: Company, SPA Research (based on gross subscribers)
Table 1: Status of Digitization - Dec 2014
Phase
Regulatory date of No. of paid C&S Non-digitized Digitization
shutdown subscribers(mn) Subscriber(mn) incl.DTH
Phase 1 Jun'12 12 1 >90% (100%
excl. Chennai)
Phase 2 Mar'13 22 1 >95%
Phase 3 Dec'15 32 14 ~50%
Phase 4 Dec'16 73 54 ~25%
Total 139 70 ~50%
Source:KPMG,SPAResearch
3
Entertainment - Electronic Media
Financials
Income Statement
Year End March (INR mn) FY12 FY13 FY14 FY15
Net Sales 19579 21668 25090 27816
% Growth 36.28% 10.67% 15.79% 10.87%
Project / Production Charges 9972 11081 13283 13954
Employee Cost 748 822 892 1013
Other Optg. Exps. 3900 3971 5968 5519
Total Optg. Exps. 14619 15874 20142 20485
EBIDTA (excl OI) 4960 5794 4947 7331
% Growth 108.36% 16.82% -14.62% 48.18%
EBITDA Margin % 25.33% 26.74% 19.72% 26.36%
Dep./Amortization 5219 6276 5974 6138
EBIT -259 -482 -1026 1193
EBIT Margin % -1.32% -2.22% -4.09% 4.29%
Interest Expense 1973 1284 1328 1754
Other Income 900 1106 778 635
Exceptionals
EBT -1331 -660 -1576 74
Tax Expenses 0 0 1 42
PAT -1331 -660 -1576 31
Minority Interest 0 0 0 0
Adjustment to PAT 8 634 -1118 0
APAT -1339 -1294 -458 31
% Growth -31.95% -3.34% -64.60% LP
APAT Margin % -6.84% -5.97% -1.83% 0.11%
Balance Sheet
Year End March (INR mn) FY12 FY13 FY14 FY15
Share Capital 1064 1065 1065 1066
Reserves and Surplus -2002 -2621 -4191 -4199
Total Networth -939 -1556 -3126 -3134
Minority Interest 0 0 0 0
Secured 12753 16330 14095 11250
Unsecured 1250 0 0 0
Total Debt 14003 16330 14095 11250
Deferred Tax Liability 0 0 0 0
Other Liabilities 1904 1632 1060 248.2
Sources of Funds 14968 16406 12029 8364
Net Block 14204 14340 13571 19510
CWIP 3884 6535 4226 0
Investments 1500 2782 2000 2000
Current Assets 6335 7147 6951 9147
Current Liabilities 11372 15142 15673 23299
Net Current Assets -5037 -7995 -8722 -14152
Misc. Expenditure 0 0 0 0
Deferred Tax Assets 0 0 0 0
Other Assets 418 743 954 1006
Application of Funds 14968 16406 12029 8364
Cash Flow
Year End March (INR mn) FY12 FY13 FY14 FY15
EBT -1331 -660 -1576 74
Less: Other Income/Exceptionals -900 -1106 -778 -635
Add:Depreciation 5219 6388 5974 6138
Add: Interest paid 1973 1284 1328 1754
Direct taxes paid 0 0 -1 -42
Change in Working Capital -2346 2684 509 5430
Cash Flow from operations (a) 4414 10802 7012 12719
Change in Fixed Assets -4136 -6523 -5199 -5940
Change in CWIP 537 -2651 2309 -1321
Change in Investments 500 -1282 782 0
Cash Flow from Investing (b) -3099 -10456 -2108 -7261
Change in Equity 23 43 3 1
Debt Raised/(Repaid) 3240 2327 -2235 -2846
Dividend paid 0 0 0 0
Interest paid -1973 -1284 -1328 -1754
Cash Flow from Financing (c ) 1290 1086 -3559 -4599
Net Change in Cash (a+b+c) 2604 1431 1345 859
Opening Cash 3257 3919 3645 3426
Closing Cash 3919 3645 3426 4286
Key Ratios
Year End March FY12 FY13 FY14 FY15
Per Share Data (INR)
Reported EPS -1.25 -0.62 -1.48 0.03
Adj. EPS -1.26 -1.22 -0.43 0.03
Growth (%) NA NA NA LP
CEPS 3.65 4.68 5.18 5.79
DPS 0 0 0 0
BVPS -0.88 -1.46 -2.94 -2.94
Return Ratios (%)
RoACE NA NA NA 11.70
RoANW NA NA NA NA
RoIC NA NA NA 0.38
Liquidity Ratios
Net Debt/Equity NA NA NA NA
Interest Coverage Ratio NA NA NA 0.68
Current Ratio 0.56 0.47 0.44 0.39
Quick Ratio 0.55 0.47 0.44 0.39
Efficiency Ratios
Asset Turnover Ratio 1.38 1.51 1.85 1.43
Inventory Days 1.28 1.45 1.09 1.30
Debtor Days 5.33 5.11 6.04 8.36
Creditor Days 23.77 66.93 29.00 16.64
Valuation Ratios
P/E(x) NA NA NA NA
P/BV (x) NA NA NA NA
P/CEPS (x) 17.48 12.71 12.62 18.13
Dividend Yield (%) 0 0 0 0
EV/Net Sales (x) 3.99 3.88 2.64 4.27
EV/EBIDTA(x) 13.32 12.19 11.55 16.21
4
Entertainment - Electronic Media
For More Information Visit Us At : www.spasecurities.com
Sharad Avasthi Head - Equity Research sharad.avasthi@spagroupindia.com Tel.: +91-33-4011 4800 Ext.832
SPA Securities Ltd: Mittal Court, A-Wing, 10th Floor, Nariman Point, Mumbai - 400 021, Tel. No. : +91-022-4289 5600, Fax: +91 (22) 2657 3708/9
Analyst Certification of Independence: The analyst(s) for this report certifies that all the views expressed in this report accurately reflect his or her personal views about the subject company(ies) or issuers and no part of his or
hercompensationwas,isorwillbe,directlyorindirectlyrelatedtospecificrecommendationsorviewsexpressedinthisreport.Theresearchanalystsareboundbystringentinternalregulationsandalsolegalandstatutoryrequirements
of the Securities and Exchange Board of India (hereinafter "SEBI") and the analysts' compensation are completely delinked from all the other companies and/or entities of SPASecurities Limited, and have no bearing whatsoever on
anyrecommendationthattheyhavegivenintheResearchReport.
DisclaimerandDisclosuresasrequiredunderSEBI(Research Analyst)Regulations,2014:SPASecuritiesLimited(hereinafterreferasSPASecurities)anditsaffiliatesareengagedininvestmentbanking,investment advisory,
stock broking, institutional equities, Mutual Fund Distributor and insurance broking. SPASecurities is a SEBI registered securities broking Company having membership of NSE, BSE & MCX for Equity, Future & Option, Currency
Derivatives segment and Wholesale Debt Market. The Company is focused primarily on providing securities broking services to institutional clients and is empanelled as an approved securities broker with all the major Nationalised,
PrivateandCo-operativebanks,Corporatehouses,InsuranceCompanies,FinancialInstitutions,AssetManagementCompaniesandProvidentFundTrusts.Detailsofaffiliatesareavailableonourwebsitei.e.www.spasecurities.com.
Weherebydeclarethatouractivitieswereneithersuspendednorwehavedefaultedwithanystockexchangeauthoritywithwhom weareregisteredinthelastfiveyears.WehavenotbeendebarredfromdoingbusinessbyanyStock
Exchange/SEBI or any other authorities, nor has our certificate of registration been cancelled by SEBI at any point of time.
GeneralDisclosures: ThisResearchReport(hereinaftercalled"report")hasbeenpreparedbySPASecuritiesandismeantforsoleusebytherecipientandnotforcirculation.ThisReportdoesnotconstituteapersonalrecommendation
or take into account the particular investment objectives, financial situations, or needs of individual clients. The recommendations, if any, made herein are expression of views and/or opinions and should not be deemed or construed
tobeneitheradviceforthepurposeofpurchaseorsaleofanysecurity,(asdefinedundersection2(h)ofsecuritiesContracts(Regulation)Act.1956,throughSPASecuritiesnoranysolicitationorofferingofanyinvestment/tradingopportunity
onbehalfoftheissuer(s)oftherespectivesecurity(ies)referredtoherein.RecipientsofthisReportshouldrelyoninformation/dataarisingoutoftheirowninvestigations.Readersareadvisedtoseekindependentprofessionaladvice
and arrive at an informed trading/investment decision before executing any trades or making any investments.
ThisReporthasbeenpreparedonthebasisofpubliclyavailableinformation,internallydevelopeddataandothersourcesbelievedbySPASecuritiestobereliable,althoughitsaccuracyandcompletenesscannotbeguaranteed.Such
information has not been independently verified and no guaranty, representation of warranty, express or implied, is made as to its accuracy, completeness or correctness.Any review, retransmission or any other use is prohibited.
The information, opinions, views expressed in this Research Report are those of the research analyst as at the date of this Research Report which are subject to change and do not represent to be an authority on the subject. While
we would endeavour to update the information herein on a reasonable basis, we are under no obligation to update the information.Also, there may be regulatory, compliance or other reasons that prevent us from doing so. Hence all
such information and opinions are subject to change without notice.
Our salespeople, traders, and other professionals may provide oral or written market commentary or trading strategies to our clients that reflect opinions that are contrary to the opinions expressed herein, and our proprietary trading
and investing businesses may make investment decisions that may be inconsistent with the recommendations expressed herein.
This Research Report should be read and relied upon at the sole discretion and risk of the recipient. If you are dissatisfied with the contents of this complimentary Research Report or with the terms of this Disclaimer, your sole and
exclusive remedy is to stop using this Research Report. Neither SPASecurities nor its affiliates or their respective directors, employees, agents or representatives shall be responsible or liable in any manner, directly or indirectly, for
the losses or the damages sustained due to the investments made or any action taken on basis of this report, including but not restricted to, fluctuation in the prices of shares and bonds, changes in the currency rates, diminution in
the NAVs, reduction in the dividend or income, etc.
Compensation of our ResearchAnalysts is not based on any specific merchant banking, investment banking or brokerage service transactions. SPASecurities may have issued other reports in the past that are inconsistent with and
reachdifferentconclusionfromtheinformationpresentedinthisreport.
SPASecurities, its affiliates and employees may, from time to time, effect or have effected an own account transaction in, or deal as principal or agent in or for the securities mentioned in this document.They may perform or seek to
perform investment banking or other services for, or solicit investment banking or other business from, any company referred to in this report.
TheusershouldconsulttheirownadvisorstodeterminethemeritsandrisksofinvestmentandalsoreadtheRiskDisclosureDocumentsforCapitalMarketsandDerivativeSegmentsasprescribedbySecuritiesandExchangeBoard
of India before investing in the Indian Markets.
A graph of daily closing prices of securities is available at www.nseindia.com and http://economictimes.indiatimes.com/markets/stocks/stock-quotes. (Choose a company from the list on the browser and select the "three years" icon
in the price chart).
SPASecurities plans to register itself as a Research Entity under the SEBI (ResearchAnalysts) Regulations, 2014.
Disclaimers in respect of jurisdiction: This report is not directed to, or intended for distribution to or use by, any person or entity who is a citizen or resident or located in any locality, state, country or other jurisdiction where such
distribution, publication, reproduction, availability or use would be contrary to law or regulation or what would subject SPASecurities or its affiliates to any registration or licensing requirement within such jurisdiction. If this report is
inadvertentlysendorhasreachedanyindividualinsuchcountry,especially,USA,thesamemaybeignoredandbroughttotheattentionofthesender.Thisdocumentmaynotbereproduced,distributedorpublishedforanypurposes
without prior written approval of SPASecurities.
List of Associates as per SEBI (Research Analyst) Regulations, 2014
• SPAInsurance Broking Services limited
Statements on ownership and material conflicts of interest, compensation - SPA and Associates
Disclosure of interest statement Yes/No
SPA Securities/its Affiliates/Analyst/his or her Relative financial interest in the company No
SPA Securities/its Affiliates/Analyst/his or her Relative actual/beneficial ownership of more than 1% in subject company at the end of the month
Immediately preceding the date of the publication of the research report or date of public appearance. No
Investment banking relationship with the company covered No
Any other material conflict of interest at the time of publishing the research report No
Receipt of compensation by SPA Securities or its Affiliated Companies from the subject company covered for in the last twelve months:
• Managing/co-managing public offering of securities
• Investmentbanking/merchantbanking/brokerageservices
• products or services other than those above
• in connection with research report
No
Whether Research Analyst has served as an officer, director or employee of the subject company covered No
Whether the Research Analyst or Research Entity has been engaged in market making activity of the Subject Company; No
For statements on ownership and material conflicts of interest, compensation, etc. for individual Research Analyst(s), please refer to each specific research report.
SPA CAPITAL SERVICES LIMITED
Investment Advisory Services,
AMFI Reg. No. ARN-0007
SPA CAPITAL ADVISORS LIMITED
SEBI registered Category-1
Merchant Bankers
SEBI Regn. No. INM000010825
SPA COMTRADE PRIVATE LIMITED
Member of NCDEX & MCX.
NCDEX TMID-00729,
NCDEXFMCNo.NCDEX/TCM/CORP/0714
SPAINSURANCE BROKING SERVICES LTD
Direct Broker for Life and General
Insurance Broking
IRDA Lic. Code No. DB053/03
SPA Securities Ltd SEBI Reg. Nos.
NSE Cash INB231178238
NSE Future & Option INF231173238
NSE Currency Derivatives INE231178238
BSE Cash INB011178234
BSE Currency Derivatives INE011178234
MCX-SX Cash INB261178231
MCX-SX Future & Option INF261178231
MCX-SX Currency Derivatives INE261178238
Mutual Fund ARN 77388
CDSLDP IN-DP-CDSL-485-2008
NSDLDP IN-DP-NSDL-316-2009

More Related Content

What's hot

qwest communications 3Q 06_Earnings
qwest communications 3Q 06_Earningsqwest communications 3Q 06_Earnings
qwest communications 3Q 06_Earningsfinance19
 
US wireless market trends Q2 2014
US wireless market trends Q2 2014US wireless market trends Q2 2014
US wireless market trends Q2 2014Jan Dawson
 
US Wireless Market Trends for Q3 2014
US Wireless Market Trends for Q3 2014US Wireless Market Trends for Q3 2014
US Wireless Market Trends for Q3 2014Jan Dawson
 
qwest communications 1Q 06 Earnings
qwest communications 1Q 06 Earningsqwest communications 1Q 06 Earnings
qwest communications 1Q 06 Earningsfinance19
 
qwest communications q_2Q 05er
qwest communications q_2Q 05erqwest communications q_2Q 05er
qwest communications q_2Q 05erfinance19
 
Webcast 3 q10 eng
Webcast 3 q10 engWebcast 3 q10 eng
Webcast 3 q10 engTIM RI
 
Q4 2015 Investor Factbook
Q4 2015 Investor FactbookQ4 2015 Investor Factbook
Q4 2015 Investor FactbookTMUS_IR
 
ADC India: FY15 net profit up 50% y/y to INR49.8m; Firstcall recommend 'Buy'
ADC India: FY15 net profit up 50% y/y to INR49.8m; Firstcall recommend 'Buy'ADC India: FY15 net profit up 50% y/y to INR49.8m; Firstcall recommend 'Buy'
ADC India: FY15 net profit up 50% y/y to INR49.8m; Firstcall recommend 'Buy'IndiaNotes.com
 
qwest communications q_q4 04er
qwest communications q_q4 04erqwest communications q_q4 04er
qwest communications q_q4 04erfinance19
 
Meeting with Investors of March 2017
Meeting with Investors of March 2017Meeting with Investors of March 2017
Meeting with Investors of March 2017TIM RI
 
3Q14 Results Presentation
3Q14 Results Presentation3Q14 Results Presentation
3Q14 Results PresentationTIM RI
 
Results presentation 3 q14 eng
Results presentation 3 q14 engResults presentation 3 q14 eng
Results presentation 3 q14 engTIM RI
 
Fullerton Securities recommends : Bharati Airtel Ltd - BUY
Fullerton Securities recommends : Bharati Airtel Ltd -  BUYFullerton Securities recommends : Bharati Airtel Ltd -  BUY
Fullerton Securities recommends : Bharati Airtel Ltd - BUYFullerton Securities
 
Sports channel business plan
Sports channel business planSports channel business plan
Sports channel business planManish Poddar
 
Finolex cables ru2 qfy2011-251010
Finolex cables ru2 qfy2011-251010Finolex cables ru2 qfy2011-251010
Finolex cables ru2 qfy2011-251010Angel Broking
 
June July ISMS Camparison
June July ISMS CamparisonJune July ISMS Camparison
June July ISMS CamparisonHasan Mokaddes
 
Nibc 2016 mba-m fin - true north investments - ppt
Nibc 2016   mba-m fin - true north investments - pptNibc 2016   mba-m fin - true north investments - ppt
Nibc 2016 mba-m fin - true north investments - pptJohn McGlynn
 
Netflix Q2 2016 Earnings Slides
Netflix Q2 2016 Earnings SlidesNetflix Q2 2016 Earnings Slides
Netflix Q2 2016 Earnings SlidesJan Dawson
 

What's hot (20)

qwest communications 3Q 06_Earnings
qwest communications 3Q 06_Earningsqwest communications 3Q 06_Earnings
qwest communications 3Q 06_Earnings
 
US wireless market trends Q2 2014
US wireless market trends Q2 2014US wireless market trends Q2 2014
US wireless market trends Q2 2014
 
US Wireless Market Trends for Q3 2014
US Wireless Market Trends for Q3 2014US Wireless Market Trends for Q3 2014
US Wireless Market Trends for Q3 2014
 
qwest communications 1Q 06 Earnings
qwest communications 1Q 06 Earningsqwest communications 1Q 06 Earnings
qwest communications 1Q 06 Earnings
 
qwest communications q_2Q 05er
qwest communications q_2Q 05erqwest communications q_2Q 05er
qwest communications q_2Q 05er
 
Webcast 3 q10 eng
Webcast 3 q10 engWebcast 3 q10 eng
Webcast 3 q10 eng
 
Budget 2010
Budget 2010Budget 2010
Budget 2010
 
Q4 2015 Investor Factbook
Q4 2015 Investor FactbookQ4 2015 Investor Factbook
Q4 2015 Investor Factbook
 
ADC India: FY15 net profit up 50% y/y to INR49.8m; Firstcall recommend 'Buy'
ADC India: FY15 net profit up 50% y/y to INR49.8m; Firstcall recommend 'Buy'ADC India: FY15 net profit up 50% y/y to INR49.8m; Firstcall recommend 'Buy'
ADC India: FY15 net profit up 50% y/y to INR49.8m; Firstcall recommend 'Buy'
 
qwest communications q_q4 04er
qwest communications q_q4 04erqwest communications q_q4 04er
qwest communications q_q4 04er
 
Meeting with Investors of March 2017
Meeting with Investors of March 2017Meeting with Investors of March 2017
Meeting with Investors of March 2017
 
3Q14 Results Presentation
3Q14 Results Presentation3Q14 Results Presentation
3Q14 Results Presentation
 
Results presentation 3 q14 eng
Results presentation 3 q14 engResults presentation 3 q14 eng
Results presentation 3 q14 eng
 
Fullerton Securities recommends : Bharati Airtel Ltd - BUY
Fullerton Securities recommends : Bharati Airtel Ltd -  BUYFullerton Securities recommends : Bharati Airtel Ltd -  BUY
Fullerton Securities recommends : Bharati Airtel Ltd - BUY
 
MATC Fall Lecture Series: Paul Hanley
MATC Fall Lecture Series: Paul HanleyMATC Fall Lecture Series: Paul Hanley
MATC Fall Lecture Series: Paul Hanley
 
Sports channel business plan
Sports channel business planSports channel business plan
Sports channel business plan
 
Finolex cables ru2 qfy2011-251010
Finolex cables ru2 qfy2011-251010Finolex cables ru2 qfy2011-251010
Finolex cables ru2 qfy2011-251010
 
June July ISMS Camparison
June July ISMS CamparisonJune July ISMS Camparison
June July ISMS Camparison
 
Nibc 2016 mba-m fin - true north investments - ppt
Nibc 2016   mba-m fin - true north investments - pptNibc 2016   mba-m fin - true north investments - ppt
Nibc 2016 mba-m fin - true north investments - ppt
 
Netflix Q2 2016 Earnings Slides
Netflix Q2 2016 Earnings SlidesNetflix Q2 2016 Earnings Slides
Netflix Q2 2016 Earnings Slides
 

Similar to Dish TV registers its first profit in Q4FY15

Will Dish TV India's optimism improve missed estimates in FY15?
Will Dish TV India's optimism improve missed estimates in FY15?Will Dish TV India's optimism improve missed estimates in FY15?
Will Dish TV India's optimism improve missed estimates in FY15?IndiaNotes.com
 
Pay TV Issue Comment
Pay TV Issue CommentPay TV Issue Comment
Pay TV Issue CommentJeehyun Moon
 
Motilal oswal dishtv_30oct_2014
Motilal oswal dishtv_30oct_2014Motilal oswal dishtv_30oct_2014
Motilal oswal dishtv_30oct_2014IndiaNotes.com
 
Info Edge: Management reiterates strong outlook
Info Edge: Management reiterates strong outlookInfo Edge: Management reiterates strong outlook
Info Edge: Management reiterates strong outlookIndiaNotes.com
 
Tpart results presentation 1 q18
Tpart   results presentation 1 q18Tpart   results presentation 1 q18
Tpart results presentation 1 q18TIM RI
 
TIM part results presentation 1Q18
TIM part results presentation 1Q18TIM part results presentation 1Q18
TIM part results presentation 1Q18TIM RI
 
Financial Results for the 2nd Quarter of the Fiscal Year Ending March 2016
Financial Results for the 2nd Quarter of the Fiscal   Year Ending March 2016Financial Results for the 2nd Quarter of the Fiscal   Year Ending March 2016
Financial Results for the 2nd Quarter of the Fiscal Year Ending March 2016KDDI
 
TIM - Meeting with Investors of June 2016
TIM - Meeting with Investors of June 2016TIM - Meeting with Investors of June 2016
TIM - Meeting with Investors of June 2016TIM RI
 
TIM Results Presentation 4Q18
TIM Results Presentation 4Q18TIM Results Presentation 4Q18
TIM Results Presentation 4Q18TIM RI
 
Tim part results presentation 4 q18
Tim part   results presentation 4 q18Tim part   results presentation 4 q18
Tim part results presentation 4 q18TIM RI
 
TIM Meeting with Investors - jun 2017
TIM Meeting with Investors - jun 2017TIM Meeting with Investors - jun 2017
TIM Meeting with Investors - jun 2017TIM RI
 
Tim meeting with investors - may 2017
Tim   meeting with investors - may 2017Tim   meeting with investors - may 2017
Tim meeting with investors - may 2017TIM RI
 
Results Presentation 2Q16
Results Presentation 2Q16Results Presentation 2Q16
Results Presentation 2Q16TIM RI
 
Hdfc securities wipro_29_oct_2014
Hdfc securities wipro_29_oct_2014Hdfc securities wipro_29_oct_2014
Hdfc securities wipro_29_oct_2014IndiaNotes.com
 
Meeting with Investors - June 2015
Meeting with Investors - June 2015Meeting with Investors - June 2015
Meeting with Investors - June 2015TIM RI
 
Meeting with Investors - May 2015
Meeting with Investors - May 2015Meeting with Investors - May 2015
Meeting with Investors - May 2015TIM RI
 
Webcast 3Q10
Webcast 3Q10Webcast 3Q10
Webcast 3Q10TIM RI
 
Results presentation 2 q15 eng
Results presentation 2 q15 engResults presentation 2 q15 eng
Results presentation 2 q15 engTIM RI
 
Sun TV Q1FY15 adjusted PAT increases 5% YoY; buy - buy - Motilal Oswal
Sun TV Q1FY15 adjusted PAT increases 5% YoY; buy - buy - Motilal OswalSun TV Q1FY15 adjusted PAT increases 5% YoY; buy - buy - Motilal Oswal
Sun TV Q1FY15 adjusted PAT increases 5% YoY; buy - buy - Motilal OswalIndiaNotes.com
 
Results presentation 2 q14 eng
Results presentation 2 q14 engResults presentation 2 q14 eng
Results presentation 2 q14 engTIM RI
 

Similar to Dish TV registers its first profit in Q4FY15 (20)

Will Dish TV India's optimism improve missed estimates in FY15?
Will Dish TV India's optimism improve missed estimates in FY15?Will Dish TV India's optimism improve missed estimates in FY15?
Will Dish TV India's optimism improve missed estimates in FY15?
 
Pay TV Issue Comment
Pay TV Issue CommentPay TV Issue Comment
Pay TV Issue Comment
 
Motilal oswal dishtv_30oct_2014
Motilal oswal dishtv_30oct_2014Motilal oswal dishtv_30oct_2014
Motilal oswal dishtv_30oct_2014
 
Info Edge: Management reiterates strong outlook
Info Edge: Management reiterates strong outlookInfo Edge: Management reiterates strong outlook
Info Edge: Management reiterates strong outlook
 
Tpart results presentation 1 q18
Tpart   results presentation 1 q18Tpart   results presentation 1 q18
Tpart results presentation 1 q18
 
TIM part results presentation 1Q18
TIM part results presentation 1Q18TIM part results presentation 1Q18
TIM part results presentation 1Q18
 
Financial Results for the 2nd Quarter of the Fiscal Year Ending March 2016
Financial Results for the 2nd Quarter of the Fiscal   Year Ending March 2016Financial Results for the 2nd Quarter of the Fiscal   Year Ending March 2016
Financial Results for the 2nd Quarter of the Fiscal Year Ending March 2016
 
TIM - Meeting with Investors of June 2016
TIM - Meeting with Investors of June 2016TIM - Meeting with Investors of June 2016
TIM - Meeting with Investors of June 2016
 
TIM Results Presentation 4Q18
TIM Results Presentation 4Q18TIM Results Presentation 4Q18
TIM Results Presentation 4Q18
 
Tim part results presentation 4 q18
Tim part   results presentation 4 q18Tim part   results presentation 4 q18
Tim part results presentation 4 q18
 
TIM Meeting with Investors - jun 2017
TIM Meeting with Investors - jun 2017TIM Meeting with Investors - jun 2017
TIM Meeting with Investors - jun 2017
 
Tim meeting with investors - may 2017
Tim   meeting with investors - may 2017Tim   meeting with investors - may 2017
Tim meeting with investors - may 2017
 
Results Presentation 2Q16
Results Presentation 2Q16Results Presentation 2Q16
Results Presentation 2Q16
 
Hdfc securities wipro_29_oct_2014
Hdfc securities wipro_29_oct_2014Hdfc securities wipro_29_oct_2014
Hdfc securities wipro_29_oct_2014
 
Meeting with Investors - June 2015
Meeting with Investors - June 2015Meeting with Investors - June 2015
Meeting with Investors - June 2015
 
Meeting with Investors - May 2015
Meeting with Investors - May 2015Meeting with Investors - May 2015
Meeting with Investors - May 2015
 
Webcast 3Q10
Webcast 3Q10Webcast 3Q10
Webcast 3Q10
 
Results presentation 2 q15 eng
Results presentation 2 q15 engResults presentation 2 q15 eng
Results presentation 2 q15 eng
 
Sun TV Q1FY15 adjusted PAT increases 5% YoY; buy - buy - Motilal Oswal
Sun TV Q1FY15 adjusted PAT increases 5% YoY; buy - buy - Motilal OswalSun TV Q1FY15 adjusted PAT increases 5% YoY; buy - buy - Motilal Oswal
Sun TV Q1FY15 adjusted PAT increases 5% YoY; buy - buy - Motilal Oswal
 
Results presentation 2 q14 eng
Results presentation 2 q14 engResults presentation 2 q14 eng
Results presentation 2 q14 eng
 

More from IndiaNotes.com

Fce glaxo smithkline_12aug15
Fce glaxo smithkline_12aug15Fce glaxo smithkline_12aug15
Fce glaxo smithkline_12aug15IndiaNotes.com
 
GSK Consumer: Horlicks strengthens its position as No.1 brand across India
GSK Consumer: Horlicks strengthens its position as No.1 brand across IndiaGSK Consumer: Horlicks strengthens its position as No.1 brand across India
GSK Consumer: Horlicks strengthens its position as No.1 brand across IndiaIndiaNotes.com
 
Hester Biosciences gets manufacturing licence for 2 additional poultry vaccines
Hester Biosciences gets manufacturing licence for 2 additional poultry vaccinesHester Biosciences gets manufacturing licence for 2 additional poultry vaccines
Hester Biosciences gets manufacturing licence for 2 additional poultry vaccinesIndiaNotes.com
 
Vidhi Dyestuffs: To keep its growth story in the coming quarters also
Vidhi Dyestuffs: To keep its growth story in the coming quarters alsoVidhi Dyestuffs: To keep its growth story in the coming quarters also
Vidhi Dyestuffs: To keep its growth story in the coming quarters alsoIndiaNotes.com
 
Apollo Tyres approves further expansion of the Truck & Bus radial tyre capacity
Apollo Tyres approves further expansion of the Truck & Bus radial tyre capacityApollo Tyres approves further expansion of the Truck & Bus radial tyre capacity
Apollo Tyres approves further expansion of the Truck & Bus radial tyre capacityIndiaNotes.com
 
Grasim Industries reports improved performance in Q1FY16
Grasim Industries reports improved performance in Q1FY16Grasim Industries reports improved performance in Q1FY16
Grasim Industries reports improved performance in Q1FY16IndiaNotes.com
 
Cummins India: No interest burden being free from long-term or short-term debt
Cummins India: No interest burden being free from long-term or short-term debtCummins India: No interest burden being free from long-term or short-term debt
Cummins India: No interest burden being free from long-term or short-term debtIndiaNotes.com
 
Buy Makers Laboratories, company growing rapidly with strong thrust on brande...
Buy Makers Laboratories, company growing rapidly with strong thrust on brande...Buy Makers Laboratories, company growing rapidly with strong thrust on brande...
Buy Makers Laboratories, company growing rapidly with strong thrust on brande...IndiaNotes.com
 
Buy Multibase India, globalisation of the auto component sector to benefit th...
Buy Multibase India, globalisation of the auto component sector to benefit th...Buy Multibase India, globalisation of the auto component sector to benefit th...
Buy Multibase India, globalisation of the auto component sector to benefit th...IndiaNotes.com
 
Capital First: Long-term credit rating is rated highly at AA+ by CARE
Capital First: Long-term credit rating is rated highly at AA+ by CARECapital First: Long-term credit rating is rated highly at AA+ by CARE
Capital First: Long-term credit rating is rated highly at AA+ by CAREIndiaNotes.com
 
Orient Cement: Best placed to benefit from demand revival in AP & Telengana r...
Orient Cement: Best placed to benefit from demand revival in AP & Telengana r...Orient Cement: Best placed to benefit from demand revival in AP & Telengana r...
Orient Cement: Best placed to benefit from demand revival in AP & Telengana r...IndiaNotes.com
 
Canara Bank's operating performance to improve in remaining 9MFY16E
Canara Bank's operating performance to improve in remaining 9MFY16ECanara Bank's operating performance to improve in remaining 9MFY16E
Canara Bank's operating performance to improve in remaining 9MFY16EIndiaNotes.com
 
Buy Jenburkt Pharmaceuticals; government's amended FDI policy to cover medica...
Buy Jenburkt Pharmaceuticals; government's amended FDI policy to cover medica...Buy Jenburkt Pharmaceuticals; government's amended FDI policy to cover medica...
Buy Jenburkt Pharmaceuticals; government's amended FDI policy to cover medica...IndiaNotes.com
 
Hexaware Technologies adds 9 clients in Q2CY15, Buy
Hexaware Technologies adds 9 clients in Q2CY15, BuyHexaware Technologies adds 9 clients in Q2CY15, Buy
Hexaware Technologies adds 9 clients in Q2CY15, BuyIndiaNotes.com
 
Nirmal pi industries_03_aug15
Nirmal pi industries_03_aug15Nirmal pi industries_03_aug15
Nirmal pi industries_03_aug15IndiaNotes.com
 
Indoco Remedies: Weak domestic growth offsets export revenues in Q1FY16; Hold
Indoco Remedies: Weak domestic growth offsets export revenues in Q1FY16; HoldIndoco Remedies: Weak domestic growth offsets export revenues in Q1FY16; Hold
Indoco Remedies: Weak domestic growth offsets export revenues in Q1FY16; HoldIndiaNotes.com
 
PI Industries: Custom synthesis exports deliver growth of ~26% in Q1FY16; Buy
PI Industries: Custom synthesis exports deliver growth of ~26% in Q1FY16; BuyPI Industries: Custom synthesis exports deliver growth of ~26% in Q1FY16; Buy
PI Industries: Custom synthesis exports deliver growth of ~26% in Q1FY16; BuyIndiaNotes.com
 

More from IndiaNotes.com (20)

Fce glaxo smithkline_12aug15
Fce glaxo smithkline_12aug15Fce glaxo smithkline_12aug15
Fce glaxo smithkline_12aug15
 
GSK Consumer: Horlicks strengthens its position as No.1 brand across India
GSK Consumer: Horlicks strengthens its position as No.1 brand across IndiaGSK Consumer: Horlicks strengthens its position as No.1 brand across India
GSK Consumer: Horlicks strengthens its position as No.1 brand across India
 
GSK Consumer: Horlicks strengthens its position as No.1 brand across India
GSK Consumer: Horlicks strengthens its position as No.1 brand across IndiaGSK Consumer: Horlicks strengthens its position as No.1 brand across India
GSK Consumer: Horlicks strengthens its position as No.1 brand across India
 
Hester Biosciences gets manufacturing licence for 2 additional poultry vaccines
Hester Biosciences gets manufacturing licence for 2 additional poultry vaccinesHester Biosciences gets manufacturing licence for 2 additional poultry vaccines
Hester Biosciences gets manufacturing licence for 2 additional poultry vaccines
 
Vidhi Dyestuffs: To keep its growth story in the coming quarters also
Vidhi Dyestuffs: To keep its growth story in the coming quarters alsoVidhi Dyestuffs: To keep its growth story in the coming quarters also
Vidhi Dyestuffs: To keep its growth story in the coming quarters also
 
Apollo Tyres approves further expansion of the Truck & Bus radial tyre capacity
Apollo Tyres approves further expansion of the Truck & Bus radial tyre capacityApollo Tyres approves further expansion of the Truck & Bus radial tyre capacity
Apollo Tyres approves further expansion of the Truck & Bus radial tyre capacity
 
Grasim Industries reports improved performance in Q1FY16
Grasim Industries reports improved performance in Q1FY16Grasim Industries reports improved performance in Q1FY16
Grasim Industries reports improved performance in Q1FY16
 
Cummins India: No interest burden being free from long-term or short-term debt
Cummins India: No interest burden being free from long-term or short-term debtCummins India: No interest burden being free from long-term or short-term debt
Cummins India: No interest burden being free from long-term or short-term debt
 
Buy Makers Laboratories, company growing rapidly with strong thrust on brande...
Buy Makers Laboratories, company growing rapidly with strong thrust on brande...Buy Makers Laboratories, company growing rapidly with strong thrust on brande...
Buy Makers Laboratories, company growing rapidly with strong thrust on brande...
 
Buy Multibase India, globalisation of the auto component sector to benefit th...
Buy Multibase India, globalisation of the auto component sector to benefit th...Buy Multibase India, globalisation of the auto component sector to benefit th...
Buy Multibase India, globalisation of the auto component sector to benefit th...
 
Capital First: Long-term credit rating is rated highly at AA+ by CARE
Capital First: Long-term credit rating is rated highly at AA+ by CARECapital First: Long-term credit rating is rated highly at AA+ by CARE
Capital First: Long-term credit rating is rated highly at AA+ by CARE
 
Orient Cement: Best placed to benefit from demand revival in AP & Telengana r...
Orient Cement: Best placed to benefit from demand revival in AP & Telengana r...Orient Cement: Best placed to benefit from demand revival in AP & Telengana r...
Orient Cement: Best placed to benefit from demand revival in AP & Telengana r...
 
Canara Bank's operating performance to improve in remaining 9MFY16E
Canara Bank's operating performance to improve in remaining 9MFY16ECanara Bank's operating performance to improve in remaining 9MFY16E
Canara Bank's operating performance to improve in remaining 9MFY16E
 
Nirmal lupin 06_aug15
Nirmal lupin 06_aug15Nirmal lupin 06_aug15
Nirmal lupin 06_aug15
 
Buy Jenburkt Pharmaceuticals; government's amended FDI policy to cover medica...
Buy Jenburkt Pharmaceuticals; government's amended FDI policy to cover medica...Buy Jenburkt Pharmaceuticals; government's amended FDI policy to cover medica...
Buy Jenburkt Pharmaceuticals; government's amended FDI policy to cover medica...
 
Hexaware Technologies adds 9 clients in Q2CY15, Buy
Hexaware Technologies adds 9 clients in Q2CY15, BuyHexaware Technologies adds 9 clients in Q2CY15, Buy
Hexaware Technologies adds 9 clients in Q2CY15, Buy
 
Nirmal pi industries_03_aug15
Nirmal pi industries_03_aug15Nirmal pi industries_03_aug15
Nirmal pi industries_03_aug15
 
Indoco Remedies: Weak domestic growth offsets export revenues in Q1FY16; Hold
Indoco Remedies: Weak domestic growth offsets export revenues in Q1FY16; HoldIndoco Remedies: Weak domestic growth offsets export revenues in Q1FY16; Hold
Indoco Remedies: Weak domestic growth offsets export revenues in Q1FY16; Hold
 
Fce thermax 31_jul15
Fce thermax 31_jul15Fce thermax 31_jul15
Fce thermax 31_jul15
 
PI Industries: Custom synthesis exports deliver growth of ~26% in Q1FY16; Buy
PI Industries: Custom synthesis exports deliver growth of ~26% in Q1FY16; BuyPI Industries: Custom synthesis exports deliver growth of ~26% in Q1FY16; Buy
PI Industries: Custom synthesis exports deliver growth of ~26% in Q1FY16; Buy
 

Dish TV registers its first profit in Q4FY15

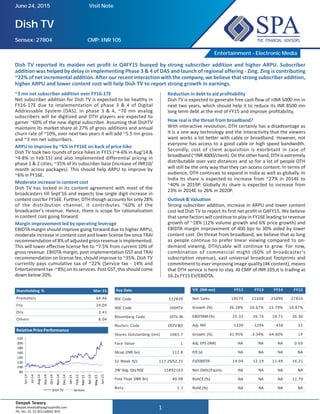
  • 1. 1 Entertainment - Electronic Media Dish TV Sensex: 27804 CMP:INR105 ~3 mn net subscriber addition over FY16-17E Net subscriber addition for Dish TV is expected to be healthy in FY16-17E due to implementation of phase 3 & 4 of Digital Addressable System (DAS). In phase 3 & 4, ~70 mn analog subscribers will be digitized and DTH players are expected to garner ~60% of the new digital subscriber. Assuming that DishTV maintains its market share at 27% of gross additions and annual churn rate of ~10%, over next two years it will add ~5.5 mn gross and ~3 mn net subscribers. ARPU to improve by ~6% in FY16E on back of price hike Dish TV took two rounds of price hikes in FY15 (~4-6% in Aug'14 & ~4-8% in Feb'15) and also implemented differential pricing in phase 1 & 2 cities, ~35% of its subscriber base (increase of INR10/ month across packages). This should help ARPU to improve by ~6% in FY16E. Moderate increase in content cost Dish TV has locked in its content agreement with most of the broadcasters till Sept'16 and expects low single digit increase in content cost for FY16E. Further, DTH though accounts for only 28% of the distribution channel, it contributes ~60% of the broadcaster's revenue. Hence, there is scope for rationalization in content cost going forward. Margin improvement led by operating leverage EBIDTA margin should improve going forward due to higher ARPU, moderate increase in content cost and lower license fee once TRAI recommendation of 8% of adjusted gross revenue is implemented. This will lower effective license fee to ~7.5% from current 10% of gross revenue. EBIDTA margin, post implementation GST and TRAI recommendation on license fee, should improve to ~35%. Dish TV currently pays cumulative tax of ~22% (Service tax - 14% and Entertainment tax -~8%) on its services. Post GST, this should come down below 20%. June 24, 2015 Visit Note Reduction in debt to aid profitability Dish TV is expected to generate free cash flow of >INR 5000 mn in next two years, which should help it to reduce its INR 8500 mn long term debt at the end of FY15 and improve profitability. How real is the threat from broadband? With interactive revolution, DTH certainly has a disadvantage as it is a one way technology and the interactivity that the viewers want works a lot better with cable or broadband. However, not everyone has access to a good cable or high speed bandwidth. Secondly, cost of client acquisition is exorbitant in case of broadband (~INR 4000/client). On the other hand, DTH is extremely distributable over vast distances and so for a lot of people DTH will still be the only way that they can access content. In terms of audience, DTH continues to expand in India as well as globally. In India its share is expected to increase from ~27% in 2014E to ~40% in 2019P. Globally its share is expected to increase from 23% in 2014E to 26% in 2020P. Outlook & Valuation Strong subscriber addition, increase in ARPU and lower content cost led Dish TV to report its first net profit in Q4FY15. We believe that same factors will continue to play in FY16E leading to revenue growth of ~18% (12% volume growth and 6% price growth) and EBIDTA margin improvement of 400 bps to 30% aided by lower content cost. On threat from broadband, we believe that as long as people continue to prefer linear viewing compared to on- demand viewing, DTH/cable will continue to grow. For now, combination of commercial might (60% of broadcaster's subscription revenue), vast universal broadcast footprints and commitment to ever improving image quality (4K content), means that DTH service is here to stay. At CMP of INR 105,it is trading at 16.2x FY15 EV/EBIDTA. Shareholding % Mar-15 Promoters 64.46 FIIs 24.09 DIIs 3.41 Others 8.04 Relative Price Performance Key Data BSE Code 532839 NSE Code DISHTV Bloomberg Code DITV IN Reuters Code DSTV.BO Shares Outstanding (mn) 1065.7 Face Value 1 Mcap (INR bn) 112.8 52 Week H/L 117.25/52.25 2W Avg. Qty.NSE 15892163 Free Float (INR Bn) 40.08 Beta 1.1 Y/E (INR mn) FY12 FY13 FY14 FY15 Net Sales 19579 21668 25090 27816 Growth (%) 36.28% 10.67% 15.79% 10.87% EBIDTAM (%) 25.33 26.74 19.72 26.36 Adj. PAT -1339 -1294 -458 31 Growth (%) -31.95% -3.34% -64.60% LP Adj. EPS (INR) NA NA NA 0.03 P/E(x) NA NA NA NA EV/EBIDTA 14.04 12.19 11.49 16.21 Net Debt/Equity NA NA NA NA RoACE (%) NA NA NA 11.70 RoAE (%) NA NA NA NA Dish TV reported its maiden net profit in Q4FY15 buoyed by strong subscriber addition and higher ARPU. Subscriber addition was helped by delay in implementing Phase 3 & 4 of DAS and launch of regional offering - Zing. Zing is contributing ~22% of net incremental addition. After our recent interaction with the company, we believe that strong subscriber addition, higher ARPU and lower content cost will help Dish TV to report strong growth in earnings. Deepak Tewary deepak.tewary@spagroupindia.com Ph. No. 91 33 40114800/ 859 80 100 120 140 160 180 200 220 Jun-14 Jul-14 Aug-14 Sep-14 Oct-14 Nov-14 Dec-14 Jan-15 Feb-15 Mar-15 Apr-15 May-15 Jun-15 Dish TV Sensex
  • 2. 2 Entertainment - Electronic Media Consolidated Revenue - FY15 91% 3% 3% 2% 1% Subscription Revenue Lease Rent Bandwidth Income Advertising Income Oth Income Consolidated Expense - FY15 21% 15% 14% 6% 5% 39% Programming & oth. Cost Selling & Distribution Exp Oth Op. Exp License Fee Oth Exp Employee Benefit Exp Source:KPMG,SPAResearch Source:Company, SPA Research Source:DigitalTVResearcg,KPMG,SPAResearch Growth in TV Households & Paid C&S Penetration 161 168 196 90% 82% 80% 0 50 100 150 200 250 2013 2014E 2019P 75% 80% 85% 90% 95% TV Households (mn) Paid C&S Penetration (%) (RHS) Number of Subscriber by Technology 68 70 55 27 5 5 5 25 29 45 67 85 90 94 37 40 48 61 72 74 769 10 11 11 12 12 12 2013 2014E 2015P 2016P 2017P 2018P 2019P Analog Cable Digital Cable DTH Oth Digital Global TV Subscribersby technology 532 368 317 331 239 185 196 320 374 578 264 341 357 439 94 170 208 475 90 112 191 18 19 36 2010 2013 2014E 2020P Analog Terrestrial AnalogCable Digital Cable DTH DTT IPTV Split bytechnology 20% 12% 24% 34% 23% 26% 13% 28% 7% 11% 1% 1% 2014E 2020P Analog Terrestrial AnalogCable Digital Cable DTH DTT IPTV Source:Company, SPA Research Net Subscriber Base (mn) 8.5 9.6 10.7 11.4 12.9 FY11 FY12 FY13 FY14 FY15 ARPU (INR) 150 151 157 163 179 FY11 FY12 FY13 FY14 FY15 Market Share - FY15 Sun Direct 8% Big TV 2% Aitrel Digital 20% Tata Sky 23% Dish TV 27% Videocon D2h 20% Source: Company, SPA Research (based on gross subscribers) Table 1: Status of Digitization - Dec 2014 Phase Regulatory date of No. of paid C&S Non-digitized Digitization shutdown subscribers(mn) Subscriber(mn) incl.DTH Phase 1 Jun'12 12 1 >90% (100% excl. Chennai) Phase 2 Mar'13 22 1 >95% Phase 3 Dec'15 32 14 ~50% Phase 4 Dec'16 73 54 ~25% Total 139 70 ~50% Source:KPMG,SPAResearch
  • 3. 3 Entertainment - Electronic Media Financials Income Statement Year End March (INR mn) FY12 FY13 FY14 FY15 Net Sales 19579 21668 25090 27816 % Growth 36.28% 10.67% 15.79% 10.87% Project / Production Charges 9972 11081 13283 13954 Employee Cost 748 822 892 1013 Other Optg. Exps. 3900 3971 5968 5519 Total Optg. Exps. 14619 15874 20142 20485 EBIDTA (excl OI) 4960 5794 4947 7331 % Growth 108.36% 16.82% -14.62% 48.18% EBITDA Margin % 25.33% 26.74% 19.72% 26.36% Dep./Amortization 5219 6276 5974 6138 EBIT -259 -482 -1026 1193 EBIT Margin % -1.32% -2.22% -4.09% 4.29% Interest Expense 1973 1284 1328 1754 Other Income 900 1106 778 635 Exceptionals EBT -1331 -660 -1576 74 Tax Expenses 0 0 1 42 PAT -1331 -660 -1576 31 Minority Interest 0 0 0 0 Adjustment to PAT 8 634 -1118 0 APAT -1339 -1294 -458 31 % Growth -31.95% -3.34% -64.60% LP APAT Margin % -6.84% -5.97% -1.83% 0.11% Balance Sheet Year End March (INR mn) FY12 FY13 FY14 FY15 Share Capital 1064 1065 1065 1066 Reserves and Surplus -2002 -2621 -4191 -4199 Total Networth -939 -1556 -3126 -3134 Minority Interest 0 0 0 0 Secured 12753 16330 14095 11250 Unsecured 1250 0 0 0 Total Debt 14003 16330 14095 11250 Deferred Tax Liability 0 0 0 0 Other Liabilities 1904 1632 1060 248.2 Sources of Funds 14968 16406 12029 8364 Net Block 14204 14340 13571 19510 CWIP 3884 6535 4226 0 Investments 1500 2782 2000 2000 Current Assets 6335 7147 6951 9147 Current Liabilities 11372 15142 15673 23299 Net Current Assets -5037 -7995 -8722 -14152 Misc. Expenditure 0 0 0 0 Deferred Tax Assets 0 0 0 0 Other Assets 418 743 954 1006 Application of Funds 14968 16406 12029 8364 Cash Flow Year End March (INR mn) FY12 FY13 FY14 FY15 EBT -1331 -660 -1576 74 Less: Other Income/Exceptionals -900 -1106 -778 -635 Add:Depreciation 5219 6388 5974 6138 Add: Interest paid 1973 1284 1328 1754 Direct taxes paid 0 0 -1 -42 Change in Working Capital -2346 2684 509 5430 Cash Flow from operations (a) 4414 10802 7012 12719 Change in Fixed Assets -4136 -6523 -5199 -5940 Change in CWIP 537 -2651 2309 -1321 Change in Investments 500 -1282 782 0 Cash Flow from Investing (b) -3099 -10456 -2108 -7261 Change in Equity 23 43 3 1 Debt Raised/(Repaid) 3240 2327 -2235 -2846 Dividend paid 0 0 0 0 Interest paid -1973 -1284 -1328 -1754 Cash Flow from Financing (c ) 1290 1086 -3559 -4599 Net Change in Cash (a+b+c) 2604 1431 1345 859 Opening Cash 3257 3919 3645 3426 Closing Cash 3919 3645 3426 4286 Key Ratios Year End March FY12 FY13 FY14 FY15 Per Share Data (INR) Reported EPS -1.25 -0.62 -1.48 0.03 Adj. EPS -1.26 -1.22 -0.43 0.03 Growth (%) NA NA NA LP CEPS 3.65 4.68 5.18 5.79 DPS 0 0 0 0 BVPS -0.88 -1.46 -2.94 -2.94 Return Ratios (%) RoACE NA NA NA 11.70 RoANW NA NA NA NA RoIC NA NA NA 0.38 Liquidity Ratios Net Debt/Equity NA NA NA NA Interest Coverage Ratio NA NA NA 0.68 Current Ratio 0.56 0.47 0.44 0.39 Quick Ratio 0.55 0.47 0.44 0.39 Efficiency Ratios Asset Turnover Ratio 1.38 1.51 1.85 1.43 Inventory Days 1.28 1.45 1.09 1.30 Debtor Days 5.33 5.11 6.04 8.36 Creditor Days 23.77 66.93 29.00 16.64 Valuation Ratios P/E(x) NA NA NA NA P/BV (x) NA NA NA NA P/CEPS (x) 17.48 12.71 12.62 18.13 Dividend Yield (%) 0 0 0 0 EV/Net Sales (x) 3.99 3.88 2.64 4.27 EV/EBIDTA(x) 13.32 12.19 11.55 16.21
  • 4. 4 Entertainment - Electronic Media For More Information Visit Us At : www.spasecurities.com Sharad Avasthi Head - Equity Research sharad.avasthi@spagroupindia.com Tel.: +91-33-4011 4800 Ext.832 SPA Securities Ltd: Mittal Court, A-Wing, 10th Floor, Nariman Point, Mumbai - 400 021, Tel. No. : +91-022-4289 5600, Fax: +91 (22) 2657 3708/9 Analyst Certification of Independence: The analyst(s) for this report certifies that all the views expressed in this report accurately reflect his or her personal views about the subject company(ies) or issuers and no part of his or hercompensationwas,isorwillbe,directlyorindirectlyrelatedtospecificrecommendationsorviewsexpressedinthisreport.Theresearchanalystsareboundbystringentinternalregulationsandalsolegalandstatutoryrequirements of the Securities and Exchange Board of India (hereinafter "SEBI") and the analysts' compensation are completely delinked from all the other companies and/or entities of SPASecurities Limited, and have no bearing whatsoever on anyrecommendationthattheyhavegivenintheResearchReport. DisclaimerandDisclosuresasrequiredunderSEBI(Research Analyst)Regulations,2014:SPASecuritiesLimited(hereinafterreferasSPASecurities)anditsaffiliatesareengagedininvestmentbanking,investment advisory, stock broking, institutional equities, Mutual Fund Distributor and insurance broking. SPASecurities is a SEBI registered securities broking Company having membership of NSE, BSE & MCX for Equity, Future & Option, Currency Derivatives segment and Wholesale Debt Market. The Company is focused primarily on providing securities broking services to institutional clients and is empanelled as an approved securities broker with all the major Nationalised, PrivateandCo-operativebanks,Corporatehouses,InsuranceCompanies,FinancialInstitutions,AssetManagementCompaniesandProvidentFundTrusts.Detailsofaffiliatesareavailableonourwebsitei.e.www.spasecurities.com. Weherebydeclarethatouractivitieswereneithersuspendednorwehavedefaultedwithanystockexchangeauthoritywithwhom weareregisteredinthelastfiveyears.WehavenotbeendebarredfromdoingbusinessbyanyStock Exchange/SEBI or any other authorities, nor has our certificate of registration been cancelled by SEBI at any point of time. GeneralDisclosures: ThisResearchReport(hereinaftercalled"report")hasbeenpreparedbySPASecuritiesandismeantforsoleusebytherecipientandnotforcirculation.ThisReportdoesnotconstituteapersonalrecommendation or take into account the particular investment objectives, financial situations, or needs of individual clients. The recommendations, if any, made herein are expression of views and/or opinions and should not be deemed or construed tobeneitheradviceforthepurposeofpurchaseorsaleofanysecurity,(asdefinedundersection2(h)ofsecuritiesContracts(Regulation)Act.1956,throughSPASecuritiesnoranysolicitationorofferingofanyinvestment/tradingopportunity onbehalfoftheissuer(s)oftherespectivesecurity(ies)referredtoherein.RecipientsofthisReportshouldrelyoninformation/dataarisingoutoftheirowninvestigations.Readersareadvisedtoseekindependentprofessionaladvice and arrive at an informed trading/investment decision before executing any trades or making any investments. ThisReporthasbeenpreparedonthebasisofpubliclyavailableinformation,internallydevelopeddataandothersourcesbelievedbySPASecuritiestobereliable,althoughitsaccuracyandcompletenesscannotbeguaranteed.Such information has not been independently verified and no guaranty, representation of warranty, express or implied, is made as to its accuracy, completeness or correctness.Any review, retransmission or any other use is prohibited. The information, opinions, views expressed in this Research Report are those of the research analyst as at the date of this Research Report which are subject to change and do not represent to be an authority on the subject. While we would endeavour to update the information herein on a reasonable basis, we are under no obligation to update the information.Also, there may be regulatory, compliance or other reasons that prevent us from doing so. Hence all such information and opinions are subject to change without notice. Our salespeople, traders, and other professionals may provide oral or written market commentary or trading strategies to our clients that reflect opinions that are contrary to the opinions expressed herein, and our proprietary trading and investing businesses may make investment decisions that may be inconsistent with the recommendations expressed herein. This Research Report should be read and relied upon at the sole discretion and risk of the recipient. If you are dissatisfied with the contents of this complimentary Research Report or with the terms of this Disclaimer, your sole and exclusive remedy is to stop using this Research Report. Neither SPASecurities nor its affiliates or their respective directors, employees, agents or representatives shall be responsible or liable in any manner, directly or indirectly, for the losses or the damages sustained due to the investments made or any action taken on basis of this report, including but not restricted to, fluctuation in the prices of shares and bonds, changes in the currency rates, diminution in the NAVs, reduction in the dividend or income, etc. Compensation of our ResearchAnalysts is not based on any specific merchant banking, investment banking or brokerage service transactions. SPASecurities may have issued other reports in the past that are inconsistent with and reachdifferentconclusionfromtheinformationpresentedinthisreport. SPASecurities, its affiliates and employees may, from time to time, effect or have effected an own account transaction in, or deal as principal or agent in or for the securities mentioned in this document.They may perform or seek to perform investment banking or other services for, or solicit investment banking or other business from, any company referred to in this report. TheusershouldconsulttheirownadvisorstodeterminethemeritsandrisksofinvestmentandalsoreadtheRiskDisclosureDocumentsforCapitalMarketsandDerivativeSegmentsasprescribedbySecuritiesandExchangeBoard of India before investing in the Indian Markets. A graph of daily closing prices of securities is available at www.nseindia.com and http://economictimes.indiatimes.com/markets/stocks/stock-quotes. (Choose a company from the list on the browser and select the "three years" icon in the price chart). SPASecurities plans to register itself as a Research Entity under the SEBI (ResearchAnalysts) Regulations, 2014. Disclaimers in respect of jurisdiction: This report is not directed to, or intended for distribution to or use by, any person or entity who is a citizen or resident or located in any locality, state, country or other jurisdiction where such distribution, publication, reproduction, availability or use would be contrary to law or regulation or what would subject SPASecurities or its affiliates to any registration or licensing requirement within such jurisdiction. If this report is inadvertentlysendorhasreachedanyindividualinsuchcountry,especially,USA,thesamemaybeignoredandbroughttotheattentionofthesender.Thisdocumentmaynotbereproduced,distributedorpublishedforanypurposes without prior written approval of SPASecurities. List of Associates as per SEBI (Research Analyst) Regulations, 2014 • SPAInsurance Broking Services limited Statements on ownership and material conflicts of interest, compensation - SPA and Associates Disclosure of interest statement Yes/No SPA Securities/its Affiliates/Analyst/his or her Relative financial interest in the company No SPA Securities/its Affiliates/Analyst/his or her Relative actual/beneficial ownership of more than 1% in subject company at the end of the month Immediately preceding the date of the publication of the research report or date of public appearance. No Investment banking relationship with the company covered No Any other material conflict of interest at the time of publishing the research report No Receipt of compensation by SPA Securities or its Affiliated Companies from the subject company covered for in the last twelve months: • Managing/co-managing public offering of securities • Investmentbanking/merchantbanking/brokerageservices • products or services other than those above • in connection with research report No Whether Research Analyst has served as an officer, director or employee of the subject company covered No Whether the Research Analyst or Research Entity has been engaged in market making activity of the Subject Company; No For statements on ownership and material conflicts of interest, compensation, etc. for individual Research Analyst(s), please refer to each specific research report. SPA CAPITAL SERVICES LIMITED Investment Advisory Services, AMFI Reg. No. ARN-0007 SPA CAPITAL ADVISORS LIMITED SEBI registered Category-1 Merchant Bankers SEBI Regn. No. INM000010825 SPA COMTRADE PRIVATE LIMITED Member of NCDEX & MCX. NCDEX TMID-00729, NCDEXFMCNo.NCDEX/TCM/CORP/0714 SPAINSURANCE BROKING SERVICES LTD Direct Broker for Life and General Insurance Broking IRDA Lic. Code No. DB053/03 SPA Securities Ltd SEBI Reg. Nos. NSE Cash INB231178238 NSE Future & Option INF231173238 NSE Currency Derivatives INE231178238 BSE Cash INB011178234 BSE Currency Derivatives INE011178234 MCX-SX Cash INB261178231 MCX-SX Future & Option INF261178231 MCX-SX Currency Derivatives INE261178238 Mutual Fund ARN 77388 CDSLDP IN-DP-CDSL-485-2008 NSDLDP IN-DP-NSDL-316-2009