1. Valuation Update1
Valuation Update
Telecom Egypt (TE) (ETEL.CA)
February 11th
2015
Fair Value: EGP 18.32 Recommendation: Strong BuyCurrent Price EGP 12.17
Ahmed Ramadan Ext: 441
Analyst
We upgraded our LTFV for TE to EGP 18.32/share from EGP 17.29/share
in our last update issued on June 19th
2014. Based on an expected total
return of 54% including an expected 2H2014 dividend yield of 3%, we
maintain our Strong Buy recommendation.
Financial Analysis
9M2014
TE’s consolidated bottom line dropped 25% to record EGP 1,794.2mn in
9M2014 compared to EGP 2,403.4mn in 9M2013.
The company’s consolidated revenues rose 8% to reach EGP 9,251.7mn in
9M2014 mainly due to an 11% increase in wholesale revenues that reached
EGP 5,305mn in addition to an 8% rise in retail revenues that recorded EGP
3,843.8mn.
The rise in wholesale revenues was driven mainly by a 61% jump in
international customers & networks business unit revenues that recorded
EGP 1,184.2mn in 9M2014 as a result of the growing and recurring wholesale
capacity sales and ancillary services revenues. TE is also in talks with several
international operators to establish new cables projects targeting a bigger
and more diversified business unit with a growing component of recurring
revenues. Domestic wholesale business unit revenues increased by 11%
to EGP 1,818.4mn in 9M2014 driven by the rise in demand for national
transmission services for mobile network operators (MNOs) and domestic
internet service providers (ISPs). However, international carriers affairs
business unit revenues declined 5% to reach EGP 2,302.5mn in 9M2014
due to the ongoing negative effects of illegal bypass combined with the
active rise of over-the-top (OTT) applications taking a sizable share of the
traditional business.
2013A 2014E
GPM 57.2% 58.9%
NPM 26.2% 18.5%
Debt/Equity - -
ROA 9.1% 6.7%
ROE 10.5% 7.8%
Ratios
Reuter’s code ETEL.CA
Sector Telecom
Financial Year December
Par Value EGP 10
52-week High/Low EGP 17.98/10.96
Avg. Daily Volume 926,793
Avg. Daily Turnover EGP 13,052,386
Paid in Capital EGP 17,070.7mn
# of Shares 1,707.1mn
Share Data
EGX30 Vs. Share Performance
0
2
4
6
8
10
12
14
16
18
Feb14Mar14Apr14May14Jun14
Jul14Aug14Sep14Oct14Nov14Dec14Jan15
EGP
-
1,000
2,000
3,000
4,000
5,000
6,000
7,000
8,000
9,000
10,000
11,000
ETEL EGX30 Index
Share Performance
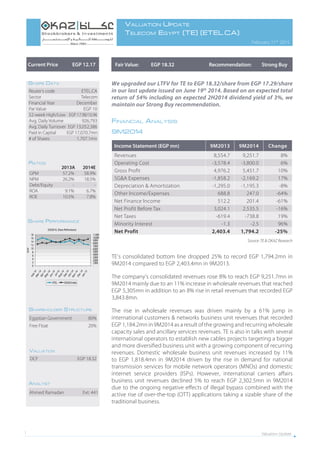
Income Statement (EGP mn) 9M2013 9M2014 Change
Revenues 8,554.7 9,251.7 8%
Operating Cost -3,578.4 -3,800.0 6%
Gross Profit 4,976.2 5,451.7 10%
SG&A Expenses -1,858.2 -2,169.2 17%
Depreciation & Amortization -1,295.0 -1,195.3 -8%
Other Income/Expenses 688.8 247.0 -64%
Net Finance Income 512.2 201.4 -61%
Net Profit Before Tax 3,024.1 2,535.5 -16%
Net Taxes -619.4 -738.8 19%
Minority Interest -1.3 -2.5 96%
Net Profit 2,403.4 1,794.2 -25%
Egyptian Government 80%
Free Float 20%
Shareholder Structure
DCF EGP 18.32
Valuation
Source: TE & OKAZ Research
2. Valuation Update2
The increase in TE’s retail revenues came as a natural outcome of a 13% rise in enterprise
solutions business unit revenues that reached EGP 1,508.3mn in 9M2014 due to growth
in enterprise data revenues that come from servicing the Egyptian SME sector, public
sector bodies, and financial industry. In 3Q2014, the enterprise solutions business
unit was able to generate healthy revenues capitalizing on the new fiber models now
installed in many Egyptian banks and a number of new urban community development
projects were finalized. In 9M2014, enterprise ADSL subscribers rose 23% over 9M2013 to
reach 116k while enterprise fixed line subscribers increased 2% to reach 1.08mn. Home
services business unit revenues increased 5% to reach EGP 2,335.4mn in 9M2014 backed
by the growth in home data revenues that compensated for the continuous decline in
home voice revenues with home ADSL subscribers rising 25% over 9M2013 to reach
1.814mn while home fixed line subscribers declined 3% to reach 5.56mn in 9M2014. In
general, while total fixed line subscribers fell 2% from 6.8mn in 9M2013 to 6.64mn in
9M2014, demand for high quality ADSL internet connections continued to strengthen
as TE Data’s total ADSL subscribers rose 25% from 1.542mn in 9M2013 to 1.930mn in
9M2014, giving TE Data a 64.8% market share.
TE’s operating costs rose 6% to reach EGP 3,800mn representing 41% of consolidated
revenues in 9M2014 compared to EGP 3,578.4mn representing 42% of consolidated
revenues in 9M2013. The company’s gross profit increased 10% to reach EGP 5,451.7mn
in 9M2014 with the GPM rising from 58% in 9M2013 to 59% in 9M2014.
SG&A expenses increased 17% to reach EGP 2,169.2mn in 9M2014 due to advertising
campaign expenses related to TE’s 160th
anniversary, the 10% annual salary increase
and the newly structured incentive rewards program. Depreciation and amortization
expenses fell 8% to EGP 1,195.3mn in 9M2014. Investment income from Vodafone Egypt
declined 15% to record EGP 600.5mn in 9M2014 compared to EGP 703.4mn in 9M2013.
Net finance income fell 61% to reach EGP 201.4mn as a result of lower fx gains and higher
financial assets impairment in 9M2014. Net taxes rose by 19% to record EGP 738.8mn in
9M2014. Finally, TE’s NPM declined significantly from 28% in 9M2013 to 19% in 9M2014.
Commercial Agreements with Mobile Operators
TE announced signing commercial agreements worth up to EGP 15bn with MobiNil and
Vodafone Egypt to provide infrastructure and international telecommunications services
commencing January 2015. The infrastructure services agreements duration reaches
5 years with MobiNil and 3 years with Vodafone Egypt. Meanwhile, the international
telecommunications services agreements duration reaches 4 years with both companies.
It is worth mentioning that the infrastructure services agreements shall provide TE with a
minimum of EGP 3bn in revenues over the agreements duration. Under the international
telecommunications agreements, TE will collect 35% of the services revenues; however,
both mobile operators have the right to end the agreements with TE incase any operator
obtains the international gateway license for all clients in the Egyptian market. In our
view, since these agreements are guaranteed revenues contracts, they are not expected
to have a material effect on the company’s top line since they are only reaffirming services
already provided by TE to both telecom operators.
National Company for Telecommunications & IT Infrastructure
The Ministry of Communications & Information Technology (MCIT) sent the draft of the
shareholders agreement to the telecom operators to establish the National Company
for Telecommunications & IT Infrastructure which will be responsible for digging works
and laying fiber optic cables in Egypt. TE’s ownership stake in the company will reach
around 5.5% after news that its request to increase its stake to 10% was refused by
3. Valuation Update3
the establishment committee. The mobile operators will also be represented in the
ownership structure and management of the national company which will be controlled
and supervised by the Ministry of Defense.
Revaluation of Investments
Sources in the press had mentioned possible plans by TE to sell its investments in several
companies. According to such sources, TE is currently seeking to choose a financial advisor
to valuate its stakes in these subsidiaries. TE had issued a request for proposal (RFP)
from financial institutions to valuate its investments including its 45% ownership stake
in Vodafone Egypt which according to the company was just a step to revaluate such
investments within TE’s investment strategy that aims at optimizing the management
of its investments. We did not include any possible divestments in our valuation of TE as
nothing concrete was released regarding that matter.
Integrated Telecom License
The Ministry of Communications & Information Technology (MCIT) had approved
offering TE the integrated telecom license without new frequencies to be able to provide
mobile services at EGP 2.5bn. TE will depend on local roaming through leasing networks
from the mobile operators until offering 4G frequencies which was supposed to be in
2016 but may be postponed due to several delays in the integrated telecom license.
According to TE, there is no official obligation on the company to divest its 45% stake
in Vodafone Egypt; however TE might sell its stake after acquiring the 4G frequencies in
order to avoid asset duplication. TE decided to pay the EGP 2.5bn integrated license cost
using part of its large excess cash position and expects to start providing mobile services
soon after acquiring the license, targeting to attract 5mn subscribers in the first year. We
expect the company to pay the EGP 2.5bn integrated license fee as a lump sum any time
in FY2015.
4G Frequencies
According to NTRA, the 4G frequencies license shall be offered to TE after 2 years from the
integrated license offering date. Due to the uncertainty behind such license where there
is no exact date or terms for the offering, we did not include it in our forecast. However,
we believe that by acquiring the new frequencies, TE will be able to operate its mobile
services business unit more efficiently through reducing operating costs on the long-run
by saving funds it would otherwise pay for leasing networks from mobile operators, in
addition to the higher anticipated demand on mobile broadband, which will have the
effect of increasing mobile revenues. Finally, as previously mentioned, it is important
to note that we did not include the scenario of selling TE’s stake in Vodafone Egypt in
our valuation since it is a general assembly decision that will depend on acquiring 4G
frequencies.
Financial Forecasts
We expect TE’s consolidated revenues to grow at a 5-year CAGR of 9% during the forecast
period FY2014-FY2018. Consolidated revenues are expected to rise by 9.2% to reach
EGP 12,335mn in FY2014 backed mainly by wholesale segment revenue growth. The
top line is then expected to increase by 12.3% to reach EGP 13,849.3mn in FY2015 as a
result of a forecasted pick up in retail segment revenues with the addition of the mobile
services business unit to further boost the segment’s top line. Finally, TE’s consolidated
revenues are then forecasted to increase at a declining rate starting FY2016 to reach EGP
17,375.8mn by FY2018.
4. Valuation Update4
Retail Segment
Retail segment revenues are forecasted to grow at a 5-year CAGR of 13% during the
forecast period FY2014-FY2018 as the company plans to aggressively capitalize on
broadband services growth that is expected to continue to more than compensate for
the decline in voice revenues in both the home services and enterprise solutions business
units. Moreover, the addition of the mobile services business unit to the retail segment
will further increase the segment’s top line. Retail segment revenues are expected to
account for 51% of TE’s top line (excluding other operating revenues) by FY2018 up from
43% in FY2013.
Wholesale Segment
Wholesale segment revenues are forecasted to grow at a 5-year CAGR of 6% during the
forecast period FY2014-FY2018. Domestic wholesale business unit revenues are expected
to witness declining growth rates starting FY2015. International customers and networks
business unit revenues are expected to witness considerable growth in FY2014, then
are expected to continue rising albeit at much slower rates during the remainder of
the forecast period. International carriers affairs business unit revenues are expected to
continue to decline as a result of the ongoing negative effects of illegal bypass combined
with the active rise of OTT applications which will continue to acquire a considerable
share of the traditional business. Wholesale segment revenues are expected to account
for 49% of TE’s top line (excluding other operating revenues) by FY2018 down from 57%
in FY2013.
Investor Table
Valuation
Our DCF valuation was based on the company’s projected free cash flow to firm (FCFF)
during the period from FY2014 to FY2018. FCFF during that period was discounted at
multiple WACCs that range between 18.50% and 18.66%, using a ß of 0.79 and a terminal
growth rate of 3%.
The DCF method led to a fair value of EGP 18.32/share.
Based on the share’s estimated total return of 54% including an expected dividend yield
of 3% (representing the yield of the remainder of the EGP 0.75/share cash dividend
expected for FY2014 after the company had already paid a USD 0.05/share “EGP 0.36/
share” cash dividend for 1H2014), we maintain our Strong Buy recommendation.
Investor Analysis 2013A 2014E 2015F 2016F
Revenues (EGP mn) 11,293.0 12,335.0 13,849.3 15,286.2
Revenue Growth 10% 9% 12% 10%
Net Profit (EGP mn) 2,958.6 2,279.5 2,337.2 2,599.2
Net Profit Growth 13% -23% 3% 11%
EPS (EGP) 1.73 1.34 1.37 1.52
DPS (EGP) 1.00 0.75 1.00 1.20
Dividend Yield 8.2% 6.2% 8.2% 9.9%
P/E 7.0 9.1 8.9 8.0
P/BV 0.7 0.7 0.7 0.7
Source: TE & OKAZ Research
6. Valuation Update6
Financials & Ratios
Income Statement (EGP mn) 2013A 2014E 2015F 2016F
Revenues 11,293.0 12,335.0 13,849.3 15,286.2
Operating Cost -4,831.1 -5,066.4 -6,167.4 -6,962.1
Gross Profit 6,461.9 7,268.6 7,682.0 8,324.1
SG&A Expenses -2,623.1 -2,892.2 -3,289.3 -3,632.4
Depreciation & Amortization -1,694.6 -1,596.6 -1,601.8 -1,602.8
Other Income/Expenses 1,566.6 395.7 502.5 595.3
Net Interest 42.3 45.7 50.1 34.1
Net Profit Before Tax 3,753.0 3,221.2 3,343.4 3,718.3
Net Taxes -792.4 -938.6 -1,003.0 -1,115.5
Minority Interest -1.9 -3.2 -3.2 -3.6
Net Profit 2,958.6 2,279.5 2,337.2 2,599.2
Balance Sheet (EGP mn) 2013A 2014E 2015F 2016F
Cash & Equivalents 5,761.6 5,977.5 4,215.5 5,331.3
Accounts Receivable 3,386.0 3,720.3 4,180.1 4,616.1
Inventories 458.6 487.9 548.2 605.4
Other Current Assets 1,424.1 1,854.1 2,083.2 2,300.5
Total Current Assets 11,030.4 12,039.8 11,027.0 12,853.4
Net Fixed Assets 11,243.4 10,896.9 10,545.0 9,792.2
Other Long Term Assets 10,364.5 11,131.5 13,631.5 13,631.5
Total Assets 32,638.3 34,068.2 35,203.5 36,277.1
Short Term Debt 107.2 72.2 47.2 32.2
Accounts Payable 636.2 731.9 822.3 908.1
Other Current Liabilities 2,604.3 2,927.5 3,289.3 3,632.4
Total Current Liabilities 3,347.7 3,731.5 4,158.8 4,572.7
Long Term Debt 475.3 380.3 305.3 255.3
Other Long Term Liabilities 499.0 637.8 787.8 942.8
Total Liabilities 4,322.0 4,749.6 5,251.8 5,770.7
Total Common Equity Including Minority 28,316.3 29,318.6 29,951.7 30,506.3
Total Liabilities and Equity 32,638.3 34,068.2 35,203.5 36,277.1
Ratios 2013A 2014E 2015F 2016F
Liquidity
Current Ratio 3.3 3.2 2.7 2.8
Quick Ratio 3.2 3.1 2.5 2.7
Efficiency
Accounts Receivable Turnover 3.3 3.3 3.3 3.3
Average Collection Period 109 110 110 110
Fixed Assets Turnover 1.0 1.1 1.3 1.6
Debt
Debt Ratio 0.1 0.1 0.1 0.2
Profitability
Revenue Growth 9.5% 9.2% 12.3% 10.4%
GPM 57.2% 58.9% 55.5% 54.5%
Net Profit Growth 12.9% -23.0% 2.5% 11.2%
NPM 26.2% 18.5% 16.9% 17.0%
ROA 9.1% 6.7% 6.6% 7.2%
ROE 10.5% 7.8% 7.8% 8.5%
Source: TE & OKAZ Research
7. Valuation Update7
Recommendation Guidelines
The Fair Value calculation is mainly based upon absolute valuation methodologies; DCF,
WEV and/or NAV, it can sometimes include relative valuation methodologies (multiples).
Fair Value
Recommendation
Sell < 020% > Hold ≥035% > Buy ≥ 20%Strong Buy ≥35%
Our rating system is based on estimated total return which is calculated using expected
price appreciation/depreciation as well as expected cash dividend distributions during the
coming 12-months.
Rating
8. Valuation Update8
OKAZ Stockbrokers & Investments on behalf of itself has prepared this publication, solely for its internal use and for the information of its clients.
This publication is not intended for use as an invitation, offer or solicitation for the purchase and/or sale of any financial instrument/tool. The
information contained herein was presented on a best effort basis regarding its accuracy and completeness and is subject to change without
notice. Accordingly OKAZ Stockbrokers and Investments along with any member of its staff DOES NOT accept any liability whatsoever for any direct
and or indirect loss resulting from the use of this publication or its content. Copyright OKAZ Stockbrokers & Investments. All rights reserved. No
part of this publication may be transmitted in any form or means without prior consent.
Disclaimer
Sales
Maher Farahat
maher@okazinvest.com
Walid Abd-El-Maguid
walid@okazinvest.com
Samar Soliman
samar@okazinvest.com
Nesma El Sebaay
nelsebaay@okazinvest.com
OKAZ Stockbrokers & Investments
Head Office
35, Emad El-Din St., Cairo
Tel: 202-25914741 / 25918955 / 25895321
Fax: 202-25891499
www.okazinvest.com
Enas Salama
Senior Financial Analyst
enas@okazinvest.com
Soliman Said
Financial Analyst
soliman@okazinvest.com
Research
Sherif El Essaily, MBA
Head of Research
selessaily@okazinvest.com
Ahmed Ramadan
Financial Analyst
asayed@okazinvest.com
Nirvana Haggagy, CPM
Administrator
research@okazinvest.com