Download to read offline
![International Journal of Innovative Research in Advanced Engineering (IJIRAE) ISSN: 2349-2163
Issue 04, Volume 4 (April 2017) (SPECIAL ISSUE) www.ijirae.com
______________________________________________________________________________________________________
IJIRAE: Impact Factor Value – SJIF: Innospace, Morocco (2016): 3.916 | PIF: 2.469 | Jour Info: 4.085 |
ISRAJIF (2016): 3.715 | Indexcopernicus: (ICV 2015): 47.91
IJIRAE © 2014- 17, All Rights Reserved Page -150
TABLE 1- MECHANICAL PROPERTIES OF ASTM A36.
MODULUS OF ELASTICITY (E) MPA 200000
TENSILE STRENGTH (UT) MPA 400-550
YIELD STRENGTH (Y) MPA 250
HARDNESS, HB 168
FATIGUE STRENGTH EXPONENT (B) -0.073
POISSON’S RATIO 0.26
IV. DETERMINATION OF FATIGUE LIFE OF HOLLOW TUBE USING ANALYTICAL METHOD.
A. FACTORS AFFECTING FATIGUE LIFE.
It is found that the endurance limit of the component prepared in the laboratory test conditions will be closely controlled and
more often it is unrealistic. Hence various correction factors like surface finish, environment, temperature, reliability etc., need
to be considered for the actual condition. Hence the equation for the correction factors for the endurance limit is given as,[1]
e = Cload* Csize* Csurf* Ctemp* Creliab* ’e (1)
Where, Csurf = surface condition correction factor.
Cload= load correction factor.
Csize = size correction factor.
Ctemp = temperature correction factor.
Creliab = reliability correction factor.
’e = endurance limit of the test specimen.
e = endurance limit of the actual component.
Csurf = A (ut)b
Where ut is ultimate tensile strength, A and b are found from table 2.
TABLE 2- COEFFICIENTS FOR SURFACE MODIFICATION EQUATION.
In this case from table 2 we have considered as Hot rolled condition for the surface and the corresponding value of ‘A’ and ‘b’
for this is, A=57.7 and b= -0.718
Csurf = 0.6217
Cload = 1
Csize = 0.6
Ctemp = 1
Creliab = 1
’e = 0.5 ut
’e = 275 MPa
Substituting all the correction factor values in equation (1)
e = 102.58 MPa
B. Fatigue loading.
Simplest way of loading observed is the constant amplitude loading with sinusoidal stress-time pattern shown in Fig.4 below.
Useful terms required for fatigue life calculations are shown in the Fig.4 with respect to constant amplitude loading.
Fig.4: Constant amplitude loading.
SURFACE FINISH A (MPA) B
GROUND 1.58 -0.085
MACHINED OR COLD-DRAWN 4.51 -0.265
HOT-ROLLED 57.7 -0.718
AS- FORGED 272 -0.995](https://image.slidesharecdn.com/33-170427050023/75/FATIGUE-ANALYSIS-OF-VARIABLE-DIFFUSER-3-2048.jpg)
![International Journal of Innovative Research in Advanced Engineering (IJIRAE) ISSN: 2349-2163
Issue 04, Volume 4 (April 2017) (SPECIAL ISSUE) www.ijirae.com
______________________________________________________________________________________________________
IJIRAE: Impact Factor Value – SJIF: Innospace, Morocco (2016): 3.916 | PIF: 2.469 | Jour Info: 4.085 |
ISRAJIF (2016): 3.715 | Indexcopernicus: (ICV 2015): 47.91
IJIRAE © 2014- 17, All Rights Reserved Page -151
Where, m = Mean stress
max minσ + σ
2
max = Maximum stress in the cycle
min = Minimum stress in the cycle
a= Alternating stress
amplitude
r = Range of stress max minσ σ
R = Stress ratio
A = Amplitude ratio
σ 1
σ 1
a
m
R
R
C. FATIGUE LIFE CALCULATIONS
Fatigue life calculation for cylindrical hollow tube is considered for validation.In the case of circular pressurized thin pipes two
types of stresses will be acting one the Hoop stress or circumferential stress and other Axial stress. In case of diffuser axial
stresses are zero and only hoop stresses need to be considered. Hoop stress is calculated by eqn. (2).
H =
(2)
H = 200 MPa.
From Basquin’s equation, f = aNb
(3)
Where, N is the number of cycles to failure, ‘a’ and ‘b’ are constants,
a = coefficient and represents the value of a at one cycle.
b = slope of log-log S-N curve.
f = applied fatigue stress.
Thus ‘a’ and ‘b’ are found from the equations below.[2]
=
−1
3
log
( )
b = -0.2237.
=
( )
a = 2257.76 MPa.
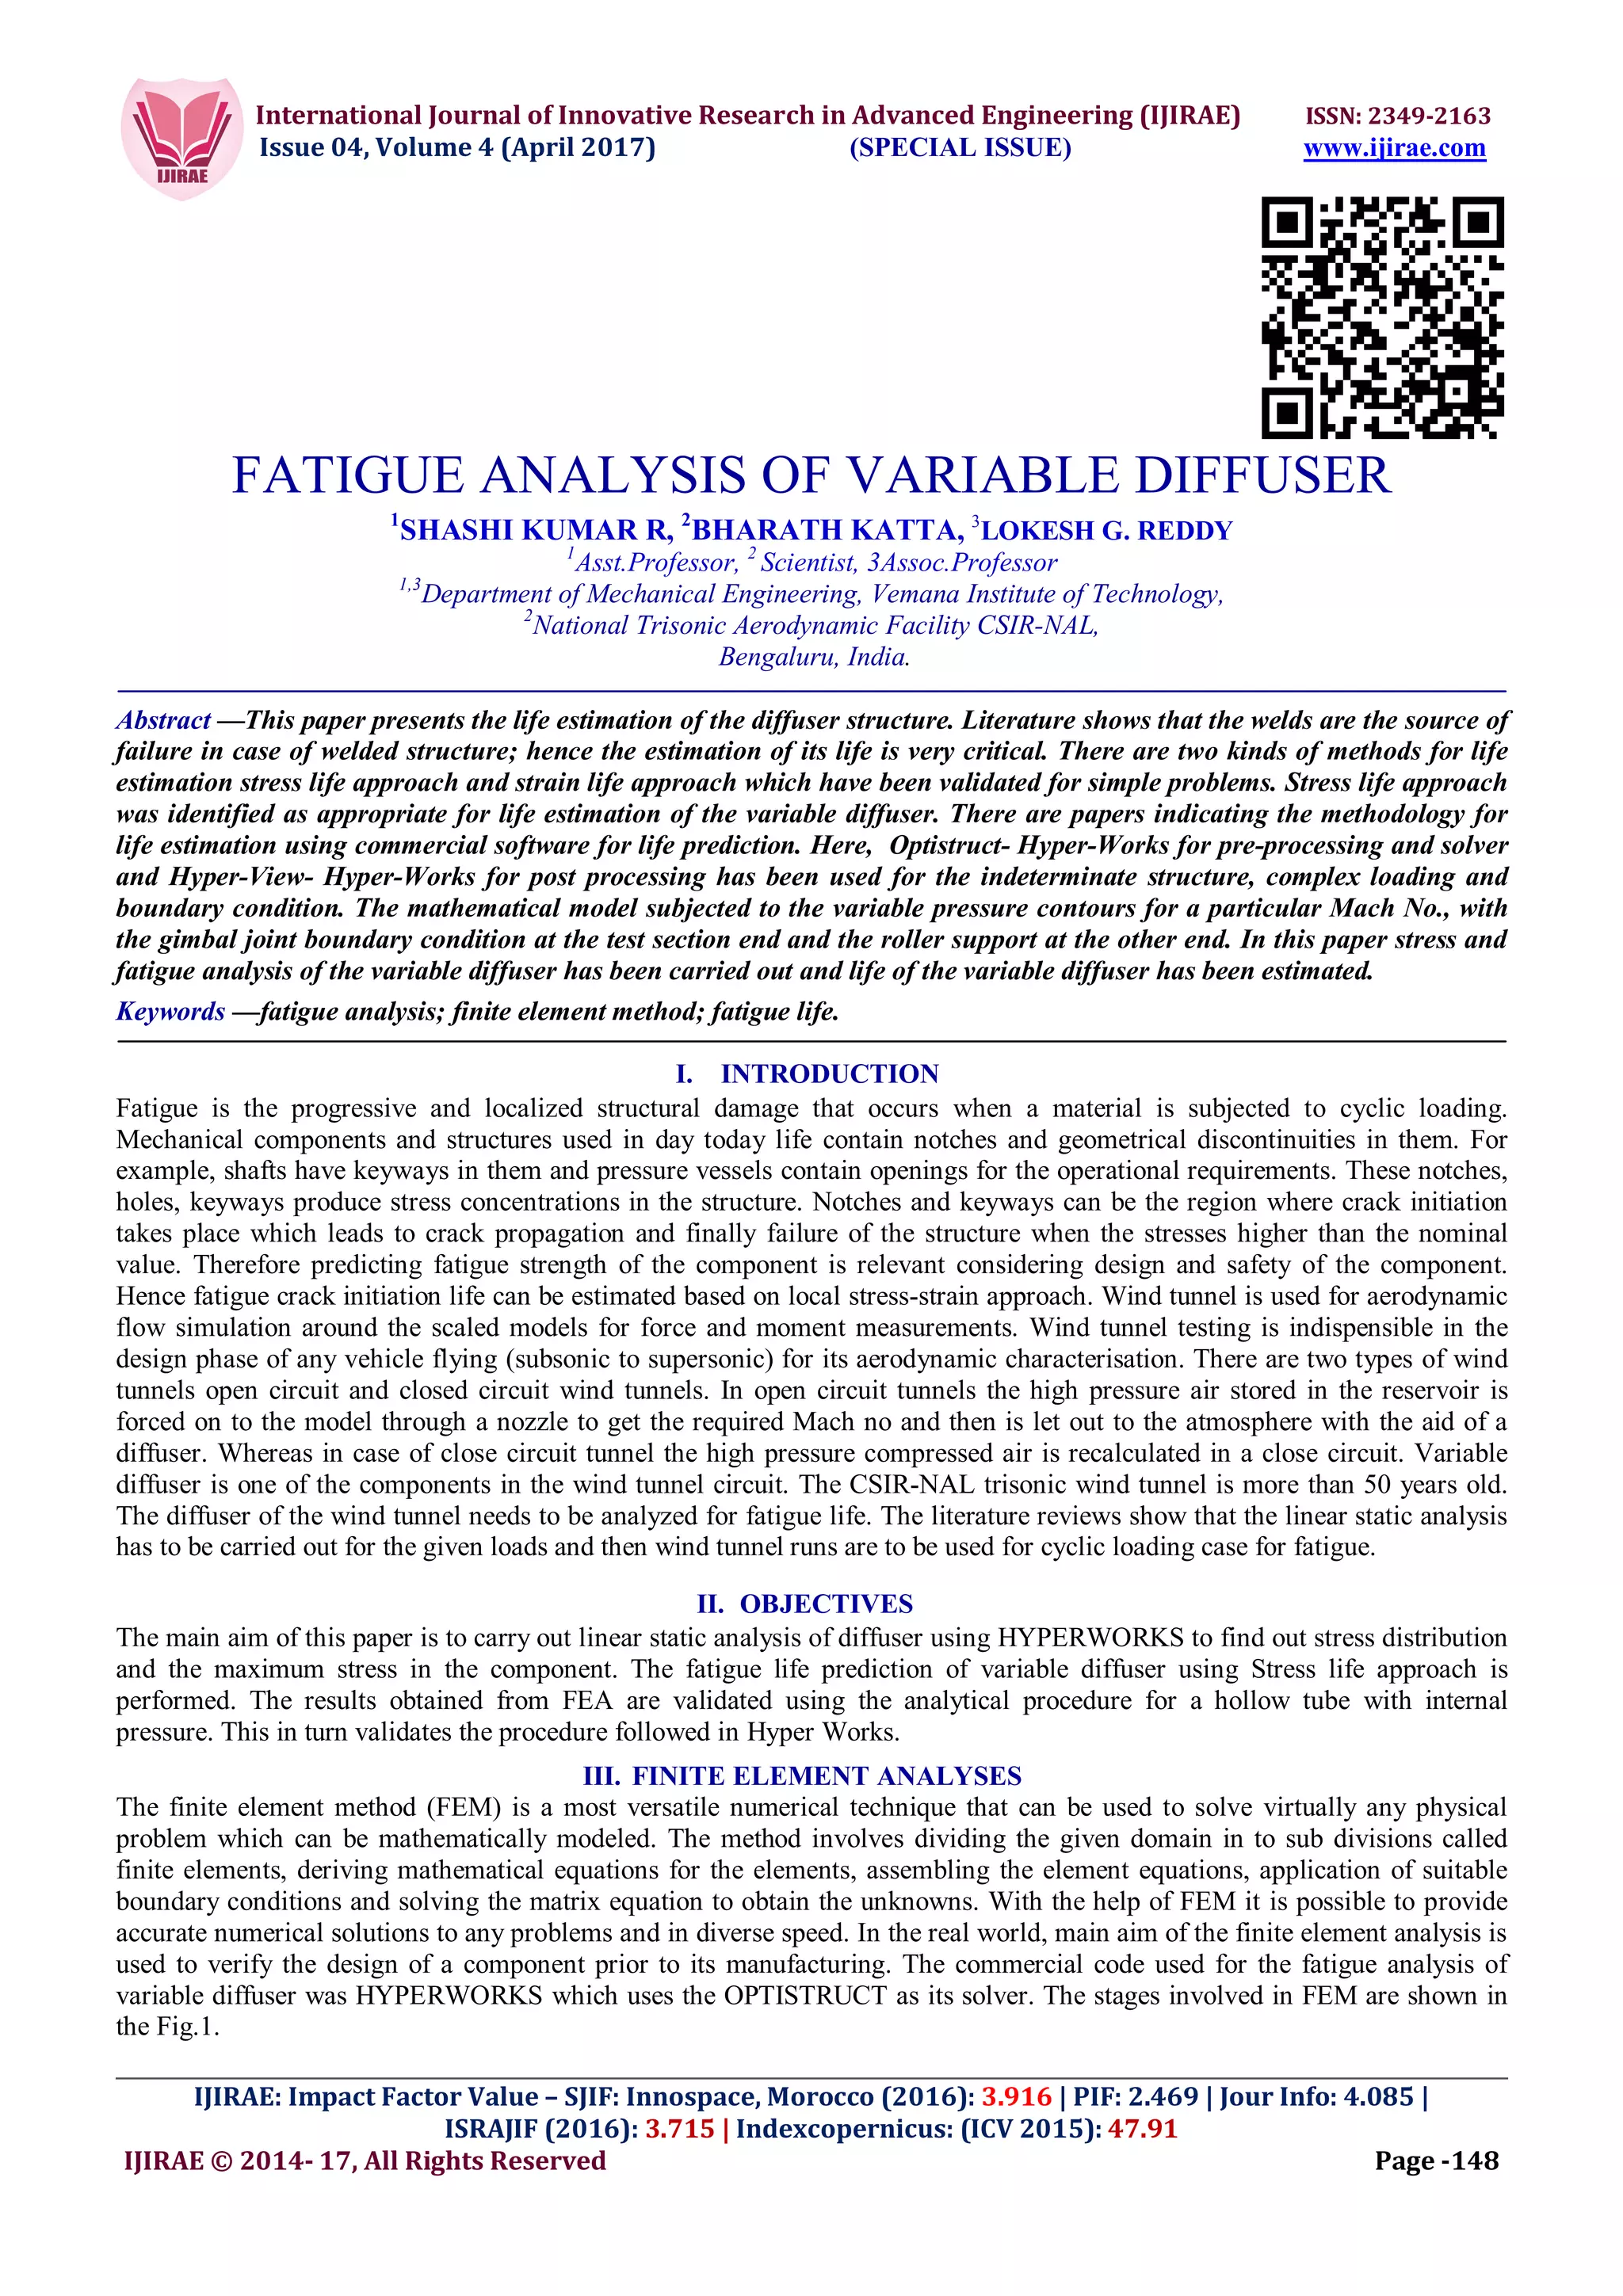
Value of ‘f’ is obtained from the Fig.5 based on the ultimate tensile strength of the material. This is known as fatigue strength
fraction. i.e., f= 0.875.
Fig.5: Fatigue strength fraction (f) for various ultimate tensile strength.
Rewriting equation (3), the number of cycles for failure can be expressed as [2]
max minσ -σ
2
min
max
σ
σ
482 551 620 689 758 827 896 965 1034 1103 1172 1241 1310 1378
σutMPa](https://image.slidesharecdn.com/33-170427050023/75/FATIGUE-ANALYSIS-OF-VARIABLE-DIFFUSER-4-2048.jpg)
![International Journal of Innovative Research in Advanced Engineering (IJIRAE) ISSN: 2349-2163
Issue 04, Volume 4 (April 2017) (SPECIAL ISSUE) www.ijirae.com
______________________________________________________________________________________________________
IJIRAE: Impact Factor Value – SJIF: Innospace, Morocco (2016): 3.916 | PIF: 2.469 | Jour Info: 4.085 |
ISRAJIF (2016): 3.715 | Indexcopernicus: (ICV 2015): 47.91
IJIRAE © 2014- 17, All Rights Reserved Page -156
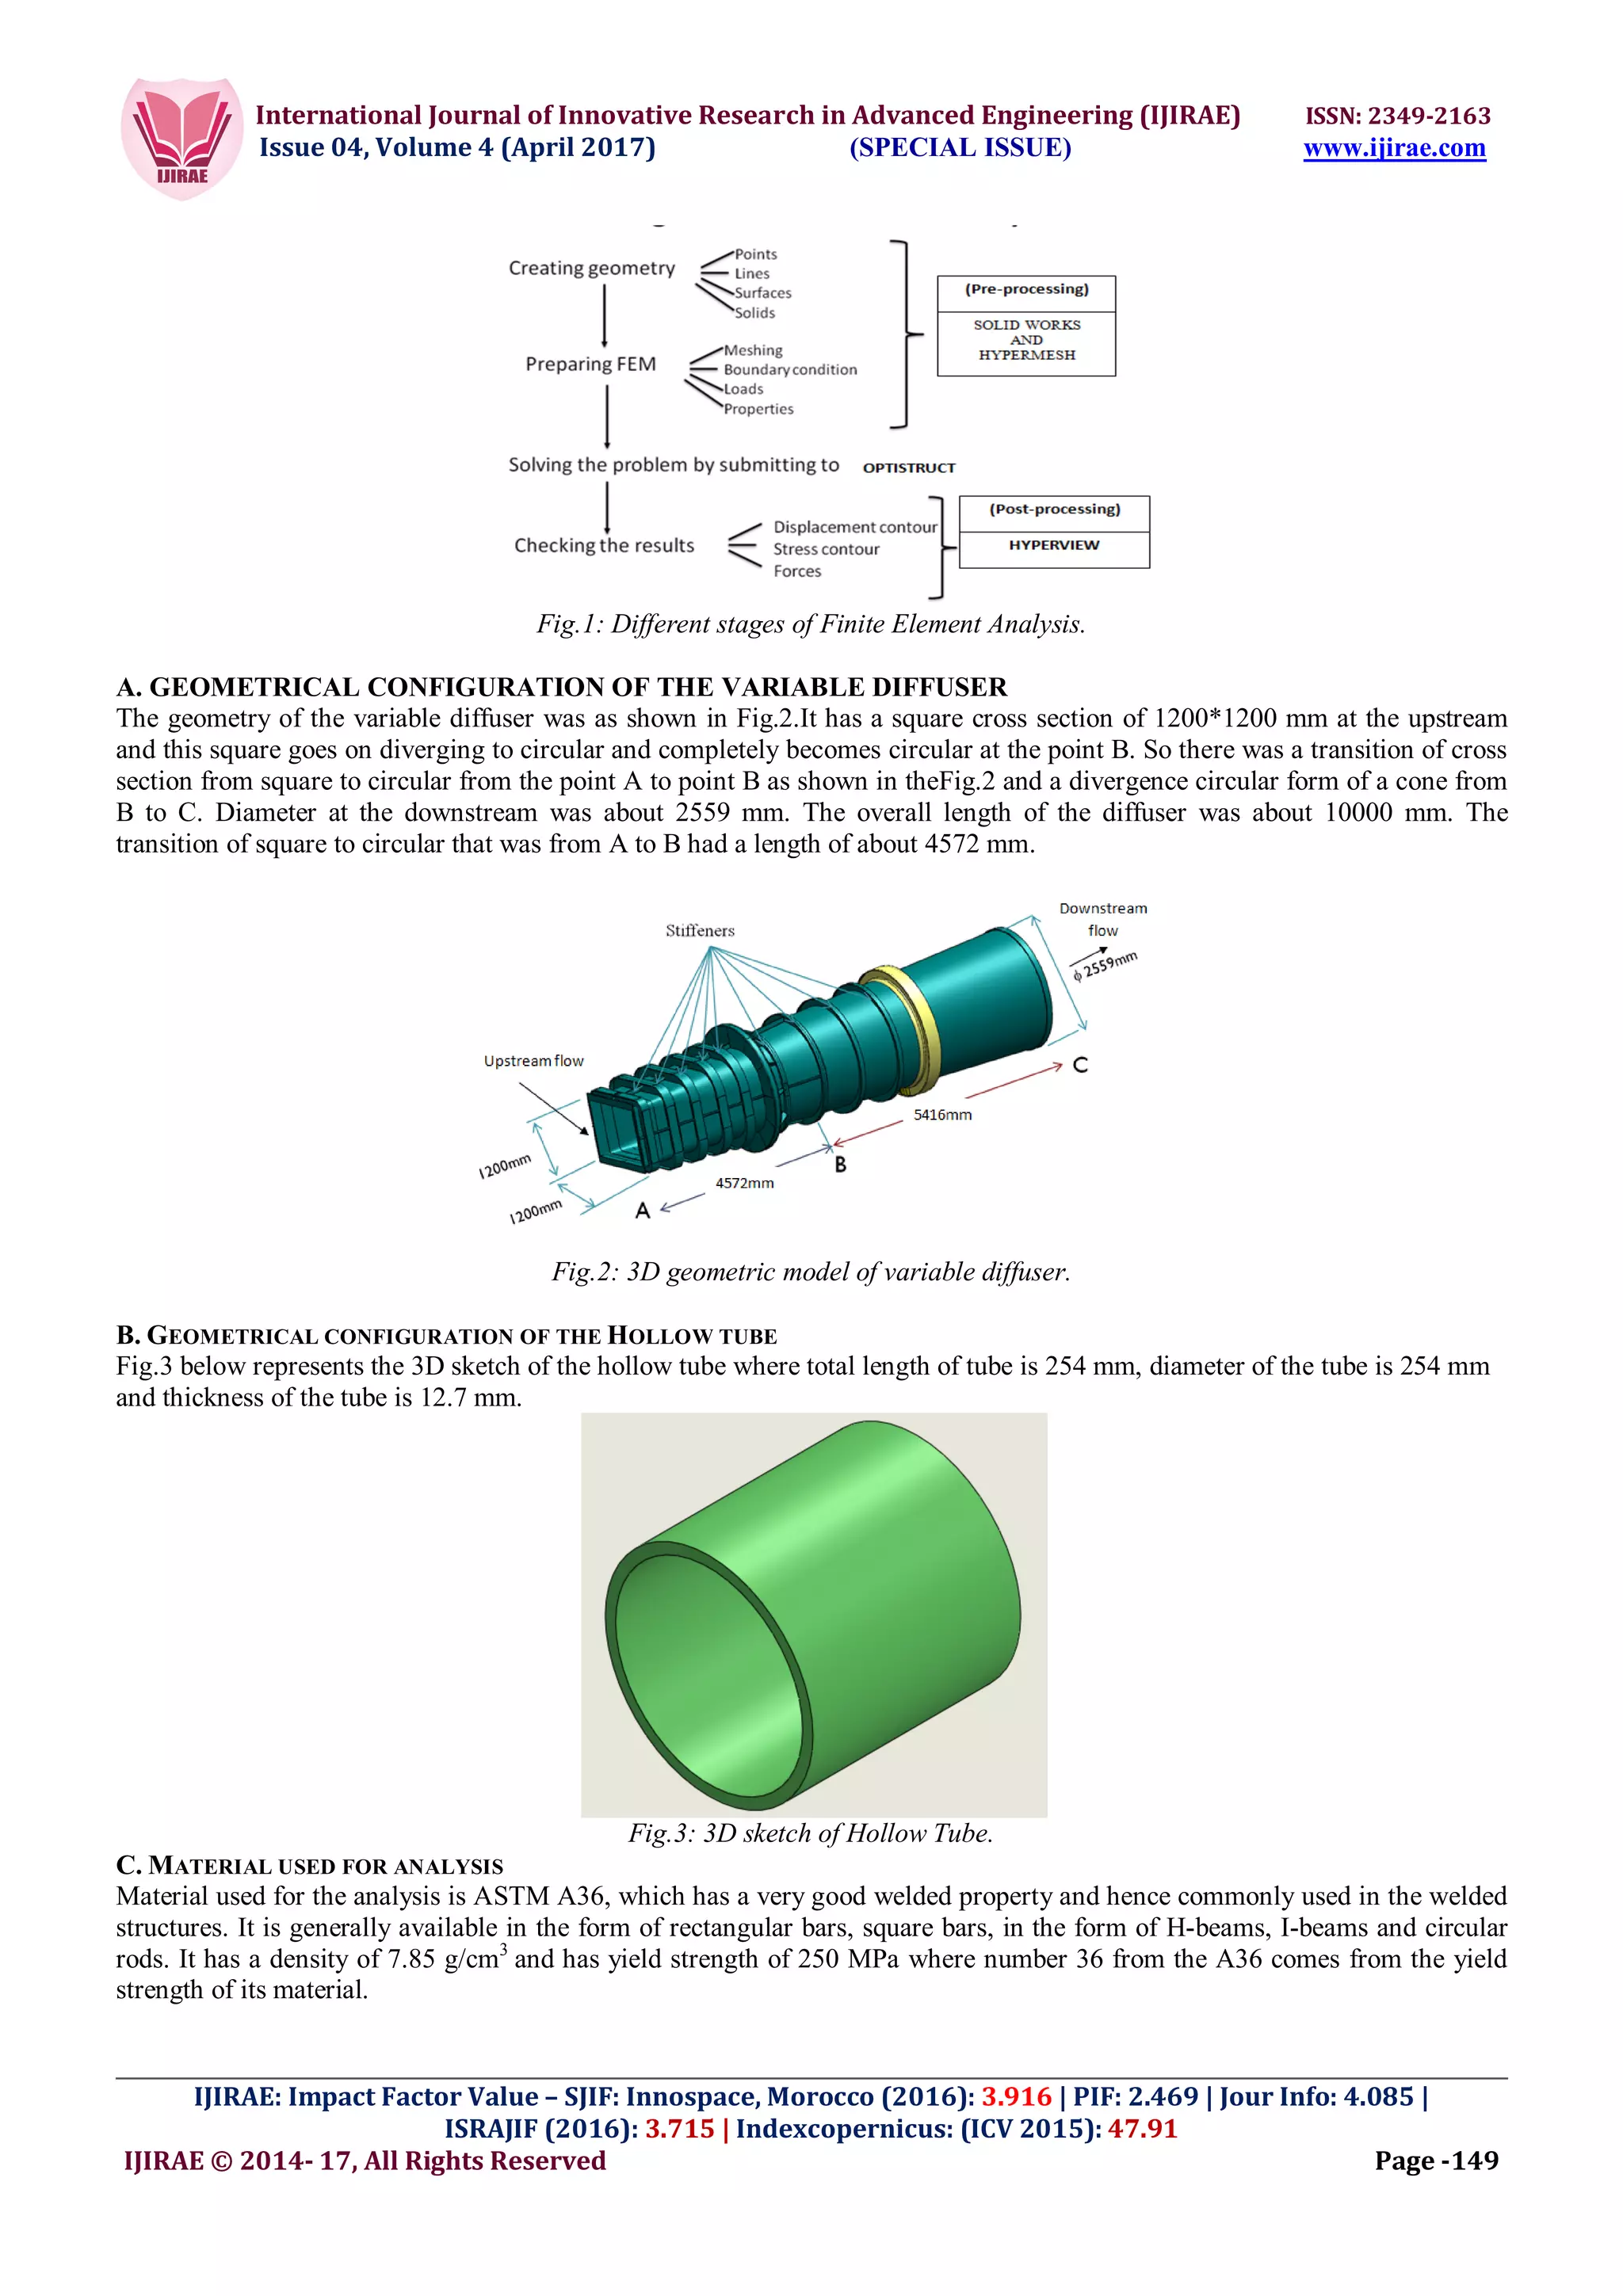
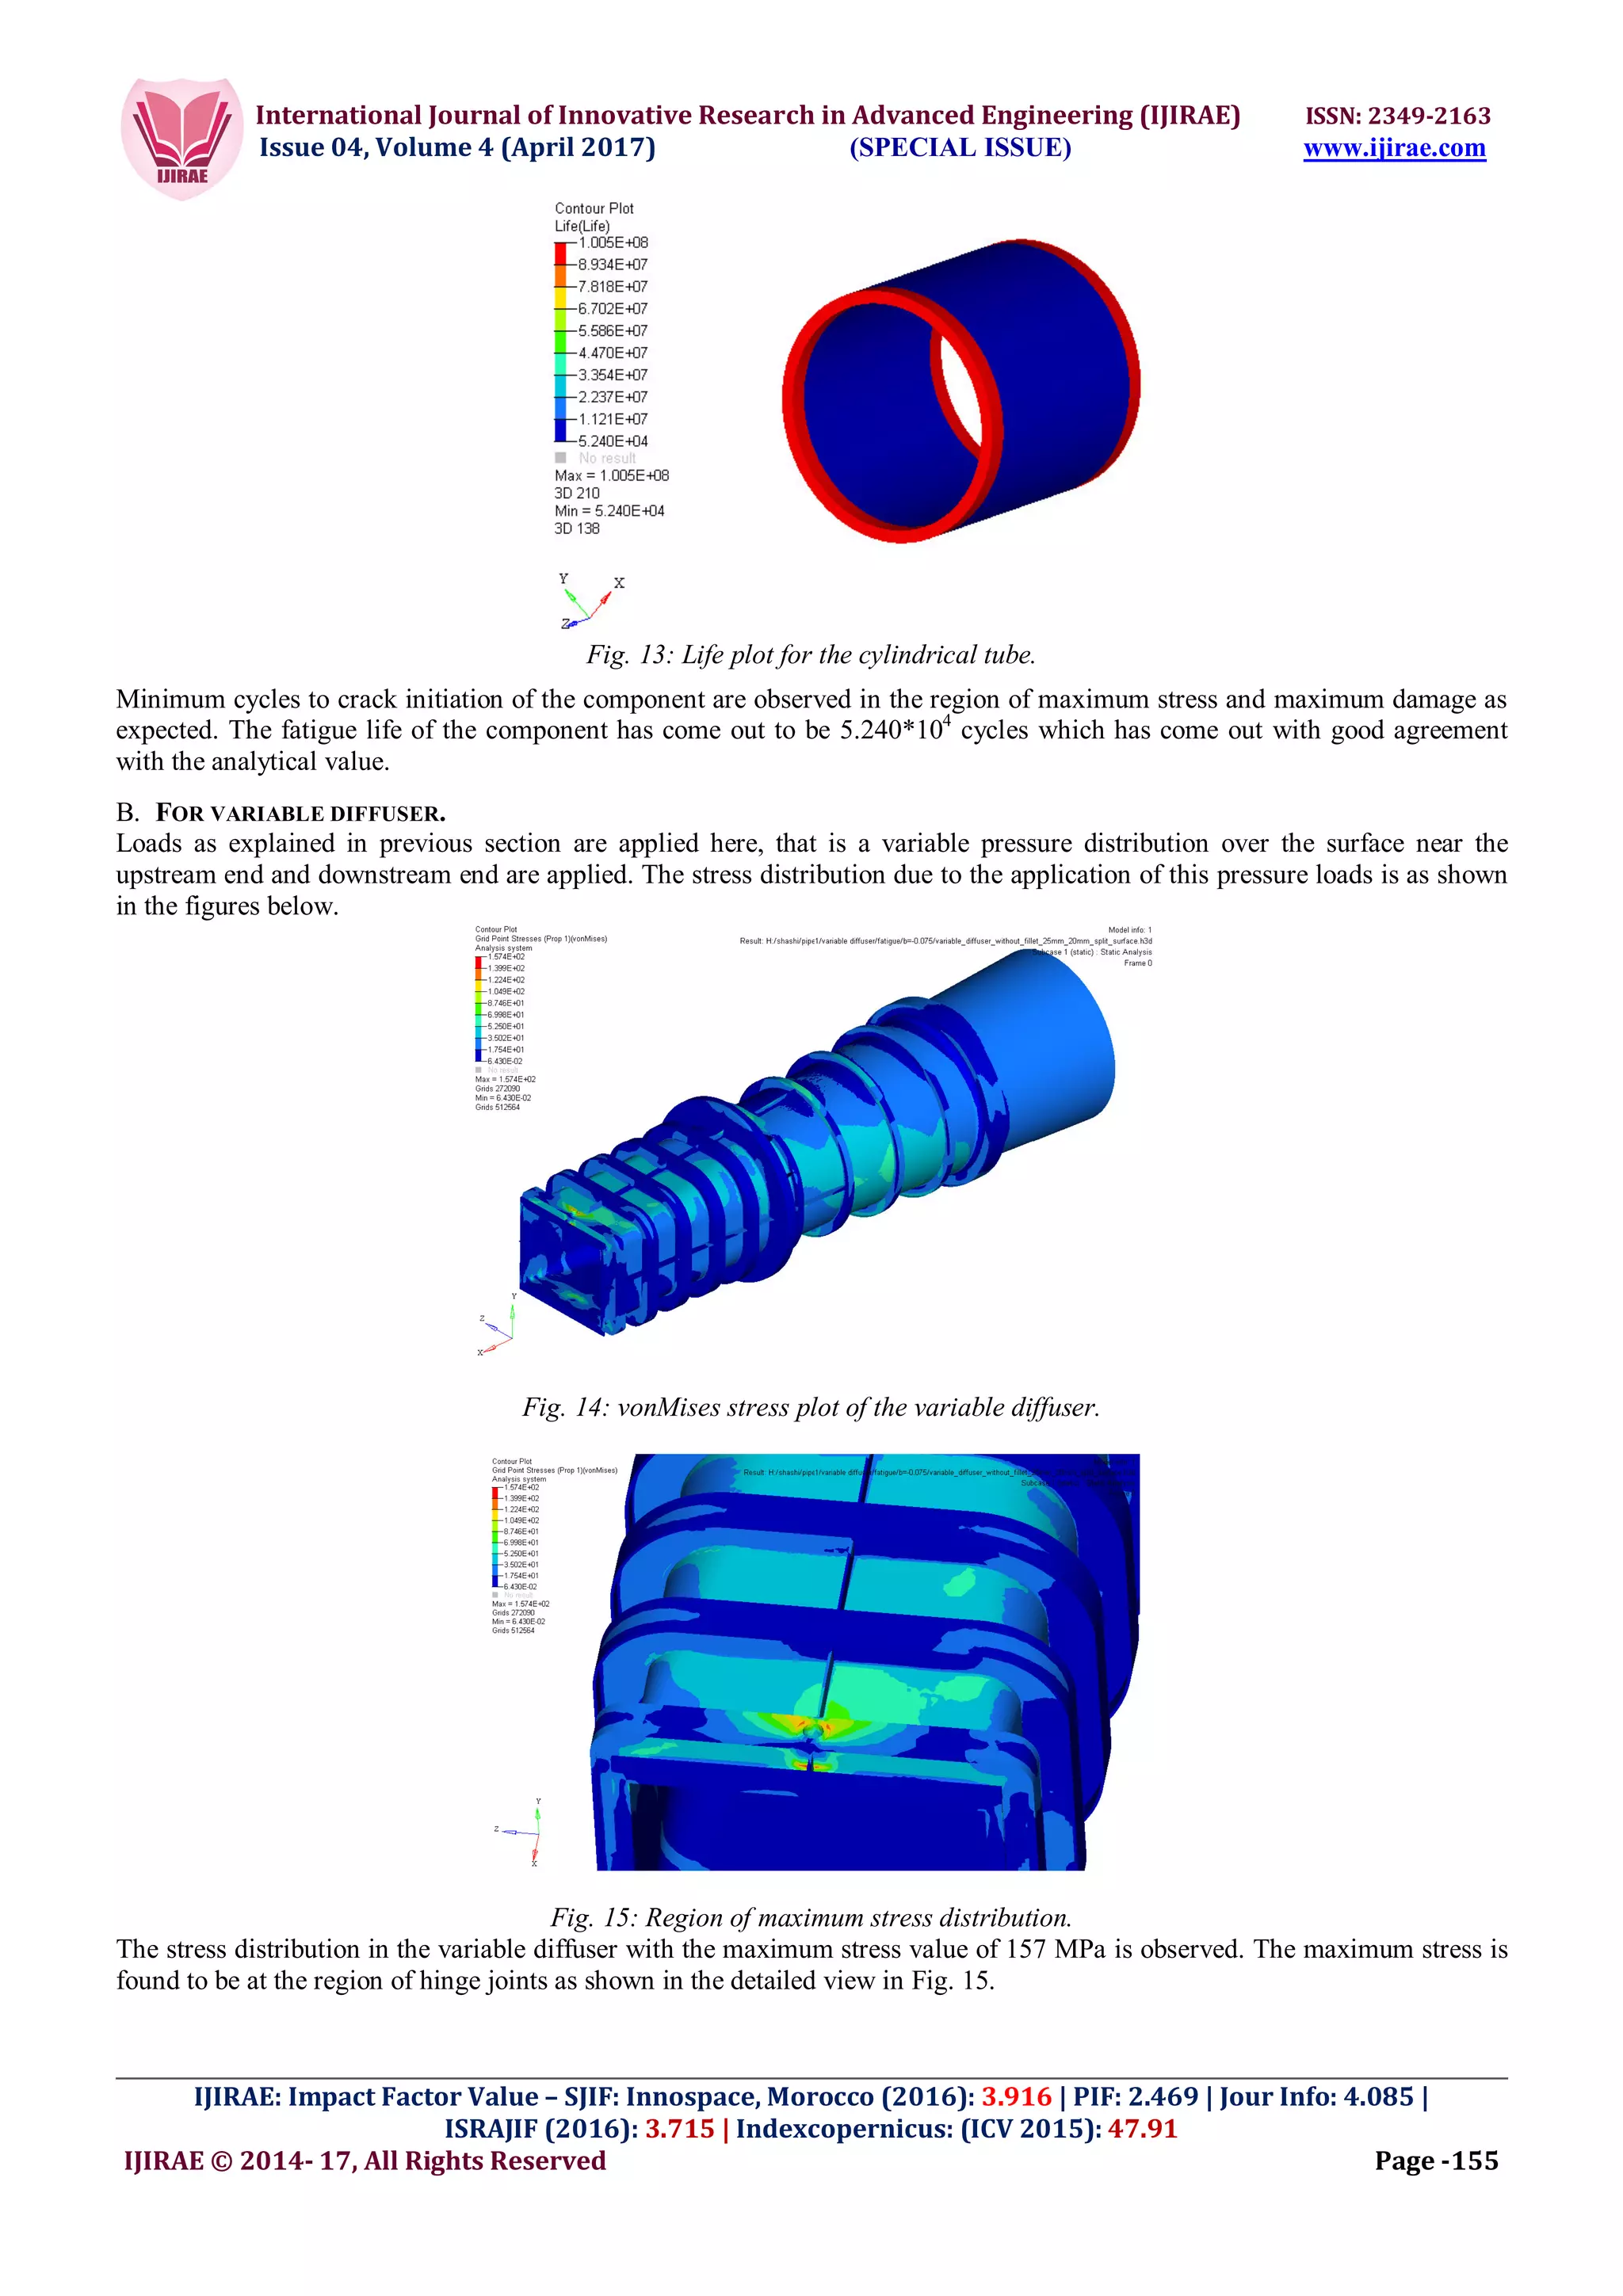
Fig. 16: Region of minimum life at pin hole.
The crack initiation life of the variable diffuser is found to be 4.29*104
cycles. Fig. 16 shows the region of crack initiation,
which is similar to the region of maximum stress distribution. The fatigue life to crack initiation is 104
cycles; hence the
component is in the region of high cycle fatigue of the S-N curve. Relatively other regions than at hinge shows the infinite life
of the component that is more than 106
cycles for the given static pressure distribution case.
TABLE 7- SHOWS THE OUTPUT RESULTS OF HOLLOW CYLINDRICAL TUBE.
VII. CONCLUSIONS
Based on literature the stress life method has been used to find the fatigue life of the components. The verification problem of a
hollow cylindrical tube carried out using finite element analysis (Hyper Works) and by the analytical approach has a result
convergence of around 95%. The stress distribution in the variable diffuser and the maximum stress region acting in the
component is determined for pressure distribution of Mach 3 load case. The maximum stress of 157 MPa is found at the pin
hole and the minimum life to crack initiation is found to be 4.29*104
cycles at the region of pin hole where maximum stress
region is found.
VIII.REFERENCES
[1]. R. A. Gujar, S. V. Bhaskar, “Shaft design under fatigue loading by using modified Goodman method”, Int. J. Engg. Ress.
App. (IJERA) ISSN: 2248-9622, Vol. 3, Issue 4, Jul-Aug 2013, pp.1061-1066.
[2]. Ankit Dhyani, “Fatigue life estimation using Goodman diagram”, International Journal of Aerospace and Mechanical
Engineering,ISSN: 2393-8609,Volume 2 – No.4, June 2015.
[3]. Qasim Bader, Emad Kadum, “Mean stress correction effects on the fatigue life behavior of steel alloys by using stress life
approach theories”, International Journal of Engineering & Technology IJET-IJENS, Vol. 14.
[4]. Mahesh L. Raotole, Prof. D. B. Sadaphale, Prof. J. R.Chaudhari, “Prediction of Fatigue Life of Crank Shaft using S-N
Approach”, International Journal of Emerging Technology and Advanced Engineering, ISSN 2250-2459, ISO 9001:2008
Certified Journal, Volume 3, Issue 2, February 2013.
[5]. Yogesh. B. Dupare, Raju.B.Tirpude and Akshay.Y.Bharadbhunje, “Fatigue analysis in connecting rod using Ansys”,
International Journal of Modern Trends in Engineering, ISSN: 2349-9745, Volume 02, February – 2015.
[6]. Qasim Bader and Emad K. Njim, “Effect of Stress Ratio and V Notch Shape on Fatigue Life in Steel Beam”,
International Journal of Scientific & Engineering Research, ISSN 2229-5518, Volume 5, Issue 6, June-2014.
[7]. A. Chattopadhyay, G. Glinka, M. El-Zein, J. Qian and R. Formas, “Stress analysisand fatigueof welded structures” Doc.
IIW-2201, recommended for publication by Commission XIII “Fatigue of Welded Components and Structure.”
[8]. Tso-Liang Teng and Peng-Hsiang Chang, “Fatigue Crack Initiation Life Prediction for a Flat Plate with a Central Hole”,
journal of C.C.I.T. Vol.32 no.1 Nov. 2003.
COMPONENT PRESSURE DISTRIBUTION
FOR MACH NO.
PRESSURE IN
MPA
MAX. VONMISES
STRESS IN MPA
FATIGUE LIFE
(CYCLE)
FEA FEA
Variable diffuser 3 0.0405-0.1676 157 4.29*104](https://image.slidesharecdn.com/33-170427050023/75/FATIGUE-ANALYSIS-OF-VARIABLE-DIFFUSER-9-2048.jpg)

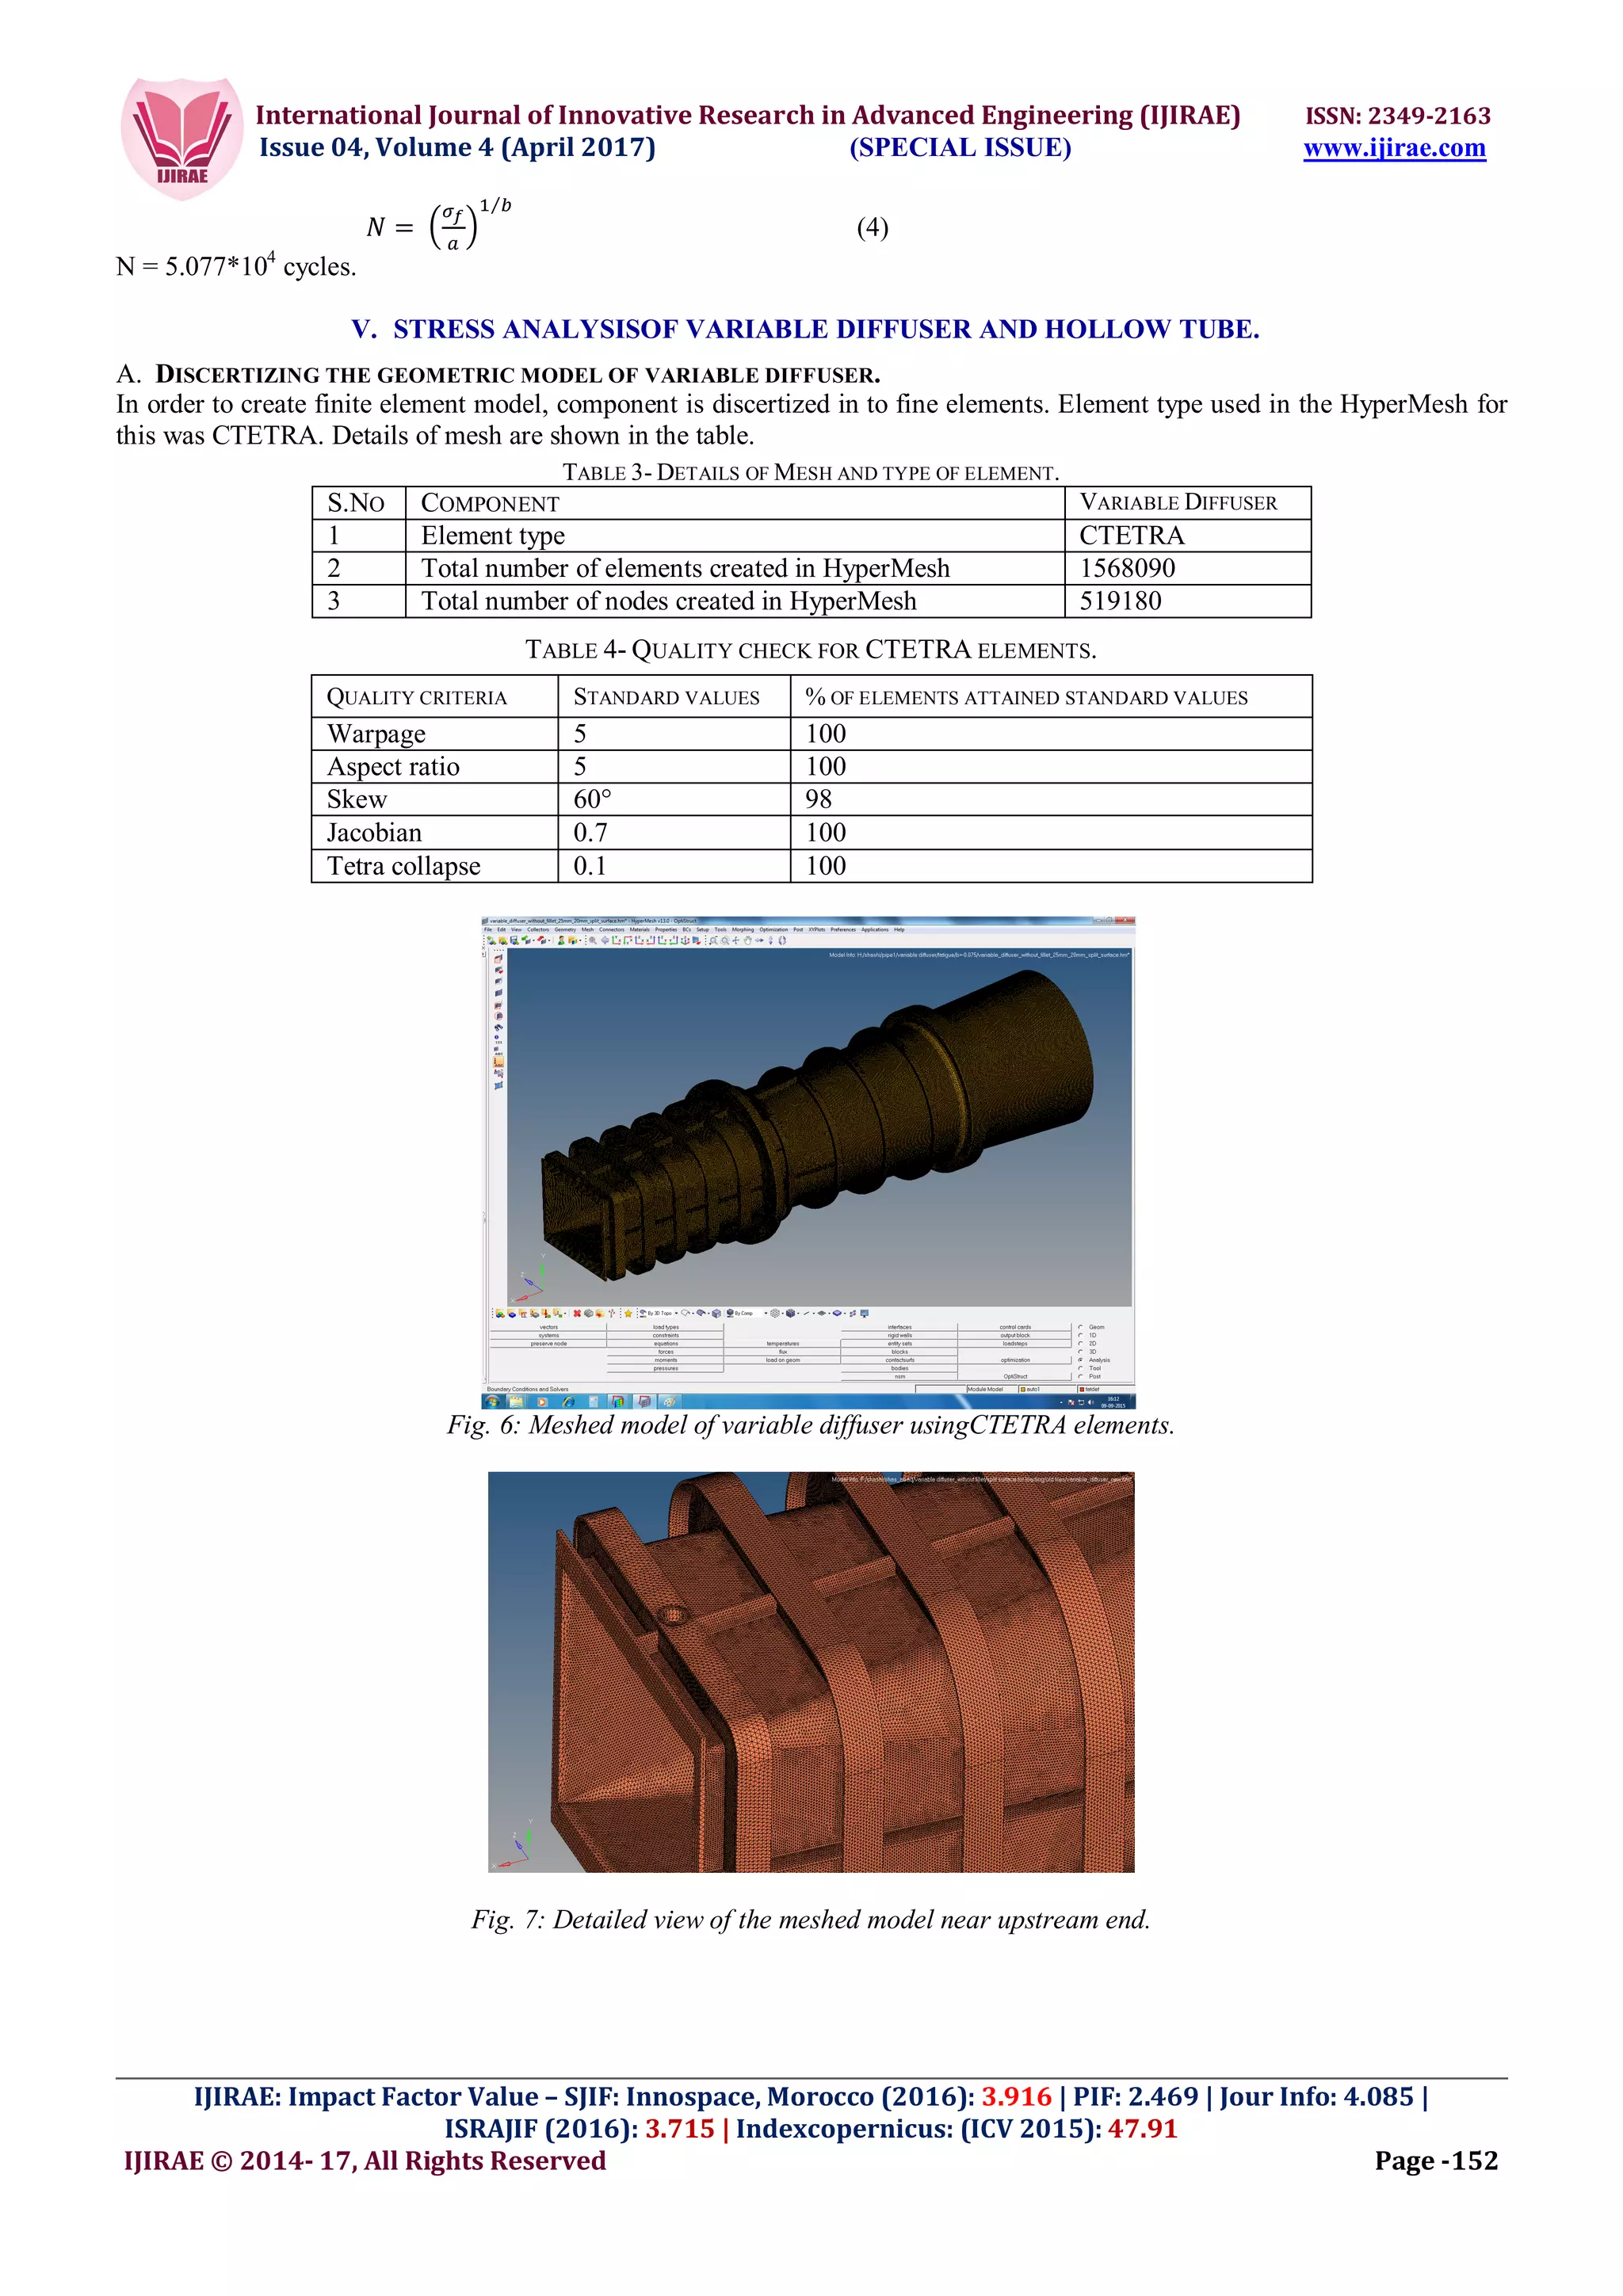
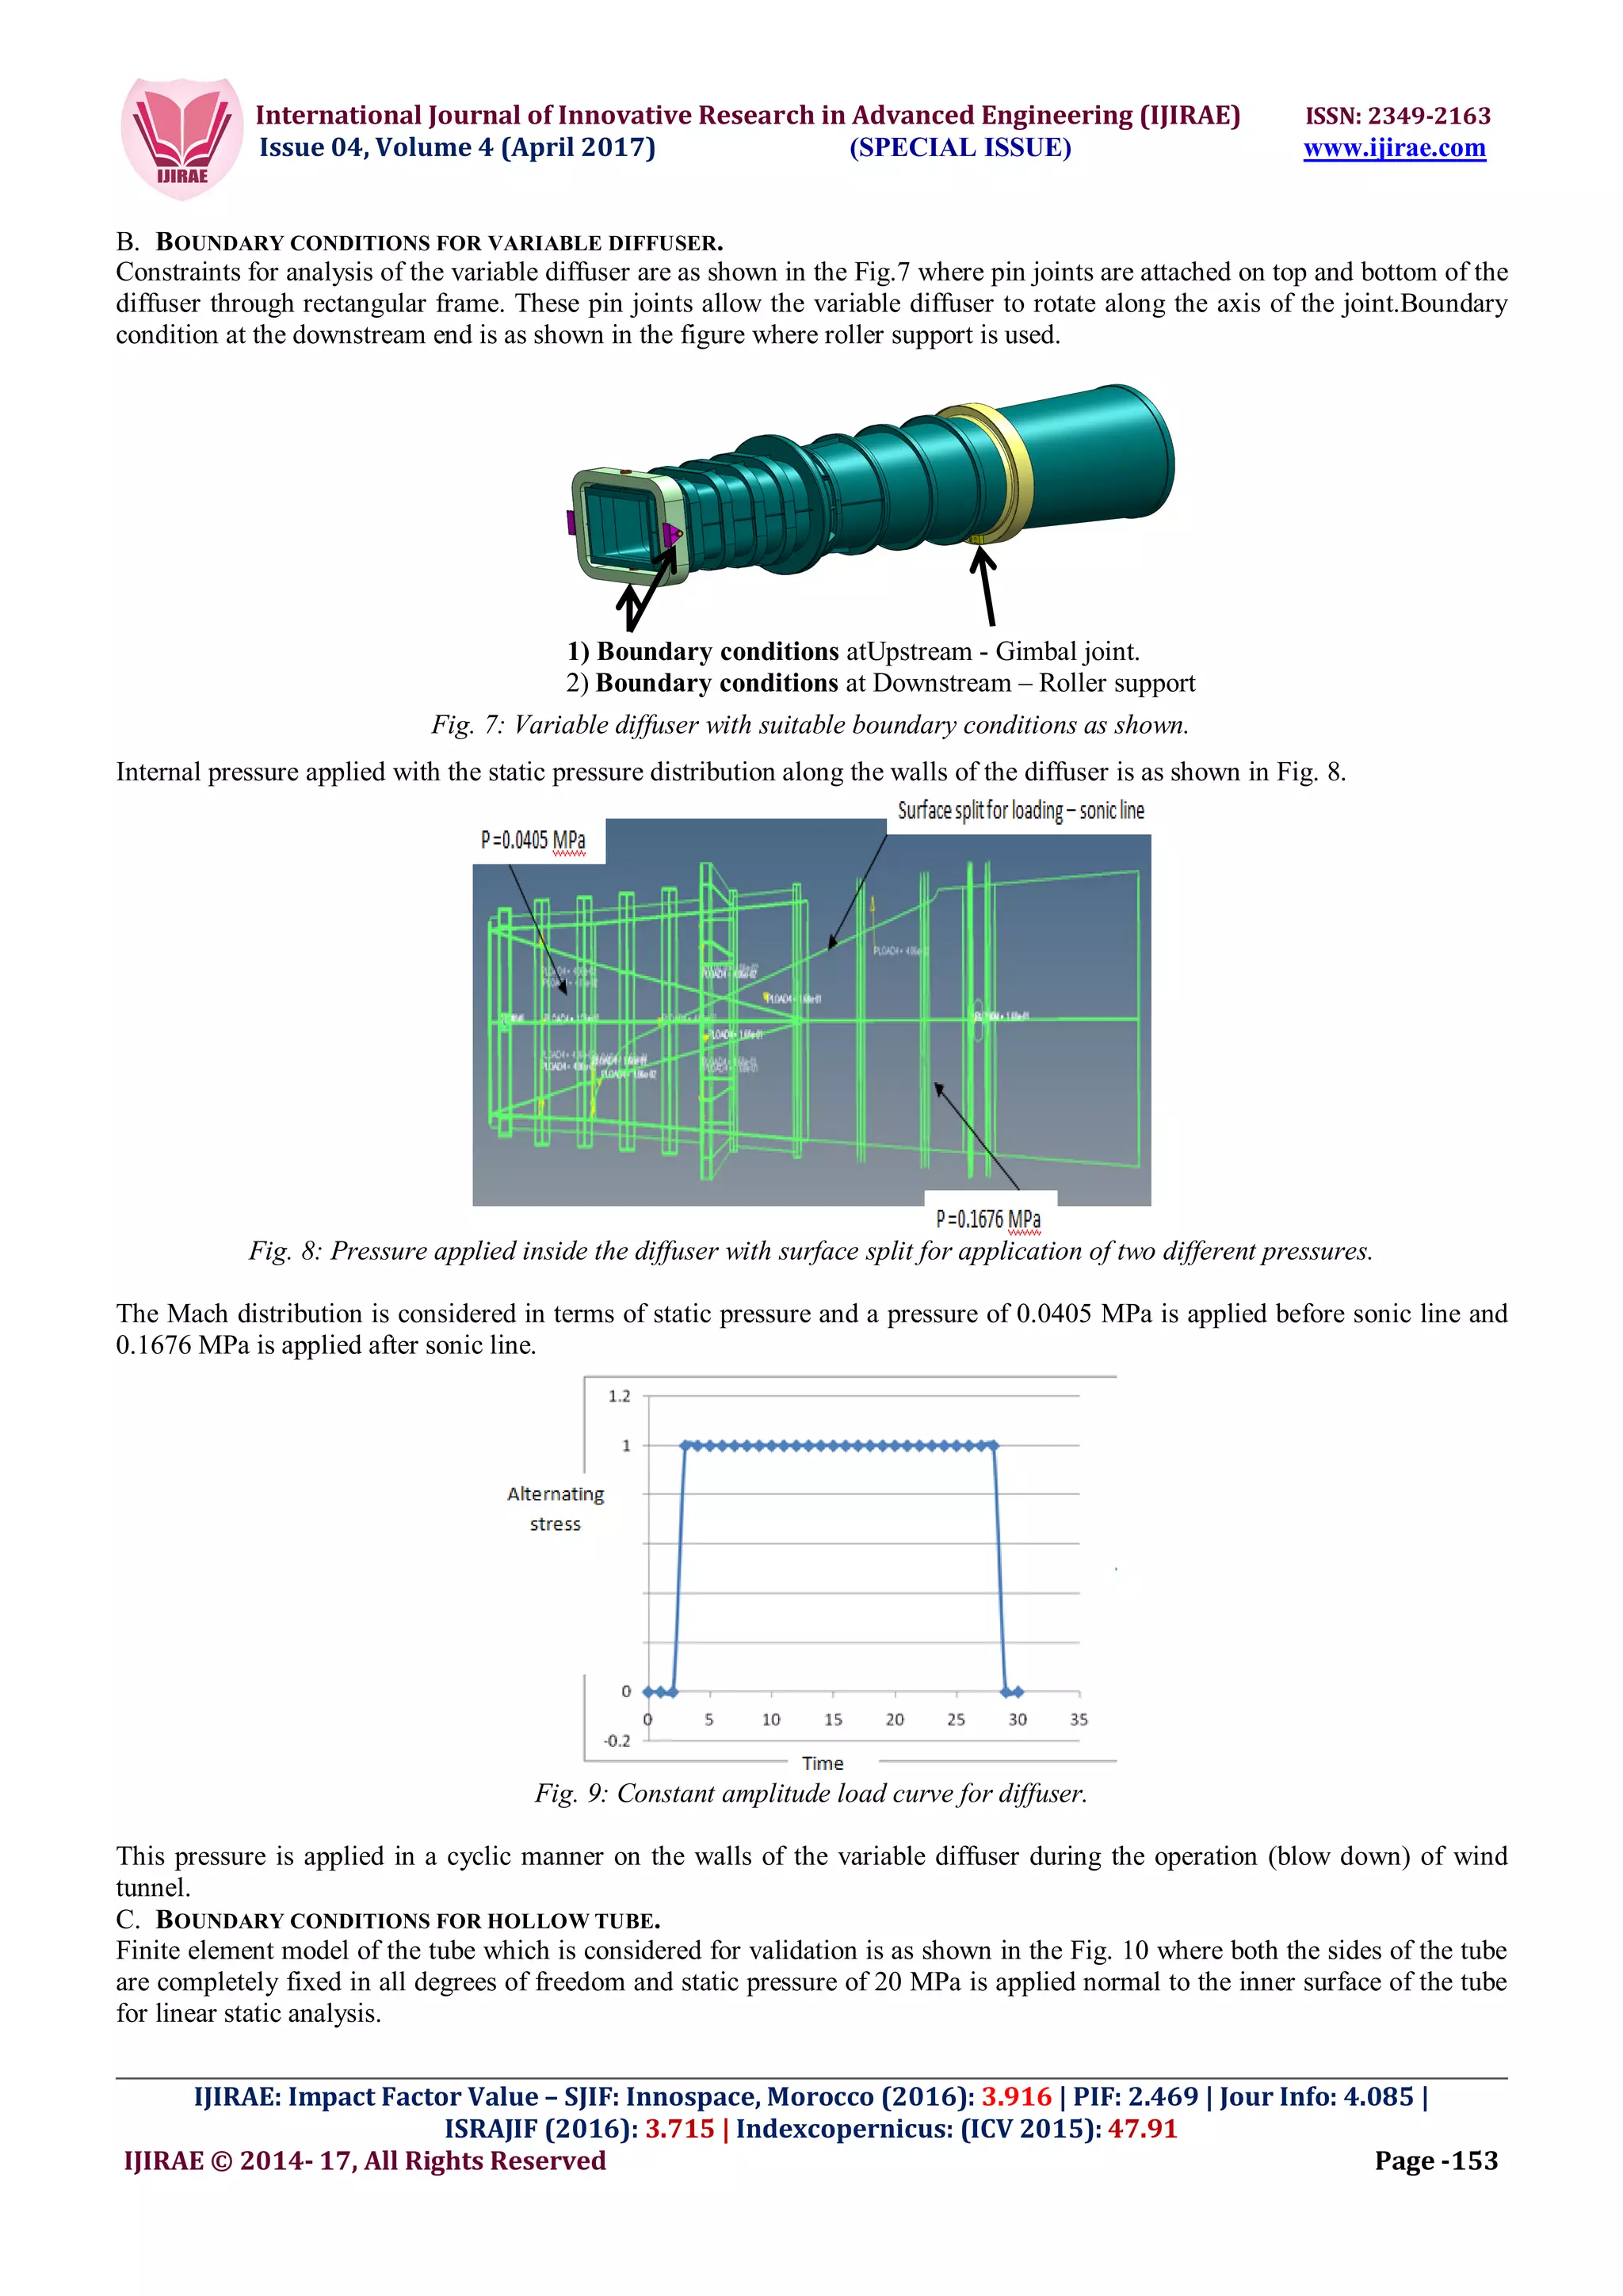
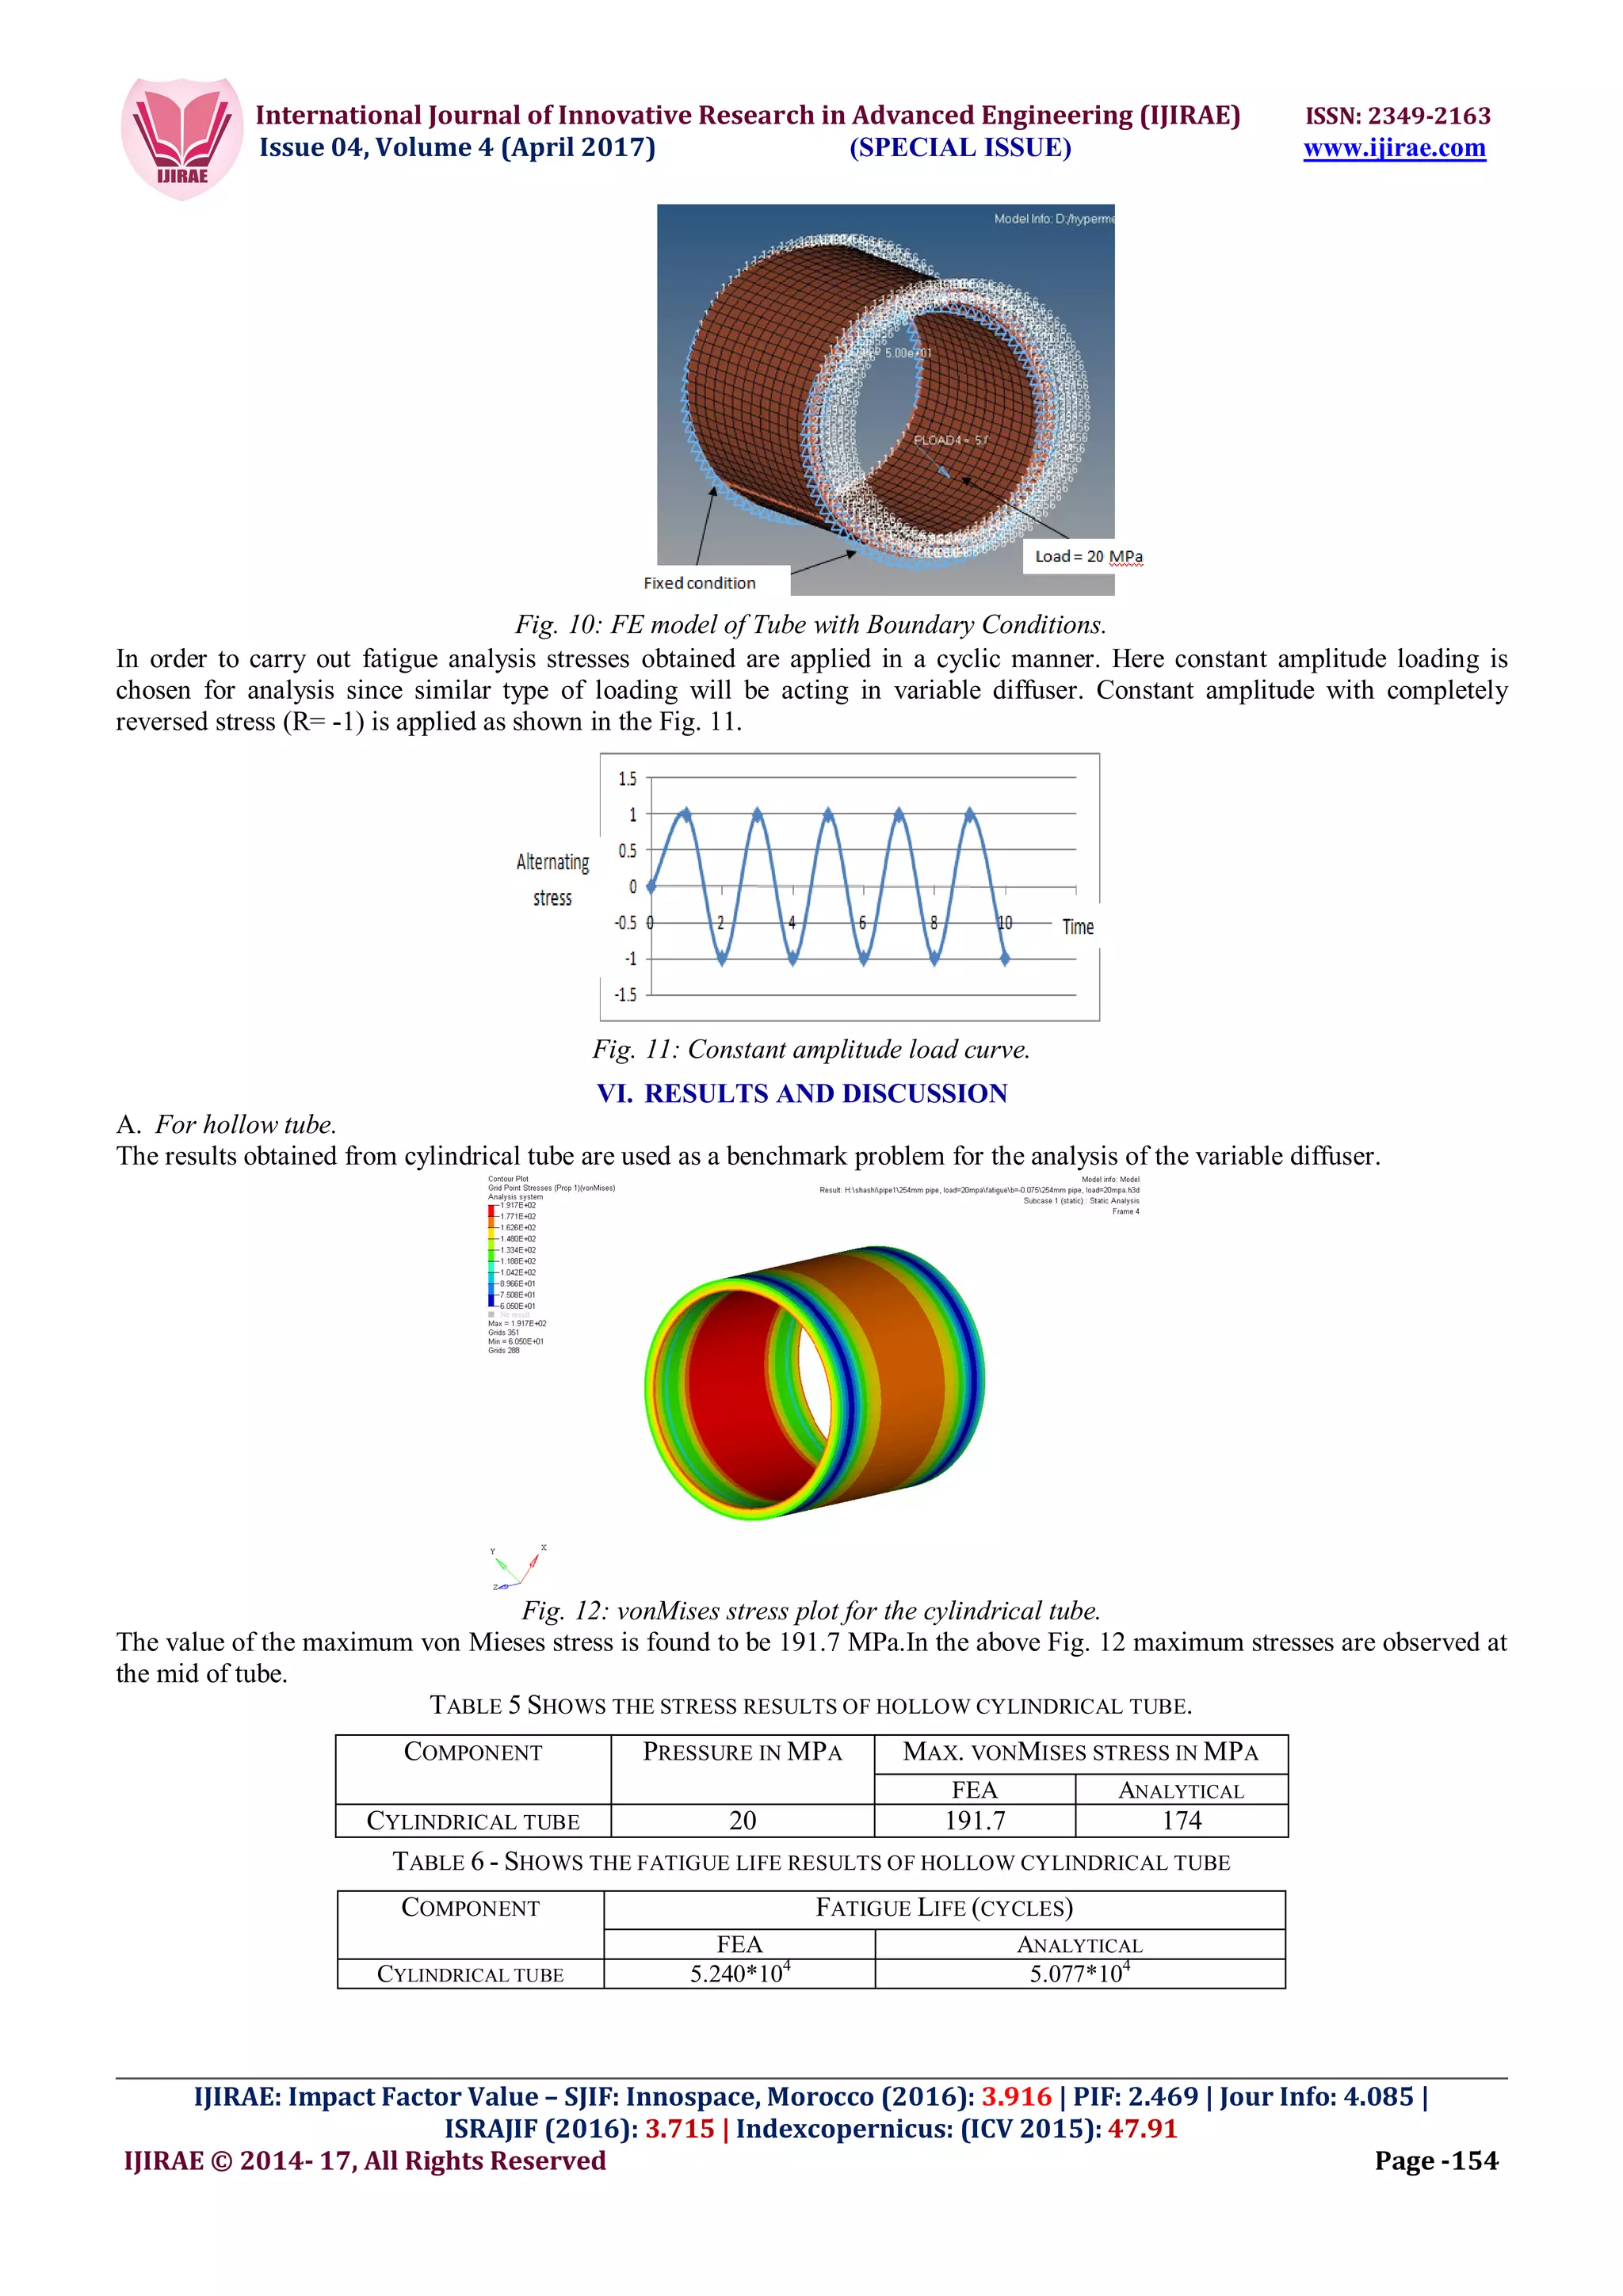
This document discusses the fatigue analysis of a variable diffuser using finite element methods, focusing on life estimation through both stress life and strain life approaches. It highlights the importance of understanding fatigue and stress concentrations in welded structures, particularly in the context of wind tunnel design. The analysis utilizes Hyperworks software for simulations, providing validation through comparison with analytical methods.