
Recommended
Recommended
More Related Content
What's hot
What's hot (20)
Viewers also liked
Viewers also liked (20)
Similar to molecular variations due to phylogeographic factors in channa punctatus
Similar to molecular variations due to phylogeographic factors in channa punctatus (20)
Recently uploaded
Recently uploaded (20)
molecular variations due to phylogeographic factors in channa punctatus
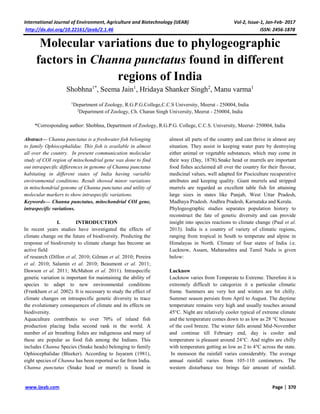
- 1. International Journal of Environment, Agriculture and Biotechnology (IJEAB) Vol-2, Issue-1, Jan-Feb- 2017 http://dx.doi.org/10.22161/ijeab/2.1.46 ISSN: 2456-1878 www.ijeab.com Page | 370 Molecular variations due to phylogeographic factors in Channa punctatus found in different regions of India Shobhna1* , Seema Jain1 , Hridaya Shanker Singh2 , Manu varma1 1 Department of Zoology, R.G.P.G.College,C.C.S University, Meerut - 250004, India 2 Department of Zoology, Ch. Charan Singh University, Meerut - 250004, India *Corresponding author: Shobhna, Department of Zoology, R.G.P.G. College, C.C.S. University, Meerut- 250004, India Abstract— Channa punctatus is a freshwater fish belonging to family Ophiocephalidae. This fish is available in almost all over the country. In present communication molecular study of COI region of mitochondrial gene was done to find out intraspecific differences in genome of Channa punctatus habitating in different states of India having variable environmental conditions. Result showed minor variations in mitochondrial genome of Channa punctatus and utility of molecular markers to show intraspecific variations. Keywords— Channa punctatus, mitochondrial COI gene, intraspecific variations. I. INTRODUCTION In recent years studies have investigated the effects of climate change on the future of biodiversity. Predicting the response of biodiversity to climate change has become an active field of research (Dillon et al. 2010; Gilman et al. 2010; Pereira et al. 2010; Salamin et al. 2010; Beaumont et al. 2011; Dawson et al. 2011; McMahon et al. 2011). Intraspecific genetic variation is important for maintaining the ability of species to adapt to new environmental conditions (Frankham et al. 2002). It is necessary to study the effect of climate changes on intraspecific genetic diversity to trace the evolutionary consequences of climate and its effects on biodiversity. Aquaculture contributes to over 70% of inland fish production placing India second rank in the world. A number of air breathing fishes are indigenous and many of these are popular as food fish among the Indians. This includes Channa Species (Snake heads) belonging to family Ophiocephalidae (Bleeker). According to Jayaram (1981), eight species of Channa has been reported so far from India. Channa punctatus (Snake head or murrel) is found in almost all parts of the country and can thrive in almost any situation. They assist in keeping water pure by destroying either animal or vegetable substances, which may come in their way (Day, 1878).Snake head or murrels are important food fishes acclaimed all over the country for their flavour, medicinal values, well adapted for Pisciculture recuperative attributes and keeping quality. Giant murrels and stripped murrels are regarded as excellent table fish for attaining large sizes in states like Punjab, West Uttar Pradesh, Madhaya Pradesh. Andhra Pradesh, Karnataka and Kerala. Phylogeographic studies separates population history to reconstruct the fate of genetic diversity and can provide insight into species reactions to climate change (Paul et al. 2013). India is a country of variety of climatic regions, ranging from tropical in South to temperate and alpine in Himalayas in North. Climate of four states of India i.e. Lucknow, Assam, Maharashtra and Tamil Nadu is given below: Lucknow Lucknow varies from Temperate to Extreme. Therefore it is extremely difficult to categorize it a particular climatic frame. Summers are very hot and winters are bit chilly. Summer season persists from April to August. The daytime temperature remains very high and usually touches around 45°C. Night are relatively cooler typical of extreme climate and the temperature comes down to as low as 28 °C because of the cool breeze. The winter falls around Mid-November and continue till February end, day is cooler and temperature is pleasant around 24°C. And nights are chilly with temperature getting as low as 2 to 4°C across the state. In monsoon the rainfall varies considerably. The average annual rainfall varies from 105-110 centimeters. The western disturbance too brings fair amount of rainfall.
- 2. International Journal of Environment, Agriculture and Biotechnology (IJEAB) Vol-2, Issue-1, Jan-Feb- 2017 http://dx.doi.org/10.22161/ijeab/2.1.46 ISSN: 2456-1878 www.ijeab.com Page | 371 Approximate average annual rainfall in the state is around 65-70 centimeters. Assam Assam, generally, observes temperate climate. Its weather is characterized by heavy downpour and humidity. Summer, winter and monsoons are the three seasons that visit the state, rainy season marks the most of the months of a year. Summers prevail for a few months between March and June. However, temperature never goes beyond 35°C - 38°C even in the summer months. Rain showers occur erratically and keep the temperature under control, nevertheless humidity levels shoot up. Heavy precipitation lasts till the month of September. During winter, nights and early mornings are misty. This is only time when Assam observes scanty rainfall. Maharashtra The climate of Maharashtra is moderate, with variations in temperature ranging between 16°C and 35°C. July to September are the months when monsoon lashes this state with good rainfall. This does not mean that the whole state gets uniform rainfall; a large part of inner Maharashtra remains dry in comparison to other areas under the rain shadow of the Sahyadri. Tamil Nadu Tamil Nadu has a tropical climate with no wild swing between summer and winter temperature. April and May are the hottest months, Coastal regions also get uncomfortably warm and humid during these months but the nights are usually cool. Winter falls between November-February when the climate is pleasantly cool. Minimum temperatures in the plains rarely dip below 20 ºC. Fig.1: Map of India showing climate of different states. Genetic variations within a species is important for the long term survival. Intraspecific genetic variation is the fundamental level of biodiversity that provides the basis of any evolutionary change (Frankham et al. 2002). Combining genetic data and climate change, represents a significant knowledge in inferring how climate shapes genetic diversity and impact genetic structure. To check variations in mitochondrial genome due to change in climatic factors of these fish, COI sequences of Channa punctatus of four different states of India i.e., Lucknow, Assam, Maharashtra and Tamil Nadu were retrieved from gene bank. These states have different climatic conditions (Fig.1) and there is a possibility that these climatic factors can influence some genetic level changes. COI region was chosen because of its rapid evolution rate, this gene also enables the differentiation of closely related species as well as phylogeographic groups within a single species (Cox and Hebert 2001; Wares and Cunningham 2001). An attempt has been made to evaluate molecular differences in Channa punctatus from different states. Same species should have same motifs (conserved regions) in the sequence i.e. Number of motifs, their frequency and position. Therefore, motifs of each sequence have been made by MEME software to compare the conservedness.
- 3. International Journal of Environment, Agriculture and Biotechnology (IJEAB) Vol-2, Issue-1, Jan-Feb- 2017 http://dx.doi.org/10.22161/ijeab/2.1.46 ISSN: 2456-1878 www.ijeab.com Page | 372 The conserved motifs are found in all species but at variable positions. Gene shifting may be responsible for variable positions of motifs. II. MATERIALS AND METHOD Mitochondrial COI sequences of Channa punctatus of four states (Lucknow, Assam, Maharashtra and Tamil Nadu) were retrieved from Genbank (available at www.ncbi.nlm.nih.gov) having accession number (Lucknow: FJ459409.1, Assam: JN245992.1, Maharashtra: JX260843.1, Tamil Nadu: EU342202.1). To check the similarity search, COI sequences were uploaded on Basic Local Alignment Search Tool (BLAST). The motifs and their regular expressions were predicted with the help of online available MEME software (Timothy et al., 1994). Phylogenetic analysis was performed using Neighbour- Joining (NJ) and Maximum Likelihood (ML) methods with the help of MEGA 6 (Tamura et al., 2011) software. III. RESULTS AND DISCUSSION All sequences aligned using clustal W online software showed similar conserved regions in their genetic material of same species, Channa punctatus but at variable positions. It is noted that same genetic material of all the four species has some variations, incorporated in its position, to adapt to different environmental conditions. The motif prediction confirms conserved regions (motifs) in each sequences and for this, mitochondrial COI sequences of Channa punctatus (from Lucknow, Assam, Maharashtra, and Tamil Nadu) retrieved from GenBank have been used for the motif identification with the help of online available software, MEME. The results of MEME showed three different kinds of motifs in mitochondrial COI sequences of Channa punctatus. Minimum motif width is found of 29 bases and maximum motif width of 50 bases. Base length of motif one and motif two obtained is 50 bases. However, motif three has 29 bases. Motif one is shown as sky blue, two as deep blue and three as red colour. Motif one (Fig. 2), motif two (Fig. 3) and motif three (Fig. 4) are shown. Motif one was repeated 5 times, motif two 3 times and motif three 2 times respectively in sequences of Channa punctatus (FJ459409, JN245992 and JX260843). While in EU342202, motif one was repeated 5 times, motif two 3 times and motif three two times. Positions of motifs in sequences of same species were different from each other which is clearly seen in the combined block diagram (Fig. 5). The order of motifs was found same in all sequences. The shifting pattern is clearly seen in combined block diagram of motifs (Fig. 5). The p- value of the motifs has been also found to be different for each sequence. The combined P-value of all the three motifs of Channa punctatus is 2.46e-37 (in FJ459409), 1.26e-44 (in JN245992), 5.81e-34 (in JX260843) and 1.51e-37 (in EU342202) for all sequences respectively. It indicates that changes in climatic conditions of different regions of India may be responsible for shifting of motifs to adapt themselves. Fig.2: Motif one Fig. 3: Motif two Fig. 4: Motif three
- 4. International Journal of Environment, Agriculture and Biotechnology (IJEAB) Vol-2, Issue-1, Jan-Feb- 2017 http://dx.doi.org/10.22161/ijeab/2.1.46 ISSN: 2456-1878 www.ijeab.com Page | 373 Fig. 5: Combined Block Diagram Phylogenetic Tree prediction When sequences of C. punctatus were BLAST, they were found 99% similar. To check this one percent variation in the mitochondrial genome, Neighbor Joining (NJ) and Maximum Liklihood (ML) trees were constructed by using MEGA 6 software. In ML tree (Fig.7), Lucknow and Assam sequences were found in one clade and Tamil Nadu made an outgroup, which shows that it is slightly different from other groups. For further confirmation, NJ tree (Fig. 6) was constructed which shows that Assam and Maharashtra were in one clade and Tamil Nadu again formed an out group. Fig. 6: Neighbor Joining Tree of COI nucleotide sequences Fig. 7: Maximum likelihood tree of COI nucleotide sequences IV. CONCLUSION This molecular analysis reveals the genetic variations between same species of C. punctatus from different regions with minor variations. These variations are probably because of gene shifting. Reasons for genetic variations are due to their geographical distribution or adaptation in different regions. At molecular level, this genetic comparison between same species from other parts of different states of India may provide further clues to the understanding of the evolution of the species. Motif prediction and phylogenetic trees prediction could be a valuable tool to see Phylogeographic and intraspecific variations in genome. REFERENCES [1] Beaumont, L.J., Pitman, A., Perkins, S., Zimmermann, N.E., Yoccoz, N.G. & Thuiller, W. (2011). Impacts of climate change on the world’s most exceptional ecoregions. Proc. Natl Acad. Sci. USA, 108, 2306– 2311. [2] Cox A. J., Hebert P. D. N. (2001). Colonization, extinction and phylogeographic patterning in a freshwater crustacean. Mol. Ecol. 10, 371-386. [3] Dawson, T.P., Jackson, S.T., House, J.I., Prentice, I.C. & Mace, G.M. (2011). Beyond predictions: biodiversity conservation in a changing climate. Science, 332,53–58. [4] Day. (1878). The Fishes of India; being a natural history of the fishes know to inhabit the seas and freshwaters of India, Burma and Ceylon. I and II: XX- 778; 1-195. [5] Dillon, M. E., Wang, G. & Huey, R.B. (2010). Global metabolic impacts of recent climate warming. Nature, 467, 704–706. [6] Frankham, R., Ballou, J. D. & Briscoe, D. (2002). An Introduction to Conservation Genetics (Cambridge Univ. Press). [7] Gilman, S. E., Urban, M. C., Tewksbury, J., Gilchrist, G.W. & Holt, R.D. (2010). A framework for
- 5. International Journal of Environment, Agriculture and Biotechnology (IJEAB) Vol-2, Issue-1, Jan-Feb- 2017 http://dx.doi.org/10.22161/ijeab/2.1.46 ISSN: 2456-1878 www.ijeab.com Page | 374 community interactions under climate change. Trends Ecol. Evol., 25, 325–331. [8] Jayaram K. C. (1981). The freshwater Fishes of India, Pakistan, Bangladesh, Burma and Srilanka – A Handbook. Zoological survey of India, Calacutta. [9] McMahon, S.M., Harrison, S.P., Armbruster, W.S., Bartlein, P.J., Beale, C.M., Edwards, M.E. et al. (2011). Improving assessment and modelling of climate change impacts on global terrestrial biodiversity. Trends Ecol. Evol., 26, 249–259. [10]Paul, S. U., Nowak, C., Balint, M. & Pfenninger, M. (2013) The impact of global climate change on genetic diversity within populations and species. Mol. Ecol. 22, 925-946. [11]Pereira, H.M., Leadley, P.W., Proenca, V., Alkemade, R., Scharlemann, J.P.W., Fernandez-Manjarres, J.F. et al. (2010). Scenarios for global biodiversity in the 21st century. Science, 330, 1496–1501. [12]Salamin, N., Wu¨est, R.O., Lavergne, S., Thuiller, W. & Pearman, P.B. (2010). Assessing rapid evolution in a changing environment. Trends Ecol. Evol., 25, 692– 698. [13]Tamura, K., Stecher, G., Peterson, D., Filipski, A. & Kumar, S. (2013) MEGA6: Molecular Evolutionary Genetics Analysis version 6.0. Molecular Biology and Evolution:30 2725-2729. [14]Timothy L., Bailey and Charles E. (1994). Fitting a mixture model by expectation maximization to discover motifs in biopolymers. Proceedings of the Second International Conference on Intelligent Systems for Molecular Biology, AAAI Press, Menlo Park, California. 28-36. [15]Wares J. P & Cunningham C.W. (2001). Phylogeography and historical ecology of the North Atlantic intertidal. Evolution 12, 2455-2469.