Population dynamics of ground dwelling spider genera among mustard crop

The present study was designed to record the distribution of ground dwelling spider genera among mustard crop at Okara district. Sampling was made from Brassica compestris crop through pitfall traps. Equal number of traps were placed in three rows e.g. along the boundary, middle of the field and centre of the field. Each trap was filled with mixture solution of alcohol and glycerin (70:30%) along with few drops of kerosene oil. After 5 days interval sample traps was collected and spider specimens were washed with distilled water and permanently stored in labeled glass vials, and brought into the Pest Control Laboratory, Department of Zoology, Wildlife and Fisheries, University of Agriculture, Faisalabad. Thereafter, each spider specimen was identified according to the taxonomic material and internet source. Identified data was analyzed statistically to quantify their spatial distribution. Maximum spatial distribution of spider population was documented in middle transect than boundary and centre of the mustard crop. It was also observed that temperature, humidity and prey availability were the major factors that effecting the spider population. Population variations were recorded during the months of February, March and April in 2015, due to rise of temperature, decrease of humidity and availability of prey. Conclusively, spiders have some correlation with suitable local conditions or habitat. More over, spiders are cost effective, functionally significant and play important role in regulating decomposer population. Get the full articles at: http://www.innspub.net/jbes/population-dynamics-of-ground-dwelling-spider-genera-among-mustard-crop/

Recommended
Recommended
More Related Content
What's hot
What's hot (20)
Similar to Population dynamics of ground dwelling spider genera among mustard crop
Similar to Population dynamics of ground dwelling spider genera among mustard crop (20)
More from Innspub Net
More from Innspub Net (20)
Recently uploaded
Recently uploaded (20)
Population dynamics of ground dwelling spider genera among mustard crop
- 1. J. Bio. Env. Sci. 2016 114 | Rana et al. RESEARCH PAPER OPEN ACCESS Population dynamics of ground dwelling spider genera among mustard crop Muhammad Arshad Rana1* , Munaza Shabnam2 , Naureen Rana3 , Tayyba Sultana4 , Salma Sultana4 , Sobia Kanwal3 , Imran Ahmad4 1 Department of Zoology, Govt. Postgraduate College Okara, Pakistan 2 Department of Biology, Govt. Postgraduate College for women Sahiwal, Pakistan 3 Department of Zoology, Wildlife and Fisheries, UAF, Pakistan 4 Department of Zoology, Govt. College University Faisalabad, Pakistan Article published on February 11, 2016 Key words: Spider, Pitfall, Taxonomic, Population, Transect. Abstract The present study was designed to record the distribution of ground dwelling spider genera among mustard crop at Okara district. Sampling was made from Brassica compestris crop through pitfall traps. Equal number of traps were placed in three rows e.g. along the boundary, middle of the field and centre of the field. Each trap was filled with mixture solution of alcohol and glycerin (70:30%) along with few drops of kerosene oil. After 5 days interval sample traps was collected and spider specimens were washed with distilled water and permanently stored in labeled glass vials, and brought into the Pest Control Laboratory, Department of Zoology, Wildlife and Fisheries, University of Agriculture, Faisalabad. Thereafter, each spider specimen was identified according to the taxonomic material and internet source. Identified data was analyzed statistically to quantify their spatial distribution. Maximum spatial distribution of spider population was documented in middle transect than boundary and centre of the mustard crop. It was also observed that temperature, humidity and prey availability were the major factors that effecting the spider population. Population variations were recorded during the months of February, March and April in 2015, due to rise of temperature, decrease of humidity and availability of prey. Conclusively, spiders have some correlation with suitable local conditions or habitat. More over, spiders are cost effective, functionally significant and play important role in regulating decomposer population. *Corresponding Author: Muhammad Arshad Rana marshadrana719@gmail.com Journal of Biodiversity and Environmental Sciences (JBES) ISSN: 2220-6663 (Print) 2222-3045 (Online) Vol. 8, No. 2, p. 114-123, 2016 http://www.innspub.net
- 2. J. Bio. Env. Sci. 2016 115 | Rana et al. Introduction Fodder crops including mustard are particularly refer to food for animals or live-stock. They comprise of straw, hay, pelleted feed, silage, oils, legumes and sprouted grains. Currently in Pakistan, various fodder crops are cultivated over 15 million hectares with 52 million ton annual fodder production (Anonymous, 2013). However, suitable rainfall and temperature range can enhance the present outcomes (Hussain et al., 2010). Because, in many parts of Pakistan, there is abrupt shortage of fodder for live-stock, and also the available fodder is of poor quality. The farmers are facing a lot of problems to get maximum forage yield to meet the feed requirements. Improved fodder varieties along with control of damage by invading insect pest can overcome the situation. Mustard crop provides valuable supplemental food to live-stock community e.g. nitrogen, energy, minerals and vitamins. Consequently, it increase the availability of nutrients for maintenance and ideal production status. (Douglas et al., 2000). To enhance the yield, control of insect pests is a major issue and use of spiders to control these insect pests is of profound importance. Spiders have globally more than 40,000 identified species (Platnick, 2012). They have remarkable abundance and are highly diversified terrestrial predator especially in agro- ecosystems (Wise, 1993). They can play a pivotal role in keeping insect and pest populations in check and balance and they are also serve as food for birds, snakes, fish and other animals. They eat insects and bugs which destroy different crops and consequently safeguard the agro- ecosystems. By habitat management. We can conserve the diversity of natural enemies (including spiders) of arthropod pest (Douglas et al., 2000). Perennial crops and degree of heterogeneity in their surrounding landscape have a positive effect on their abundance and species richness among cultivated land (Clough et al., 2005). Spider’s abundance and diversity vary in different agro-ecosystems and they have temporo-spatial distribution in all agricultural lands to effectively destruct the insect pest population (Seyfulina and Tshernyshev, 2001; Seyfulina, 2003). Their breeding success is directly related to amount of precipitation which act as potential factors to affect the abundance and species richness (Thomas et al., 2014). They are most important arthropods for economic point of view playing role as biological control agent and their adaptation towards different habitats (Kazim et al., 2014). Keeping in view the importance of spider densities and role of mustard in live-stock sector, the present study was designed to record the population dynamics and spatial distribution of ground dwelling spider families and genea among mustard crop at Okara district. Materials and methods Study area The present study was designed to record spatial distribution of ground dwelling spiders among mustard crop at Okara district. Because information about their distribution in any agro-ecosystem was pre-requisite to formulate any strategy to use them for bio-control purposes. Presently, these informations were recorded from Okara district. Mustard crop was cultivated in one acre rectangular field. The sampling field was surrounded by wheat fields from two sides, where as on third side, it was surrounded by a Trifolium and Mustard field. Okara district Okara district is situated in Punjab province at 30, 8081 (304829.160”N) latitude and 73, 4458 (732644.880”E) longitude. This district is bounded on the East by Kasur district, Sahiwal and Pakpattan districts on the West, Sheikhupura and Faisalabad districts on the North and Bahawalnagar district on the South. The Indian border also lies on the South- Eastern side of the district. Okara district has a total area of 4,377 square kilometres and comprises of three tehsils i.e. Okara, Depalpur and Renala Khurd.
- 3. J. Bio. Env. Sci. 2016 116 | Rana et al. Climate The climate of the Okara district is hot in summer and cold in winter. May and June are hottest months and January is the coldest one.Temperature ranges between 36-440C in summer and 2-280C in winter. Soil of the district is loamy and sandy loamy with annual rainfall up to 200 mm. Sampling design and techniques The sampling was carried out from October, 2014 through April, 2015 to collect the ground dwelling spider fauna in mustard crop.Total thirty traps were set in the field for five successive days. The two successive traps were at equal distance from each other and the distance from outer boundary of the field was 5m. Pitfall traps were 12cm long glass jars with 6cm (diameter) wide mouths. Each trap contained 150 ml of 70% ethyl alcohol and a small amount of kerosene oil which served as preservative and killing agent.Ten pitfall traps were laid along each transect line i.e. boundary, middle and centre at an equal interval from each other. Collection of data For mustard crop, ideal field measuring 7200 sq. ft. were selected to observe the spatial distribution of ground dwelling spiders through pitfall trap method. However, trapping was made by three layers inside the field radius wise to observe the infestation along the entire field. Data was collected fortnightly and collected specimens were brought into the Pest Control Laboratory, Departmentof Zoology, Wildlife and Fisheries, University of Agriculture, Faisalabad. All the specimens were identified according to the reference material. Preservation All traps were taken to Pest Control Laboratory, Department of Zoology, Wildlife and Fisheries, University of Agriculture, Faisalabad. Where the specimens were washed with xylene and preserved in 95% ethanol containing few drops of glycerin. Specimens were preserved separately in small glass vials indicating with trap number and the date of capture. Identification The collected samples were identified with the aid of naked eye, magnifying glass and under the microscope. All the specimens were identified up to species level according to the taxonomic and reference material (Tikader and Malhotra (1982), Tikader and Biswas (1981), Barrion and Litsinger (1995), Zhu et al. (2003), Platnick (2012), other relevant literature and internet source. Statistical analysis Thereafter, all the identified specimens were arranged in table form according to their morphological characters e.g. family, genus. To determine the various aspects of diversity, Shannon Diversity Index was used (Magurran, 1988). Analysis of Variance was made to compare the population means between three transects, i.e. Boundary, middle and centre of mustard crop. The richness, diversity and evenness indices were computed by using the Programme SPDIVERS.BAS. Results The present study was conducted to highlight the population dynamics of ground dwelling spider genera among mustard crop at Okara district. A total number of 421 specimen pertaining to 21 genera and 7 families among mustard crop were identified from Okara district (Table 1). Population variations among families in mustard crop Data presented in Table 2, is pertaining to family’s wise comparison of spider’s population recorded from two fodder crops during the study. In Mustard crop, the population of wolf spiders – family Lycosidae was recorded with highest population (N = 147), followed by Flat bellied ground spiders – family Gnaphosidae (N = 90), Sheat weaver spiders – family Linyphiidae (N = 75), Jumping spiders –, Orb-weaver spiders – family Aranidae (N = 34), Crab spiders-- family Thomisidea (N = 33) and Sac spiders—family
- 4. J. Bio. Env. Sci. 2016 117 | Rana et al. Clubionidae (N = 21) and family Salticidae (N = 21) respectively. The maximum population of family wolf spiders – family Lycosidae was recorded due to that they were strictly ground dwelling spiders. Second and third highest population recorded were of Flat bellied ground spiders – family Gnaphosidae and Sheat weaver spiders – family Linyphiidae respectively due to the reason that they were also ground living and live in high vegetation density, so the existing environment was supportive for them. However, minimum population of identified spiders in case of Jumping spiders – family Salticidae followed by Orb-weaver spiders – family Araneidae, Crab spiders -- family Thomisidea and Sac spiders — family Clubionidae was recorded from mustard field. Table 1. The number of families, genera and species recorded from mustard field at Okara district. Sr.No. Families No. of Specimen No. of Genera 1 Araneidae 34 4 2 Clubionidae 21 1 3 Gnaphosidae 90 4 4 Linyphiidae 75 3 5 Lycosidae 147 4 6 Salticidae 21 2 7 Thomisidea 33 3 Total 7 421 21 Their low population was recorded due to that they live in leaf litter and shaddy areas. The study area was surrounded by wheat crops from north and east side and mustard crop from west side. Whole cultivated area was comprised of crop land and there were no shaddy trees near the study area. Direct temperature variation hazards and use of different pesticides on crop lands become a reason for their decline in population. Another reason for their least collection was that, they were foliage spiders and the pitfall method was applied for the collection of spiders. Table 2. Monthly record of spider families captured from the mustard crop at Okara district. Families Nov-14 Dec-14 Jan-15 Feb-15 Mar-15 Apr-15 Total Araneidae 4 3 0 4 9 11 31 Clubionidae 2 0 0 4 6 12 24 Gnaphosidae 6 2 2 22 27 31 90 Linyphiidae 7 4 1 15 25 25 75 Lycosidae 12 1 3 32 43 54 147 Salticidae 2 0 0 5 7 7 21 Thomisidea 2 1 0 8 12 10 33 Grand Total 35 11 6 90 129 150 421 Population variations among genera in mustard crop Data presented in Table 3, is regarding the comparison of spiders’ population among genera recorded in berseem and mustard fields during the study. Maximum population of identified genera in mustard crop was recorded in case of genus Evapa (N=60) followed by Lycosa (N=41) and Gnaphosa (N=38) respectively. Because they were ground dwelling spiders but live in shelter places while in mustard field, fodder was cut down again and again that’s why their minimum population was recorded.
- 5. J. Bio. Env. Sci. 2016 118 | Rana et al. Relative abundance of spider genera in mustard crop During the month of November 2014 (Table 4), maximum relative abundance was recorded for Evippa (Family Lycosidae) 14.28% (n ≥ 05) followed by Drassodes (Family Gnaphosidae), Tchatkalophantes (Family Lyniphiidae), Lycosa (Family: Lycosidae) 8.57 % (n ≥ 03). Table 3. Monthly record of spider’s genera captured from mustard field at Okara district. Family Genera Nov-14 Dec-14 Jan-15 Feb-15 Mar-15 Apr-15 Total Araneidae Araneus Clerck, 1757 1 1 0 2 3 7 14 Gea C. L. Koch, 1843 1 1 0 1 2 2 7 Neoscona Simon, 1864 1 0 2 2 5 Cyclosa Menge, 1866 1 1 0 1 2 3 8 Clubionidae Clubiona latreille,1804 2 0 0 4 6 9 21 Gnaphosidae Drassodes 3 1 1 8 9 16 38 Gnaphosa Latreille, 1804 1 0 4 5 3 13 Scotophaeus Simon, 1893 1 0 4 6 6 17 Zelotes Gistel, 1848 1 1 1 6 7 6 22 Linyphiidae Tapinocyboides Wiehle, 1960 2 0 0 4 7 8 21 Tchatkalophantes Tanasevitch, 2001 3 1 1 6 9 8 28 Tiso Simon, 1884 2 1 0 5 9 9 26 Lycosidae Evippa Simon, 1882 5 2 1 12 18 22 60 Hogna Simon,1885 2 0 1 3 3 6 15 Lycosa Latreille, 1804 3 1 9 13 15 41 Pardosa C. L. Koch, 1847 2 0 1 8 9 11 31 Salticidae Myrmarachne MacLeay, 1839 2 0 0 3 3 3 11 Plexippus C. L. Koch, 1846 0 0 0 2 4 4 10 Thomisidea Runcinia Simon, 1875 1 1 0 2 5 4 13 Thomisus Walckenaer, 1805 1 0 0 3 3 2 9 Xysticus 0 0 0 3 4 4 11 Grand Total 35 11 6 90 129 150 421 Table 4. Relative abundance of spider’s genera captured from the Mustard crop at Okara district. Family Genera Nov-14 Dec-14 Jan-15 Feb-15 Mar-15 Apr-15 Araneidae Araneus Clerck, 1757 2.85(1) 9.09(1) 0.00(0) 2.22(2) 2.32(3) 4.67(7) Gea C. L. Koch, 1843 2.85(1) 9.09(1) 0.00(0) 1.11(1) 1.55(2) 1.33(2) Neoscona Simon, 1864 2.85(1) 0.00(0) 0.00(0) 0.00(0) 1.55(2) 1.33(2) Cyclosa Menge, 1866 2.85(1) 9.09(1) 0.00(0) 1.11(1) 1.55(2) 2.0(3) Clubionidae Clubiona latreille,1804 5.71(2) 0.00(0) 0.00(0) 12.12(4) 4.65(6) 6.0(9) Gnaphosidae Drassodes 8.57(3) 9.09(1) 16.66(1) 8.88(8) 6.97(9) 10.66(16) Gnaphosa Latreille, 1804 2.85(1) 0.00(0) 0.00(0) 12.12(4) 3.87(5) 2.0(3) Scotophaeus Simon, 1893 2.85(1) 0.00(0) 0.00(0) 12.12(4) 4.65(6) 4.0(6) Zelotes Gistel, 1848 2.85(1) 9.09(1) 16.66(1) 6.66(6) 5.42(7) 4.0(6) Linyphiidae Tapinocyboides Wiehle, 1960 5.71(2) 0.00(0) 0.00(0) 12.12(4) 5.42(7) 5.33(8) Tchatkalophantes Tanasevitch, 2001 8.57(3) 9.09(1) 16.66(1) 6.66(6) 6.97(9) 5.33(8) Tiso Simon, 1884 5.71(2) 9.09(1) 0.00(0) 15.15(5) 6.97(9) 6.0(9) Lycosidae Evippa Simon, 1882 14.28(5) 18.18(2) 16.66(1) 13.33(12) 13.95(18) 14.66(22) Hogna Simon,1885 5.71(2) 0.00(0) 16.66(1) 3.33(3) 2.32(3) 4.0(6) Lycosa Latreille, 1804 3 9.09(1) 0.00(0) 10.0(9) 10.07(13) 10.0(15) Pardosa C. L. Koch, 1847 5.71(2) 0.00(0) 16.66(1) 8.88(8) 6.97(9) 7.33(11) Salticidae Myrmarachne MacLeay, 1839 5.71(2) 0.00(0) 0.00(0) 3.33(3) 2.32(3) 2.0(3) Plexippus C. L. Koch, 1846 0.00(0) 0.00(0) 0.00(0) 2.22(2) 3.10(4) 2.66(4) Thomisidea Runcinia Simon, 1875 2.85(1) 9.09(1) 0.00(0) 2.22(2) 3.87(5) 2.66(4) Thomisus Walckenaer, 1805 2.85(1) 0.00(0) 0.00(0) 3.33(3) 2.32(3) 1.33(2) Xysticus 0.00(0) 0.00(0) 0.00(0) 3.33(3) 3.10(4) 2.66(4) Grand Total 8.31(35) 2.61(11) 1.41(6) 21.37(90) 30.64(129) 35.62(150)
- 6. J. Bio. Env. Sci. 2016 119 | Rana et al. However, following genera were recorded with least relative abundance; Araneus, Gea. Neoscona, Cyclosa (Family Araneidae), Gnaphosa, Scotophaeus, Zelotes (Family Gnaphosidae), Runcinia, Thomisus, (Family Thomisidae) were all have equal abundance i.e. 2.85% (n ≤ 01). However, remaining all the recorded and identified genera were not documented during this month. During the month of December 2014, maximum relative abundance was recorded for Evippa (Family Lycosidae), 18.18% (n ≥ 02) followed by Araneus, Gea, Cyclosa (Family Araneidae), Drassodes, Zelotes (Family Gnaphosidae), Tchatkalophantes, Tiso (Family: Lyniphiidae) Lycosa (Family Lycosidae), Runcinia (Family Thomisidae) were have equal relative abundance 9.09% (n ≥ 01). However, remaining all the recorded and identified genera were not documented during this month. During the month of January 2015, almost equal relative abundance was recorded for Drassodes, Zelotes (Family Gnaphosidae), Tchatkalophantes (Family Lyniphidae), Evippa, Hogna, Pardosa (Family Lycosidae) were have relative abundance 16.66% (n ≥ 01). However, remaining all the recorded and identified genera were not documented during this month. Table 5. Number of genera(S), total number of samples(N), Shannon diversity index, Lambda value, Evenness and dominance for transect-wise monthly record of mustard crop for different species. Month S N H Shannon Lambda Evenness Dominance November 19 35 2.8053 0.0694 0.9527 0.0473 December 10 11 2.2719 0.1074 0.9867 0.0133 January 6 6 1.7918 0.1667 1.000 0.000 February 20 90 2.8116 0.0696 0.9386 0.0614 March 21 129 2.8618 0.0671 0.94 0.060 April 21 150 2.8191 0.072 0.9259 0.0741 During the month of February 2015, maximum relative abundance was pertaining to Evippa (Family: Lycosidae) 13.33 (n ≥ 12), followed by Lycosa (Family: Lycosidae) 10.0% (n ≥ 09), Drassodes (Family: Gnaphosidae), Pardosa (Family Lycosidae) 8.88% (n ≥ 08), Zelotes (Family Gnaphosidae), Tchatkalophantes (Family: Lyniphidae) were have equal relative abundance 6.66% (n ≥ 06) and minimum relative abundance was recorded for Araneus (Family: Araneidae), Plexippus (Family: Salticidae), Runcinia (Family: Thomisidae) were have equal relative abundance 2.22% (n ≤ 02) followed by Gea, Cyclosa, (Family: Araneidae) 1.11% (n ≤ 01). However, remaining all the recorded and identified genera were not documented during this month. Where as in month of March 2015, maximum relative abundance wss recorded for Evippa (Family: Lycosidae), 13.95% (n ≥ 18) followed by Lycosa (Family: Lycosidae), 10.07% (n ≥ 13), Drassodes (Family: Gnaphosidae), Pardosa (Family: Lycosidae), Tapinocyboides, Tiso (Family: Lyniphidae), 6.97%(n≥ 09), Zelotes (Family: Gnaphosidae), Tapinocyboides (Family: Lyniphidae), 5.42% (n ≥ 07) and minimum relative abundance was recorded for Araneus (Family: Aranidae), Hogna(Family: Lycosidae), Myrmarachne (Family: Saltisidae), Thomisus (Family: Thomisidae) have the relative abundance 2.32% (n ≤ 03) followed byGea, Neoscona, Cyclosa (Family: Aranidae), 1.55% (n ≤ 02). During the month of April 2015, relative abundance was recorded maximum in case of Evippa (Family: Lycosidae), 14.66% (n ≥ 22) followed byDrassodes (Family: Gnaphosidae), 10.66% (n ≥ 16), Lycosa (Family: Lycosidae) 10.0% (n ≥ 15), Pardosa (Family: Lycosidae), 7.33% (n ≥ 11), Clubiona (Family: Clubionidae), Tiso (Family: Gnaphosidae) 6.0% (n ≥ 09). While, minimum relative abundance was recoded for Cyclosa (Family: Aranidae), Gnaphosa (Family: Gnaphosidae), Myrmarachne (Family: Salticidae), 2.0% (n ≤ 03), Gea, Neoscona (Family: Aranidae), Thomisus (Family: Thomisidae) 1.33% (n ≤ 02).
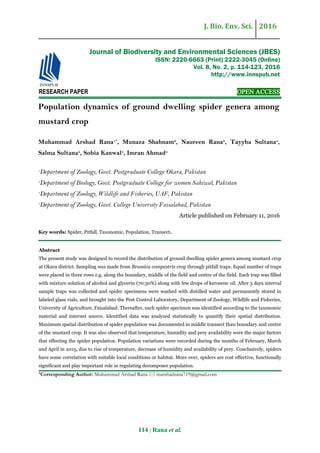
- 7. J. Bio. Env. Sci. 2016 120 | Rana et al. Table 6. Analysis of variance table for transect-wise abundance of different genera for different crops. Source of variation Degrees of freedom Sum of squares Mean squares F-value Months Crop Transect Crop x Transect Error Total 5 1 2 2 25 35 16332.6 49.0 4423.7 24.5 3893.1 24722.9 3266.51 49.00 2211.86 12.25 155.72 20.98** 0.31NS 14.20** 0.08NS NS = Non-significant (P>0.05); * = Significant (P<0.05); ** = Highly significant (P<0.01). Month wise mean ± SE. Month Mean ± SE November-14 December-14 January-15 February-15 March-15 April-15 11.50±3.03 4.00±0.82 2.33±0.71 26.33±6.73 42.33±9.22 60.83±11.79 CD D D C B A Means sharing similar letters are statistically non-significant (P>0.05). Crops x Transect interaction mean ± SE. Transect Mustard Crop Mean ± SE Boundary 27.50 ± 8.82 Middle 34.00 ± 12.87 Center 8.67 ± 3.71 Mean 23.39 ± 5.66A Means sharing similar letter in a row or in a column are statistically non-significant (P>0.05). Comparison of diversity indices among mustard crop Data presented in Table 5, is pertaining the month wise comparison of diversity indices among genera from mustard crop. Overall genera wise maximum diversity (H”) recorded in Mustard crop during the month of November was 2.8053, evenness 0.9527 and dominance 0.0473 respectively. During the month of December maximum diversity 2.2719, evenness 0.9867 and dominance 0.0133 was recorded. During the month of January maximum diversity 1.7918, evenness 1.0000 and dominance 0.0000 was recorded. During the month of February maximum diversity 2.8116, evenness 0.9386 and dominance 0.0614 was recorded. During the month of March maximum diversity 2.8618, evenness 0.9400 and dominance 0.060 was recorded. During the month of April maximum diversity 2.8191, evenness 0.9259 and dominance 0.0741 was recorded. Maximum diversity 2.8618 was recorded during the month of March. While, evenness 1.0000 and dominance 0.0741 were recoded during the month of January and April respectively. Relative abundance Pie graph (Fig.1) represent the relative abundance of
- 8. J. Bio. Env. Sci. 2016 121 | Rana et al. identified spider families in mustard crop at Okara district. Maximum abundance of spiders was recorded in case of family Lycosidae 35% followed by Gnaphosidae 21% and Lyniphiidae 18%. Minimum abundance of spiders was recorded in family Araneidae 7% followed by Clubionidae 6% and Salticidae 5% respectively. Maximum relative abundance was recorded during start of November. However, ratio of relative abundance was equal in start of December and January. It increased gradually up to April and then decreased. Fig. 1. Pie graph represent the relative abundance of spider families in mustard crop. Analysis of variance Data represented in Table 6, pertaining to Analysis of variance for transect-wise abundance of different genera of spiders for mustard crop.The mean number of spider genera in mustard crop at district Okara was statistically similar. The mean number of spider’s population month wise and transect wise were statistically highly significant (P<0.01). The mean number of spider’s population during the month of December (4.00±0.82) and January (2.33±0.71) were statistically non significant (P>0.05), when compared with mean number in November (11.50±3.03), February (26.33±6.73), March (42.33±9.22) and April (60.83±11.79) was statistically significan (P<0.05). Crop x Transect-wise mean number of spider genera in boundary (27.50±8.82) and middle (34.00±12.87) were statistically non significant (P>0.05) when compared with mean number in centre (8.67±3.71) was statistically significant (P<0.05) among mustard crop. Overall mean number of spider genera in mustard crop (23.39±5.66) was statistically non significant (P>0.05). Discussion Seasonal variations in spider population Evidences regarding sesaonal variations of spider population was underlined by considering the findings of previous researchers because field type, management pattern, agronomic operations and use of pesticides, soil culture and floral structures significantly affect spider’s population (Liljesthrom et al., 2002; Ahmad et al., 2005; Pradeep et al., 2015). It was also estimated that start of breeding season, enhancment in growth and acceleration in maturity were proportional to temperature and humidity. As temperature reached above 25°C, start in breeding occur and with decrease in temperature up to the same situation and increase in humidity, it comes to the end. Findings of present study are in agreement with Rajeswaran et al. (2005); Dippenaar-Schoeman (2006); Mushtaq et al. (2003 & 2005); Kazim et al. (2014), Pradeep et al. (2015). It is obvious from the indices calculations that spider’s abundance decrease with the decrease in
- 9. J. Bio. Env. Sci. 2016 122 | Rana et al. temperature and increase in humidity. These findings support the earlier reports of Mushtaq et al. (2003 & 2005); Iqbal et al. (2009) and Pradeep et al. (2015). Resultantly, ecological imbalance of prey verses predators develops which upset the all ecological pyramids and natural cycling. Sustainable prey and predator status is limiting for integrity of any natural system for long term functions. These findings are in same cotext as reported by Rajeswaran et al. (2005); Dippenaar-Schoeman (2006); Mushtaq et al. (2003 & 2005); Kazim et al. (2014), Pradeep et al. (2015). Conclusion Conclusively, despite to cosmopolitan nature, spiders have some correlation with suitable local conditions or habitat. However, it was also observed that spider’s population in the same study region were also effected by increase or decrease in temperature and humidity. So, there is necessity of future research for the proper use of spider fauna as biological control agent in IPM programmes. References Ahmad S, Ghafoor A, Iqbal MZ. 2005. Biodiversity of Gnaphosid spiders of Triticum vulgare from District Okara, Punjab, Pakistan. Indus Journal Biological Science 2(4),477-482. Anonymous. 2012-13. Agricultural Statistics of Pakistan. Ministry of Food and Agriculture (Economic Wing), Government of Pakistan. Islamabad. Barrion AT, Litsinger TA. 1995. Riceland spider of South and South Asia. International Rice Research Institute Philphines. Clough Y, Kruess A, Tscharntke T. 2007. Local and landscape factors in differently managed arable fields affect the insect herbivore community of a non- crop plant species. Journal of Applied Ecology 44, 22-28. Dippenaar-Schoeman A. 2006. Spiders - The African Farmer's Best Friend. Science in Africa – Africa's First On-Line Science Magazine, 1-4 P. Douglas AL, Stephen DW, Geoff MG. 2000. Habitat management to conserve natural enemies of arthropod pests in agriculture. Annu. Rev. Ent. 45, 175-201. Ghaffar A, Musthaq S, Rana SA, Khalil-ur- Rehman. 2011. Influence of Citrus and Guava Branch Architecture on Foliage Spider Fauna. Journal of Agriculture Biology 13, 406-410. Govt. of Pakistan. 2010. Agriculture Statistics, Federal Bureau of Statistics, Ministry of Economics Affairs and Statistics, Pakistan. Hussain A, Khan S, Bakhsh A, Imran M, Ansar M. 2010. Variability in fodder production potential of exotic oats (Avenasativa) genotypes under irrigated conditions. Journal of Agriculture Research 48, 65- 71. Iqbal MZ. 2009. Farmer’s perceptions about bio- control of arthropods and hazardous impacts of pesticides in cotton fields. M.Phil. Thesis in Zoology, University of Agriculture, Faisalabad, 62-75 P. Kazim M., Perveen R, Hussain R, Fatima N. 2014. Biodiversity of spiders (Arachnida: araneae) of Karachi (urban) Sindh province, Pakistan. Journal of Entomology and Zoology Studies 2 (6), 308-313. Khalil IA, Jan A. 2000. Cropping Technology. Millennium Ed. National Book. Liljesthrom G, Minervino E, Castro D, González A. 2002. La comunidad de arañas Del cultivo de soja en la provincia de Buenos Aires, Argentina. Neotropical Entomology 3(2), 197-210. Magurran AE. 1988. Ecological diversity and its measurement. Princeton University Press, New Jersey, 34-36 P.
- 10. J. Bio. Env. Sci. 2016 123 | Rana et al. Mushtaq S, Beg MA, Aziz S. 2003. Biodiversity and temporal varieties in the abundance of cursorial spiders of a cotton field at Faisalabad. Pakistan Journal of Zoology, 35(2), 125-131. Musthaq S, Ali, MA, Riaz M, Murtaza A, Ahmad S. 2005. Spider asinsect’s natural enemies: evaluation of feeding niche of co-existing foliage species in cotton. Indus Cotton, 2, 193-204. Platnick NI. 2012. The world spider catalog, version 12.5. American Museum of Natural History, online at http://research.amnh.org/iz/spiders/catalog. Pradeep M, Sankaran, Malamel, Jobi J, Sebastian PA. 2015. Redescription of the orb- weaving spider Gasteracantha geminate (Fabricius, 1798) (Araneae, Araneidae) Zootaxa, 3915 (1), 147– 150. Rajeswaran J, Duraimurugan P, Shanmugam. PS. 2005. Role of spiders in agriculture and horticulture ecosystem. Journal of Food and Agriculture Environment 3(3-4), 147 152. Rittschof CC. 2012. The effects of temperature on egg development and web site selection in Nephila clavipes. Journal of Arachnology, 40(1), 141-145. Seyfulina RR. 2003. Spatial distribution of spiders (Arachnida: Araneae) in agro-ecosystems of the European part of Russia. Proc. 21stEur. Colloq. Arachnol. 275-292 P. Seyfulina RR, Tshernyshev VB. 2001. Hortobiont spiders (Arachnida, Araneae) in agro-ecosystems of Moscow Province (species composition, spatial distribution and seasonal dynamics). ENT. Obozr. 81(Suppl. 1), 137-148. Tikader BK, Biswas B. 1981. Spider fauna of Calcutta and vicinity. Rec. Zool. Surv. India, 30: 1- 148. Tikader BK, Malhotra MS. 1982. The fauna of India. Araneae, I (Part II). Lycosidae. Zool. Surv. India, Calcutta. Thomas O, Mér O, Janjatovi M, Horváth R, Mrkobrad K, Žuljevic A. 2014. Factors influencing the appearance of spider (Araneae) and beetle (Coleoptera) assemblages in nests of great reed warbler Acrocephalus arundinaceus. Biologia, 69(7), 920-925. Wise DH. 1993. Spiders in ecological webs. Cambridge Univ. Press. Younas M, Yaqoob M. 2005. Feed resourcesof live-stock in the Punjab, Pakistan. Live-stock Resarch for Rural Development. Zhu MS, Song DX, Zhang JX. 2003. Fauna Sinicaa: Arachnidat, Aranea, Tetragnathidae. Science Press, Beijing, China, 418 P.